

Quantitative evaluation of skin disorders in type 1 diabetic mice by in vivo optical imaging
- PMID: 31259069
- PMCID: PMC6583333
- DOI: 10.1364/BOE.10.002996
Quantitative evaluation of skin disorders in type 1 diabetic mice by in vivo optical imaging
Abstract
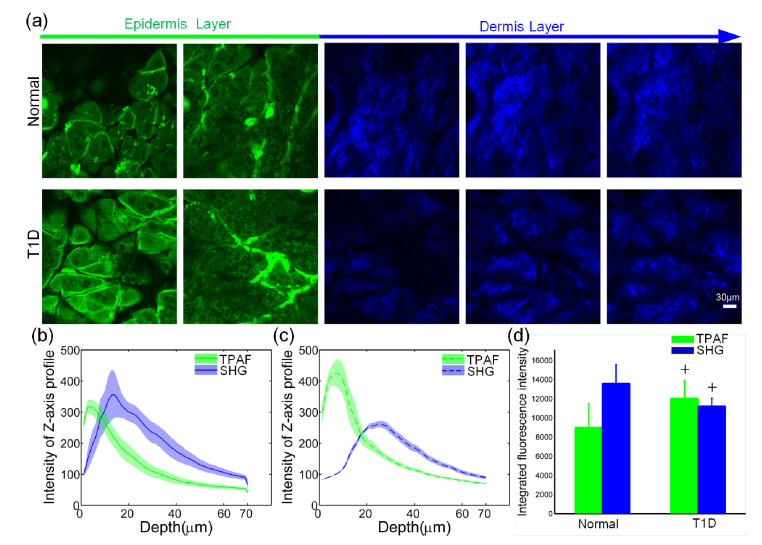
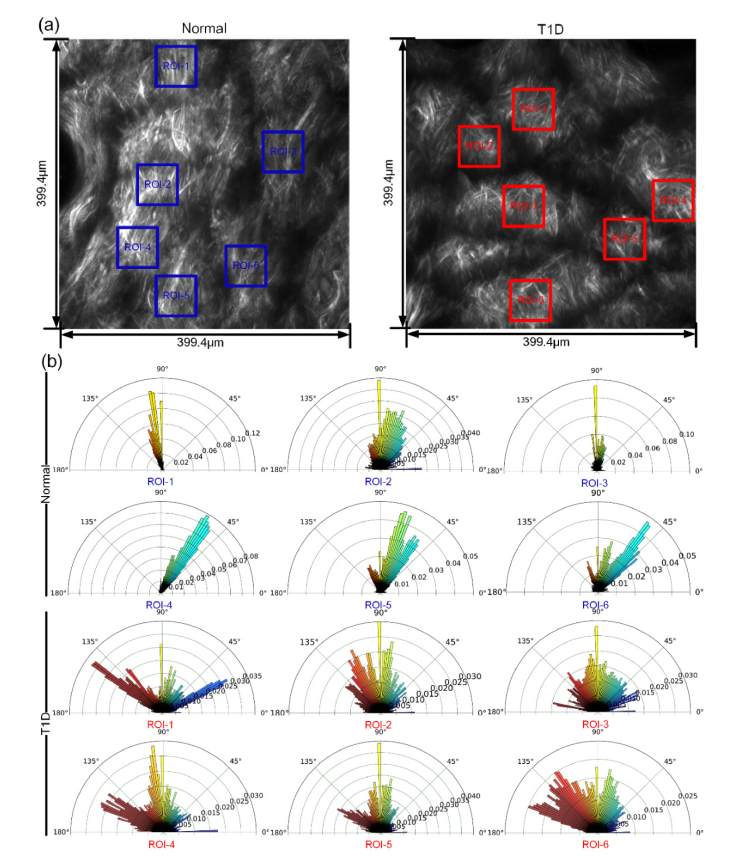
Diabetes can affect the skin structure as well as the cutaneous vascular permeability. However, effective methods to quantitatively evaluate diabetes-induced skin disorders in vivo are still lacking. Here, we visualized the skin by using in vivo two-photon imaging and quantitatively evaluated the collagen morphology. The results indicated that diabetes could cause a significant reduction in the number of collagen fibers and lead to the disorder of skin collage fibers. And, the classic histological analysis also showed diabetes did lead to the change of skin filamentous structure. Additionally, the Evans Blue dye was used as an indicator to evaluate vascular permeability. We in vivo monitored cutaneous microvascular permeability by combining spectral imaging with the skin optical clearing method. This work is very useful for quantitative evaluation of skin disorders based on in vivo optical imaging, which has a great reference value in the clinical diagnosis.
Conflict of interest statement
The authors declare that there are no conflicts of interest related to this article.
Figures


Similar articles
-
In vivo monitoring blood-brain barrier permeability using spectral imaging through optical clearing skull window.J Biophotonics. 2019 Apr;12(4):e201800330. doi: 10.1002/jbio.201800330. Epub 2018 Dec 20. J Biophotonics. 2019. PMID: 30485699
-
Assessment of tissue-specific changes in structure and function induced by in vivo skin/skull optical clearing techniques.Lasers Surg Med. 2022 Mar;54(3):447-458. doi: 10.1002/lsm.23489. Epub 2021 Nov 9. Lasers Surg Med. 2022. PMID: 34750826
-
A useful way to develop effective in vivo skin optical clearing agents.J Biophotonics. 2017 Jun;10(6-7):887-895. doi: 10.1002/jbio.201600221. Epub 2016 Dec 23. J Biophotonics. 2017. PMID: 28009130
-
Ex vivo optical measurements of glucose diffusion kinetics in native and diabetic mouse skin.J Biophotonics. 2015 Apr;8(4):332-46. doi: 10.1002/jbio.201400138. Epub 2015 Mar 11. J Biophotonics. 2015. PMID: 25760425
-
Advances in microcirculation network evaluation: an update.Int J Microcirc Clin Exp. 1995;15 Suppl 1:34-40. doi: 10.1159/000179093. Int J Microcirc Clin Exp. 1995. PMID: 8748887 Review.
Cited by
-
In vivo skin optical clearing for improving imaging and light-induced therapy: a review.J Biomed Opt. 2023 Jun;28(6):060901. doi: 10.1117/1.JBO.28.6.060901. Epub 2023 Jun 6. J Biomed Opt. 2023. PMID: 37288448 Free PMC article. Review.
-
Nicotinamide Mononucleotide Combined With Lactobacillus fermentum TKSN041 Reduces the Photoaging Damage in Murine Skin by Activating AMPK Signaling Pathway.Front Pharmacol. 2021 Mar 25;12:643089. doi: 10.3389/fphar.2021.643089. eCollection 2021. Front Pharmacol. 2021. PMID: 33841160 Free PMC article.
-
Advances in Zebrafish for Diabetes Mellitus with Wound Model.Bioengineering (Basel). 2023 Mar 6;10(3):330. doi: 10.3390/bioengineering10030330. Bioengineering (Basel). 2023. PMID: 36978721 Free PMC article. Review.
References
-
- Gkogkolou P., Böhm M., “[Skin disorders in diabetes mellitus],” J. Dtsch. Dermatol. Ges. 12(10), 847–863 (2014). - PubMed
LinkOut - more resources
Full Text Sources