. 2019 May 30;10(6):3070-3091.
doi: 10.1364/BOE.10.003070. eCollection 2019 Jun 1.

In vivo multifunctional optical coherence tomography at the periphery of the lungs

Affiliations

In vivo multifunctional optical coherence tomography at the periphery of the lungs

Fabio Feroldi et al. Biomed Opt Express. .

Abstract

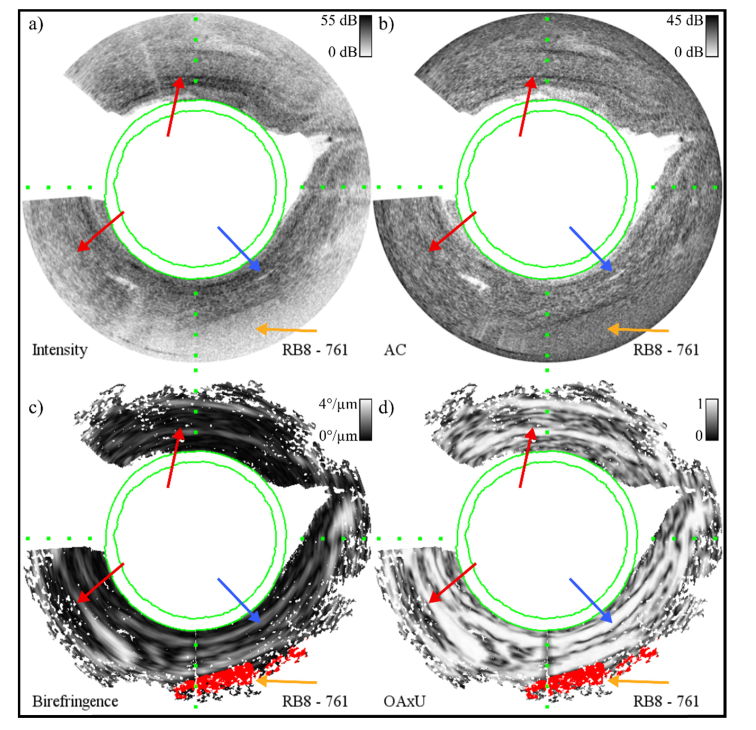
Remodeling of tissue, such as airway smooth muscle (ASM) and extracellular matrix, is considered a key feature of airways disease. No clinically accepted diagnostic method is currently available to assess airway remodeling or the effect of treatment modalities such as bronchial thermoplasty in asthma, other than invasive airway biopsies. Optical coherence tomography (OCT) generates cross-sectional, near-histological images of airway segments and enables identification and quantification of airway wall layers based on light scattering properties only. In this study, we used a custom motorized OCT probe that combines standard and polarization sensitive OCT (PS-OCT) to visualize birefringent tissue in vivo in the airway wall of a patient with severe asthma in a minimally invasive manner. We used optic axis uniformity (OAxU) to highlight the presence of uniformly arranged fiber-like tissue, helping visualizing the abundance of ASM and connective tissue structures. Attenuation coefficient images of the airways are presented for the first time, showing superior architectural contrast compared to standard OCT images. A novel segmentation algorithm was developed to detect the surface of the endoscope sheath and the surface of the tissue. PS-OCT is an innovative imaging technique that holds promise to assess airway remodeling including ASM and connective tissue in a minimally invasive, real-time manner.


Conflict of interest statement

The authors declare that there are no conflicts of interest related to this article.

Figures

Fig. 1
Fig. 1
Schematics of the PS-OCT imaging system, motorized OCT catheter, and custom micromotor. a) Light from a swept source laser is sampled by a fiber Bragg grating (FBG) to provide an A-line trigger. The light is split into the two arms of a Mach-Zehnder interferometer made of a reference arm with a transmission delay line and a sample arm containing a PDU that introduces a delay between P and S polarization states. A circulator (C) redirects the light to the catheter, inserted in the lungs through the working channel of a standard bronchoscope. Light from the sample arm interferes with the reference arm light in a monolithic polarization diversity detection module (PDDM), which separates the light into orthogonal polarization components (P and S) on separate balanced detectors. PCs are polarization controllers. b) A schematic of the OCT endoscope, a Peek tubing holds the single-mode fiber glued to the GRIN lens in place. The focused light is directed to the tissue by a 48° angled prism mounted on the axle of a micromotor. The rotation of the motor creates a circumferential scan that allows reconstructing an OCT B-scan. S and N represent the magnetic poles of the magnet placed at the core of the AC motor. c) cross-section of the custom micromotor. Two electrical wires are double-wound around the housing of the motor, which contains a free-to-rotate magnet with an axle held in place by two conical bearings. d) photo of the endoscope tip. e) zoom-in of the catheter tip. The copper wire double-wound on the motor is visible.
Fig. 2
Fig. 2
Demonstration of the segmentation algorithm on OCT cross-sections shown in polar coordinates. a) Manual selection of the window for the first frame of the volume. The top boundary is chosen by visual inspection of the DOPU image of the first frame (cyan rectangle). b) The area is isolated with a binary mask, and the inner sheath surface is segmented with a graph-based shortest path algorithm. c) Segmentation of the inner sheath surface. The motor wires are detected from the integral of the DOPU image between the top edge of the image and the inner sheath surface (blue line). d) A binary mask was obtained by selecting the pixels comprised between 5 and 35 pixels below the inner sheath and applied to the intensity image. e) Segmentation of the outer sheath. f) The area above the segmented outer sheath and behind the wires is ignored and the segmentation algorithm to find the lung surface is applied. g-i) Examples of segmentation of OCT B-scans taken from different locations along the volume. The solid orange rectangle and the dashed cyan rectangle in c and f show areas associated with alveoli and submucosa, respectively.
Fig. 3
Fig. 3
Schematic of the PMD compensation algorithm. The boxes in green represent operations in the wavenumber domain, while the boxes in blue operations in depth-domain. The orange boxes represent Fast Fourier Transforms (FFT).
Fig. 4
Fig. 4
An example of histology of a human bronchus compared with cross sections acquired in vivo with our OCT catheter. a) H&E staining of an airway cross section. b) Desmin staining of an airway cross section. c) OCT intensity image acquired in vivo from a bronchiole of a severe asthma patient (not the same patient from which the histological slides were obtained). d) AC image of the same cross-section. In all images, the arrows indicate the main histological features of the airway: epithelium (Ep.), basement membrane (BM), lamina propria (LP), airway smooth muscle (ASM), and cartilage (Cart.). The scale bar in the histological images is 500 µm. The distance between the dotted green markers in the OCT images is 200 µm in tissue.
Fig. 5
Fig. 5
Comparison of OCT intensity images and AC images extracted with the depth-resolved AC method. In all figures, the green circles represent the inner and outer edge of the plastic catheter sheath. The white area on the right half of the images masks the area of tissue not optically accessible due to the presence of the copper wires feeding current to the motor, obtained from the segmentation algorithm. The thin white lines are A-lines excluded due to saturation of the photodetectors. a,c) OCT intensity image of a frame along the in vivo pullback in a patient with chronic asthma. b,d) AC image of the same cross-section. The red arrows in a) indicate artifacts that are partially obscuring a piece of cartilages, corrected by the AC calculation in b). The light blue arrows in c) and d) point at areas where epithelial folds are present but only visible in the AC images. The greyscale is [0 −55] dB for the OCT intensity images in a) and c), and [10-1.8 102.7] mm−1 for the AC images in b) and d). The distance between the dotted green markers is 200 µm in tissue.
Fig. 6
Fig. 6
Example of a cross section from a distal location along the in vivo pullback in RB8. a) Intensity OCT B-scan. b) Corresponding AC image. c) Birefringence-induced local phase retardation image of the same frame. In red the DOCT signal. d) OAxU of the same frame. The black arrows indicate alveoli. The blue arrows point to a superficial birefringent layer, probably associated with the presence of ASM, which is visible in the birefringence images, and more prominently visible in the OAxU images. In all images, the orange arrows indicate a blood vessel. The green circles represent the edges of the plastic catheter sheath, as found by the segmentation algorithm. The white area on the top left side of the images masks the area of tissue not optically accessible due to the presence of the copper wires feeding current to the motor, while the thin white lines are A-lines excluded due to saturation of the photodetectors. The intensity images have a greyscale dynamic range of 55 dB, the AC images are shown on a logarithmic scale of [10-1.8 102.7] mm−1, the birefringence images are shown between [0 4.0]°/µm, the greyscale range of OAxU images is [0 1], while the DOCT signal is shown as a binary image above a threshold of 0.63 rad. The distance between the dotted green markers is 200 µm in tissue.
Fig. 7
Fig. 7
Example of a cross section from a proximal location along the in vivo pullback in RB8. a) Intensity OCT B-scan. b) Corresponding AC image. c) Birefringence-induced phase retardation image of the same frame. In red the DOCT signal. d) OAxU of the same frame. The red arrows point at two large pieces of cartilage, with their perichondrium appearing as a ring-like structure. The blue arrows point to a birefringent layer, probably associated with the presence of ASM, which is visible in the birefringence images, and more prominently visible in the OAxU images. In all images, the orange arrows indicate blood vessels, while the green circles represent the edges of the plastic catheter sheath, as found by the segmentation algorithm. The white area on the top left side of the images masks the area of tissue not optically accessible due to the presence of the copper wires feeding current to the motor. The intensity images have a greyscale dynamic range of 55 dB, the AC images are shown on a logarithmic scale of [10-1.8 102.7] mm−1, the birefringence images are shown between [0 4.0]°/µm, the greyscale range of OAxU images is [0 1], while the DOCT signal is shown as a binary image above a threshold of 0.63 rad. The distance between the dotted green markers is 200 µm in tissue.
Fig. 8
Fig. 8
Example of a cross section from a distal location along the in vivo pullback in RB9. a) Intensity OCT B-scan. b) Corresponding AC image. c) Birefringence-induced phase retardation image of the same frame. In red the DOCT signal. d) OAxU of the same frame. The solid red arrows point at a piece of cartilage. The blue arrows indicate ASM, while the dashed green arrows a superficial birefringent structure of unknown origin. In this frame, no blood flow was detected by our phase-resolved algorithm. In all images, the green circles represent the edges of the plastic catheter sheath, as found by the segmentation algorithm. The white area on the right side of the images masks the area of tissue not optically accessible due to the presence of the copper wires feeding current to the motor. The intensity images have a greyscale dynamic range of 55 dB, the AC images are shown on a logarithmic scale of [10-1.8 102.7] mm−1, the birefringence images are shown between [0 4]°/µm, the greyscale of OAxU images is [0 1], while the DOCT signal is shown as a binary image above a threshold of 0.63 rad. The distance between the dotted green markers is 200 µm in tissue.
Fig. 9
Fig. 9
Example of a cross section from a proximal location along the in vivo pullback in RB9. a) Intensity OCT B-scan. b) Corresponding AC image. c) Birefringence-induced phase retardation image of the same frame. In red the DOCT signal. d) OAxU of the same frame. The red arrows indicate two pieces of cartilage, while the blue arrows ASM. The dashed green lines highlight the presence of a shallow birefringent layer of uncertain origin. A blood vessel is visible in the top left quadrant of the image. In all images, the green circles represent the edges of the plastic catheter sheath, as found by the segmentation algorithm. The white area on the right side of the images masks the area of tissue not optically accessible due to the presence of the copper wires feeding current to the motor. The intensity images have a greyscale dynamic range of 55 dB, the AC images are shown on a logarithmic scale of [10-1.8 102.7] mm−1, the birefringence images are shown between [0 4]°/µm, the greyscale of OAxU images is [0 1], while the DOCT signal is shown as a binary image above a threshold of 0.63 rad. The distance between the dotted green markers is 200 µm in tissue.

References

    1. Swanson E. A., Fujimoto J. G., “The ecosystem that powered the translation of OCT from fundamental research to clinical and commercial impact [Invited],” Biomed. Opt. Express 8(3), 1638–1664 (2017).10.1364/BOE.8.001638 - DOI - PMC - PubMed
    1. Tsuboi M., Hayashi A., Ikeda N., Honda H., Kato Y., Ichinose S., Kato H., “Optical coherence tomography in the diagnosis of bronchial lesions,” Lung Cancer 49(3), 387–394 (2005).10.1016/j.lungcan.2005.04.007 - DOI - PubMed
    1. Lam S., Standish B., Baldwin C., McWilliams A., leRiche J., Gazdar A., Vitkin A. I., Yang V., Ikeda N., MacAulay C., “In vivo optical coherence tomography imaging of preinvasive bronchial lesions,” Clin. Cancer Res. 14(7), 2006–2011 (2008).10.1158/1078-0432.CCR-07-4418 - DOI - PMC - PubMed
    1. Michel R. G., Kinasewitz G. T., Fung K.-M., Keddissi J. I., “Optical Coherence Tomography as an Adjunct to Flexible Bronchoscopy in the Diagnosis of Lung Cancer,” Chest 138(4), 984–988 (2010).10.1378/chest.10-0753 - DOI - PubMed
    1. Hariri L. P., Mino-Kenudson M., Lanuti M., Miller A. J., Mark E. J., Suter M. J., “Diagnosing Lung Carcinomas with Optical Coherence Tomography,” Ann. Am. Thorac. Soc. 12(2), 193–201 (2015).10.1513/AnnalsATS.201408-370OC - DOI - PMC - PubMed

LinkOut - more resources