

Reproducibility of Measurements of Retinal Structural Parameters Using Optical Coherence Tomography in Stargardt Disease
- PMID: 31259091
- PMCID: PMC6590092
- DOI: 10.1167/tvst.8.3.46
Reproducibility of Measurements of Retinal Structural Parameters Using Optical Coherence Tomography in Stargardt Disease
Abstract
Purpose: To assess the reproducibility of retinal measurements from optical coherence tomography (OCT) in ABCA4-related Stargardt disease (STGD1).
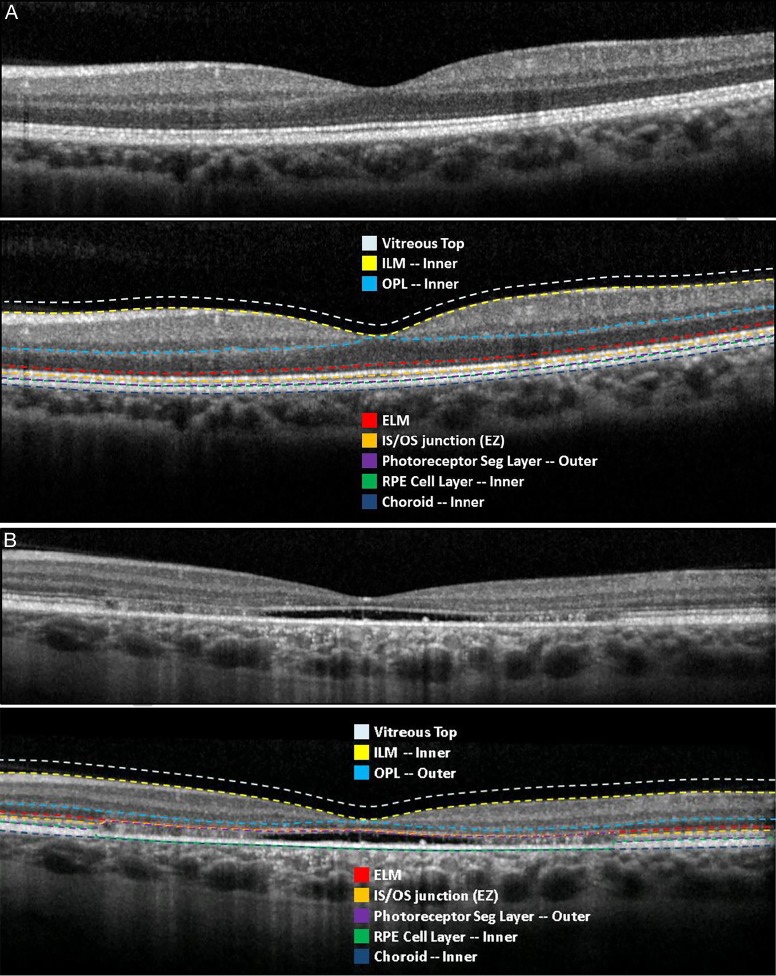
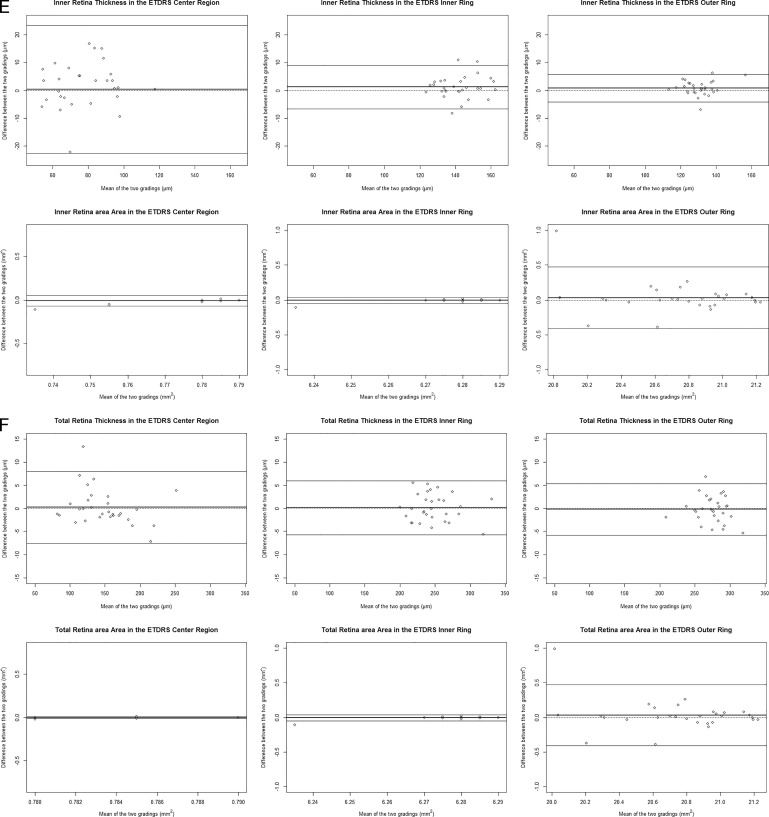
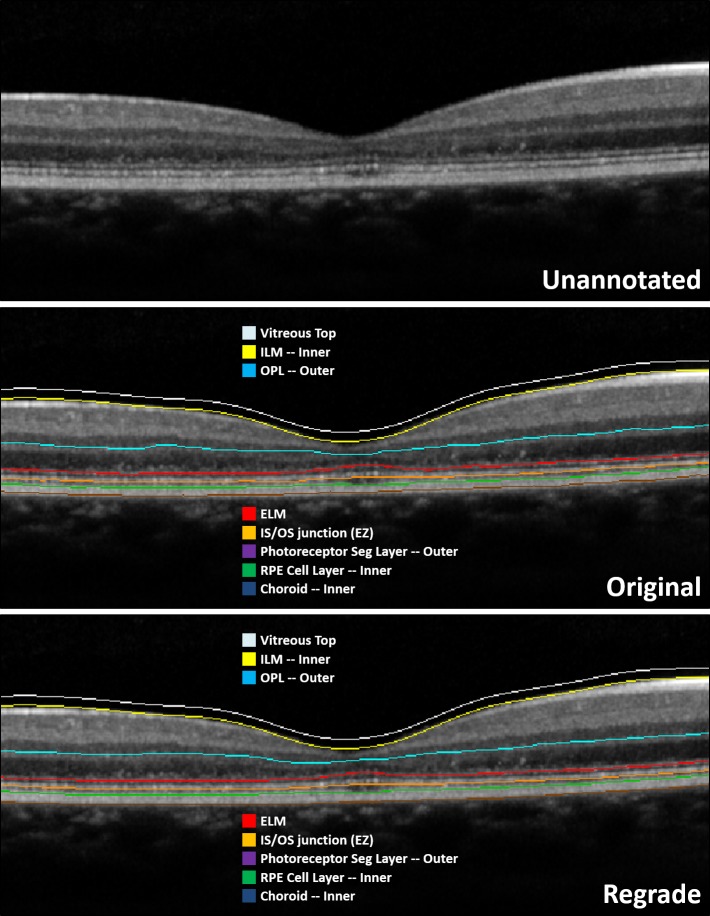
Methods: The international multicenter Progression of Atrophy Secondary to Stargardt Disease (ProgStar) Study enrolled 259 STGD1 patients. OCT images were graded by the study reading center (RC). Semiautomatic segmentation with manual adjustments was used to segment the layers of retinal pigmentation epithelium, outer segments, inner segments (ISs), outer nuclear layer (ONL), inner retina, and the total retina (TR). The images were overlaid to the Early Treatment Diabetic Retinopathy Study (ETDRS) grid. For each layer, the thickness and the intact area of the ETDRS central subfield, inner ring, and outer ring were recorded, respectively. A different set of RC graders regraded 30 independent ProgStar images to evaluate measurement reproducibility. Reproducibility was assessed graphically and using statistics including intraclass correlation (ICC) and relative absolute difference (RAD).
Results: Across all layers, measurements of the ETDRS central subfield had low ICC and/or large RAD. The outer-ring region was not fully captured in some images. For inner ring, good reproducibility was observed for intact area in the IS (ICC = 0.99, RAD = 4%), thicknesses of the ONL (ICC = 0.93, RAD = 6%), and TR (ICC = 0.99, RAD = 1%).
Conclusions: STGD1's complex morphology made outer retina segmentation challenging. Measurements of the inner ring, including the intact area of IS (i.e., the ellipsoid zone [EZ]) and ONL and TR thicknesses, had good reproducibility and showed anatomical impairment.
Translational relevance: ONL and TR thicknesses and the EZ intact area in the ETDRS inner ring hold potential as structural endpoints for STGD1 trials. Structure-function relationships need to be further established.
Keywords: inherited retinal degeneration; outcome measures; reliability; repeatability; structure parameters.
Figures


Similar articles
-
The Progression of Stargardt Disease as Determined by Spectral-Domain Optical Coherence Tomography over a 24-Month Period (ProgStar Report No. 18).Ophthalmic Res. 2024;67(1):435-447. doi: 10.1159/000540028. Epub 2024 Jul 18. Ophthalmic Res. 2024. PMID: 39004077
-
Progression of PROM1-Associated Retinal Degeneration as Determined by Spectral-Domain Optical Coherence Tomography Over a 24-Month Period.Am J Ophthalmol. 2024 Mar;259:109-116. doi: 10.1016/j.ajo.2023.11.010. Epub 2023 Nov 17. Am J Ophthalmol. 2024. PMID: 37979600
-
Analysis of retinal sublayer thicknesses and rates of change in ABCA4-associated Stargardt disease.Sci Rep. 2020 Oct 6;10(1):16576. doi: 10.1038/s41598-020-73645-5. Sci Rep. 2020. PMID: 33024232 Free PMC article.
-
Comparison of point estimates and average thicknesses of retinal layers measured using manual optical coherence tomography segmentation for quantification of retinal neurodegeneration in multiple sclerosis.Curr Eye Res. 2013 Jan;38(1):224-8. doi: 10.3109/02713683.2012.722243. Epub 2012 Sep 6. Curr Eye Res. 2013. PMID: 22954302 Free PMC article.
-
Assessment of inner and outer retinal layer metrics on the Cirrus HD-OCT Platform in normal eyes.PLoS One. 2018 Oct 4;13(10):e0203324. doi: 10.1371/journal.pone.0203324. eCollection 2018. PLoS One. 2018. PMID: 30286099 Free PMC article.
Cited by
-
Structural evaluation in inherited retinal diseases.Br J Ophthalmol. 2021 Dec;105(12):1623-1631. doi: 10.1136/bjophthalmol-2021-319228. Epub 2021 May 12. Br J Ophthalmol. 2021. PMID: 33980508 Free PMC article. Review.
-
The role of multimodal imaging and vision function testing in ABCA4-related retinopathies and their relevance to future therapeutic interventions.Ther Adv Ophthalmol. 2021 Dec 19;13:25158414211056384. doi: 10.1177/25158414211056384. eCollection 2021 Jan-Dec. Ther Adv Ophthalmol. 2021. PMID: 34988368 Free PMC article. Review.
-
Clinical spectrum, genetic complexity and therapeutic approaches for retinal disease caused by ABCA4 mutations.Prog Retin Eye Res. 2020 Nov;79:100861. doi: 10.1016/j.preteyeres.2020.100861. Epub 2020 Apr 9. Prog Retin Eye Res. 2020. PMID: 32278709 Free PMC article. Review.
-
Photoreceptor Disease at Ambiguous Transition Zones in Inherited Retinal Degenerations.Transl Vis Sci Technol. 2025 Aug 1;14(8):11. doi: 10.1167/tvst.14.8.11. Transl Vis Sci Technol. 2025. PMID: 40762536 Free PMC article.
-
Censoring the Floor Effect in Long-Term Stargardt Disease Microperimetry Data Produces a Faster Rate of Decline.Ophthalmol Sci. 2024 Jul 20;4(6):100581. doi: 10.1016/j.xops.2024.100581. eCollection 2024 Nov-Dec. Ophthalmol Sci. 2024. PMID: 39280350 Free PMC article.
References
-
- Schwartz SD, Regillo CD, Lam BL, et al. Human embryonic stem cell-derived retinal pigment epithelium in patients with age-related macular degeneration and Stargardt's macular dystrophy: follow-up of two open-label phase 1/2 studies. Lancet. 2015;385:509–516. - PubMed
-
- Scholl HP, Strauss RW, Singh MS, et al. Emerging therapies for inherited retinal degeneration. Sci Transl Med. 2016;8:368rv6. - PubMed
LinkOut - more resources
Full Text Sources
