. 2019 Jun 14;2(3):198-209.
doi: 10.1021/acsptsci.9b00017. Epub 2019 May 15.

mGlu5 Positive Allosteric Modulators Facilitate Long-Term Potentiation via Disinhibition Mediated by mGlu5-Endocannabinoid Signaling

Affiliations

mGlu5 Positive Allosteric Modulators Facilitate Long-Term Potentiation via Disinhibition Mediated by mGlu5-Endocannabinoid Signaling

Zixiu Xiang et al. ACS Pharmacol Transl Sci. .

Abstract

Metabotropic glutamate (mGlu) receptor type 5 (mGlu5) positive allosteric modulators (PAMs) enhance hippocampal long-term potentiation (LTP) and have cognition-enhancing effects in animal models. These effects were initially thought to be mediated by potentiation of mGlu5 modulation of N-methyl-d-aspartate receptor (NMDAR) currents. However, a biased mGlu5 PAM that potentiates Gαq-dependent mGlu5 signaling, but not mGlu5 modulation of NMDAR currents, retains cognition-enhancing effects in animal models, suggesting that potentiation of NMDAR currents is not required for these in vivo effects of mGlu5 PAMs. However, it is not clear whether the potentiation of NMDAR currents is critical for the ability of mGlu5 PAMs to enhance hippocampal LTP. We now report the characterization of effects of two structurally distinct mGlu5 PAMs, VU-29 and VU0092273, on NMDAR currents and hippocampal LTP. As with other mGlu5 PAMs that do not display observable bias for potentiation of NMDAR currents, VU0092273 enhanced both mGlu5 modulation of NMDAR currents and induction of LTP at the hippocampal Schaffer collateral (SC)-CA1 synapse. In contrast, VU-29 did not potentiate mGlu5 modulation of NMDAR currents but induced robust potentiation of hippocampal LTP. Interestingly, both VU-29 and VU0092273 suppressed evoked inhibitory postsynaptic currents (eIPSCs) in CA1 pyramidal cells, and this effect was blocked by the cannabinoid receptor type 1 (CB1) antagonist AM251. Furthermore, AM251 blocked the ability of both mGlu5 PAMs to enhance LTP. Finally, both PAMs failed to enhance LTP in mice with the restricted genetic deletion of mGlu5 in CA1 pyramidal cells. Taken together with previous findings, these results suggest that enhancement of LTP by mGlu5 PAMs does not depend on mGlu5 modulation of NMDAR currents but is mediated by a previously established mechanism in which mGlu5 in CA1 pyramidal cells induces endocannabinoid release and CB1-dependent disinhibition.


Conflict of interest statement

The authors declare no competing financial interest.

Figures

Figure 1
Figure 1
Differential effects of VU-29 and VU0092273 on mGlu5-mediated modulation of NMDAR currents in hippocampal CA1 pyramidal cells. (A,B) DHPG induces a concentration-dependent increase in NMDAR currents. Top: representative traces of NMDA-evoked currents in hippocampal CA1 pyramidal cells. Bottom: time courses of normalized NMDAR current amplitude before, during, and after application of DHPG (A. 3 μM and B. 50 μM, respectively). (C,D) Top: representative traces of NMDA-evoked currents. Bottom: time courses of normalized NMDAR current amplitude in baseline, during applications of an mGlu5 PAM followed by a combination of the mGlu5 PAM and DHPG (3 μM), and washout of the compounds. VU-29 (0.5 μM), a highly selective mGlu5 PAM, does not potentiate NMDAR currents (C), whereas the mGlu5 PAM VU0092273 (VU273, 1 μM) potentiates the effect of DHPG on NMDAR currents (D). (E) Bar graph summarizing the effects of DHPG, mGlu5 PAMs alone and mGlu5 PAMs in the presence of 3 μM DHPG on NMDAR currents (one-way ANOVA, F(5, 39) = 6.15, p < 0.0005, with Dunnett’s post-test, **p < 0.01; *p < 0.05; n = 6–7). Calibration for sample traces: (A) 50 pA/3 s; (B) 30 pA/4 s; (C) 40 pA/4 s; (D) 50 pA/3 s.
Figure 2
Figure 2
mGlu5 PAMs VU-29 and VU0092273 enhance LTP induction at SC-CA1 synapses in rats. (A) Time courses of normalized fEPSP slope before and after threshold theta burst stimulation (TBS) (open symbols), threshold TBS in the presence of 0.1 μM VU-29 (gray symbols), and threshold TBS in the presence of 1 μM VU0092273 (VU273, black symbols). Horizontal gray and black lines indicate the duration of bath application of VU-29 and VU273, respectively. Arrow indicates the time at which threshold TBS was applied. Averaged sample traces on top: black, baseline; gray, 45 min after threshold TBS. Calibration for all sample traces: 0.4 mV/5 ms. (B) Bar graph summarizing the normalized fEPSP slope measured 45 min after TBS. Bath application of VU-29 or VU0092273, followed by threshold TBS, resulted in significantly greater LTP compared to that with threshold TBS alone (one-way ANOVA, F(2, 34) = 9.005, p < 0.001, with Dunnett’s post-test, **p < 0.01; n = 11–13).
Figure 3
Figure 3
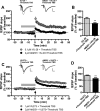
mGlu5 PAMs VU-29 and VU0092273 inhibit evoked IPSCs (eIPSCs) in CA1 pyramidal cells via activation of CB1 receptors. (A,B) Bath application of VU-29 (0.1 μM, A) or VU0092273 (1 μM, B) inhibits IPSCs in CA1 pyramidal cells evoked by a stimulating electrode placed in the stratum radiatum of the CA1 region. Left panels in A,B, time courses of normalized eIPSC amplitude during baseline and application of VU-29 (A) and VU0092273 (B). Right panels in panels A and B: bar graphs summarizing the effects of VU-29 (A) and VU0092273 (B) (*p < 0.05, Wilcoxon matched pairs signed rank test, n = 6–7). (C,D) In the presence of the CB1R antagonist AM251 (2 μM), VU-29 (0.1 μM, C) or VU0092273 (1 μM, D) failed to inhibit evoked IPSCs in CA1 pyramidal cells. Left panels in C and D: time courses of normalized eIPSC amplitude during baseline and application of VU-29 with AM251 (C) and VU0092273 with AM251 (D). Right panels in parts C and D: bar graphs summarizing the effects of VU-29 (C) and VU0092273 (D) on eIPSC amplitude in the presence of AM251 (p > 0.5, Wilcoxon matched pairs signed rank test, n = 6–7). Averaged sample traces: black, baseline; gray, during application of compound(s). Calibration for sample traces: (A and B) 50 pA/50 ms; (C) 100 pA/50 ms; (D) 100 pA/40 ms.
Figure 4
Figure 4
Involvement of CB1R signaling in mGlu5 PAM-induced enhancement of LTP at SC-CA1 synapses. (A) VU-29 (0.1 μM) enhances LTP induced by threshold TBS (gray symbols), but fails to enhance LTP when coapplied with CB1R antagonist AM251 (2 μM, black symbols). (B) Bar graph summarizing the effects of VU-29 alone and VU-29 coapplied with AM251 on threshold TBS-induced LTP measured at 45 min after threshold TBS (**p < 0.01, Mann–Whitney test, n = 6–11). (C) VU0092273 (VU273, 1 μM) enhances LTP induced by threshold TBS (gray symbols), but fails to enhance LTP when coapplied with CB1R antagonist AM251 (2 μM, black symbols). (D) Bar graph summarizing the effects of VU0092273 alone and VU0092273 coapplied with AM251 on threshold TBS-induced LTP measured at 45 min after threshold TBS (**p < 0.01, Mann–Whitney test, n = 8–13). Averaged sample traces: black, baseline; gray, 45 min after threshold TBS. Calibration bars for all sample traces: 0.3 mV/5 ms.
Figure 5
Figure 5
VU-29 and VU0092273 enhance LTP induction at SC-CA1 synapses in mice. (A) Time courses of normalized fEPSP slope before and after threshold TBS (open symbols), or threshold TBS in the presence of 0.1 μM VU-29 (gray symbols) and threshold TBS in the presence of 0.1 μM VU0092273 (VU273, black symbols). Horizontal lines indicate the duration of the bath application of VU-29 (gray) and VU0092273 (black), respectively. Arrow indicates the time at which threshold TBS was applied. (Insets on top) Average sample traces in different conditions as indicated: black traces, baseline; gray traces, 50 min after threshold TBS. Calibration bars for all sample traces, 0.4 mV/5 ms. (B) Bar graph summarizing the normalized fEPSP slope measured 50 min after threshold TBS. Threshold TBS in the presence of VU-29 or VU0092273 resulted in a significantly greater increase in fEPSP slope measured 50 min after the stimulation, compared to that after threshold TBS alone (one-way ANOVA, F(2,25) = 7.461, p < 0.005, with Dunnett’s post-test, *p < 0.05, **p < 0.005).
Figure 6
Figure 6
VU-29 and VU0092273 are not able to enhance LTP at SC-CA1 synapses in mice with restricted deletion of mGlu5 in CA1 pyramidal cells. (A) Time courses of normalized fEPSP slope before and after threshold TBS alone (open symbols), or threshold TBS in the presence of 0.1 μM VU-29 (gray symbols) and threshold TBS in the presence of 0.1 μM VU0092273 (black symbols). Horizontal lines indicate the duration of the bath application of VU-29 (gray) and VU0092273 (black), respectively. Arrow indicates the time at which threshold TBS was applied. (Insets on top) Average sample traces in different condition as indicated: llack traces, baseline; gray traces, 50 min after threshold TBS. Calibration bars for sample traces: 0.2 mV/5 ms (left), 0.3 mV/5 ms (middle), 0.3 mV/6 ms (right). (B) Bar graph summarizing the normalized fEPSP slope measured 50 min after threshold TBS. Bath application of VU-29 or VU0092273 had no significant effect on threshold TBS-induced LTP measured 50 min after the stimulation, compared to that after threshold TBS alone (one-way ANOVA, F(2,17) = 0.0085, p > 0.05).
Figure 7
Figure 7
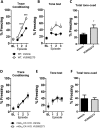
mGlu5 PAM VU0092273 enhances trace fear conditioning in WT mice but not in mGlu5-CA1-KO mice. Mice were trained with 3 CS (tone)-US (footshock) pairings in context A. Intertrial intervals (ITIs) were 240 s. CS and US were separated by a 30 s trace period. The amount of freezing to the 30 s trace is quantified for each pairing episode. (A) Trace fear conditioning of vehicle (black circles) and VU0092273 (gray circles; 10 mg/kg, i.p., 30 min prior to conditioning) treated WT mice (two-way repeated measures ANOVA, F(3,54) = 10.33, p < 0.05). (B) Tone test performed on subsequent day in context B. Animals were returned to a new context and were presented with three tones of 30 at 240 s intervals. Each point represents the total freezing during each of the 30 s tone presentations. (C) Quantification of total freezing during three successive tones (students t test, t(18) = 2.2, p < 0.05). (D–F) Trace fear conditioning of vehicle (black squares) and VU0092273 (gray squares) treated mGlu5-CA1-KO mice. No significant differences in acquisition or tone were observed in trace fear conditioning or tone test in mGlu5-CA1-KO mice (two-way repeated measures ANOVA, F(2,39) = 0.082, p > 0.05).

Similar articles

Cited by

References

    1. Romano C.; Sesma M. A.; McDonald C. T.; O’Malley K.; Van den Pol A. N.; Olney J. W. (1995) Distribution of metabotropic glutamate receptor mGluR5 immunoreactivity in rat brain. J. Comp. Neurol. 355, 455–469. 10.1002/cne.903550310. - DOI - PubMed
    1. Shigemoto R.; Nomura S.; Ohishi H.; Sugihara H.; Nakanishi S.; Mizuno N. (1993) Immunohistochemical localization of a metabotropic glutamate receptor, mGluR5, in the rat brain. Neurosci. Lett. 163, 53–57. 10.1016/0304-3940(93)90227-C. - DOI - PubMed
    1. Conn P. J.; Lindsley C. W.; Jones C. K. (2009) Activation of metabotropic glutamate receptors as a novel approach for the treatment of schizophrenia. Trends Pharmacol. Sci. 30, 25–31. 10.1016/j.tips.2008.10.006. - DOI - PMC - PubMed
    1. Vinson P. N.; Conn P. J. (2012) Metabotropic glutamate receptors as therapeutic targets for schizophrenia. Neuropharmacology 62, 1461–1472. 10.1016/j.neuropharm.2011.05.005. - DOI - PMC - PubMed
    1. Nicoletti F.; Bruno V.; Ngomba R. T.; Gradini R.; Battaglia G. (2015) Metabotropic glutamate receptors as drug targets: what’s new?. Curr. Opin. Pharmacol. 20, 89–94. 10.1016/j.coph.2014.12.002. - DOI - PubMed

LinkOut - more resources