. 2019 Aug 6;58(31):3365-3376.
doi: 10.1021/acs.biochem.9b00237. Epub 2019 Jul 22.

Revisiting Trade-offs between Rubisco Kinetic Parameters

Affiliations

Revisiting Trade-offs between Rubisco Kinetic Parameters

Avi I Flamholz et al. Biochemistry. .

Abstract

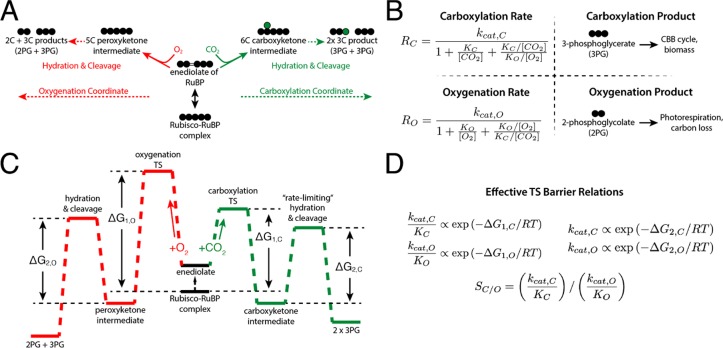
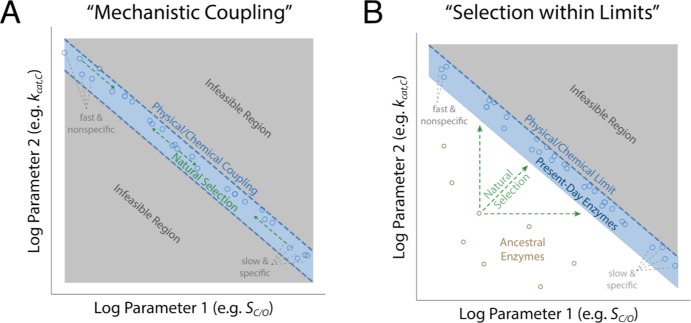
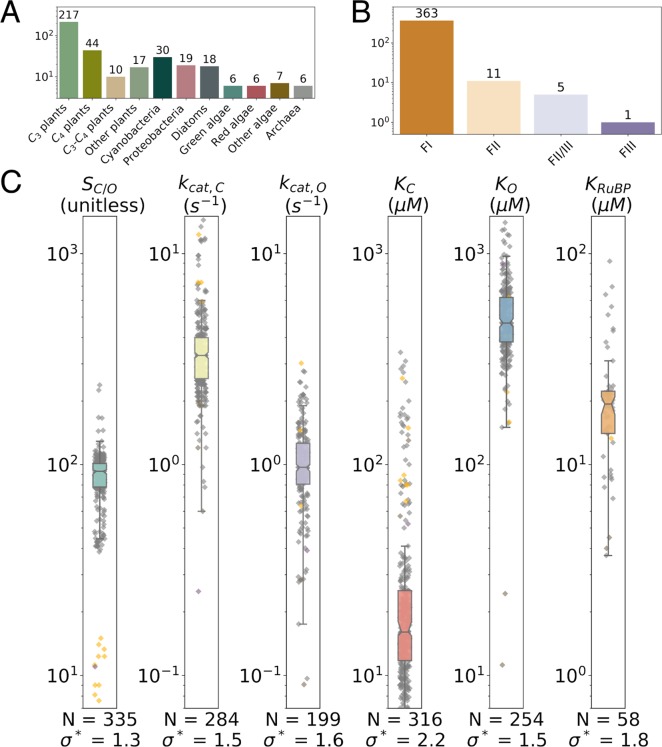
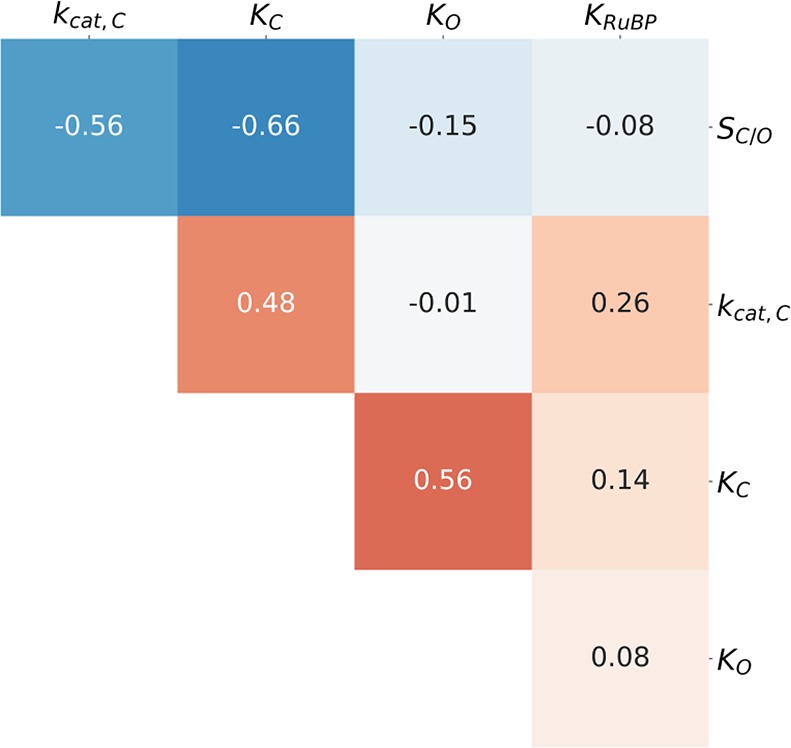
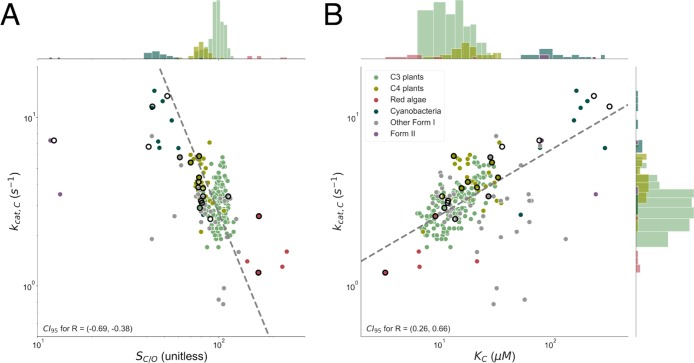
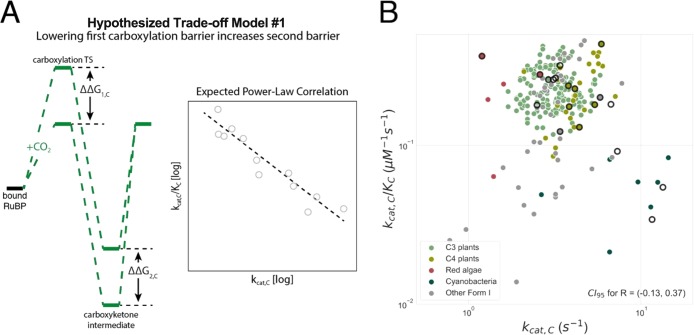
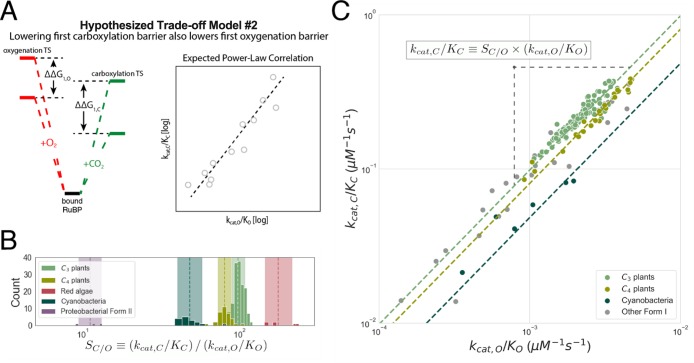
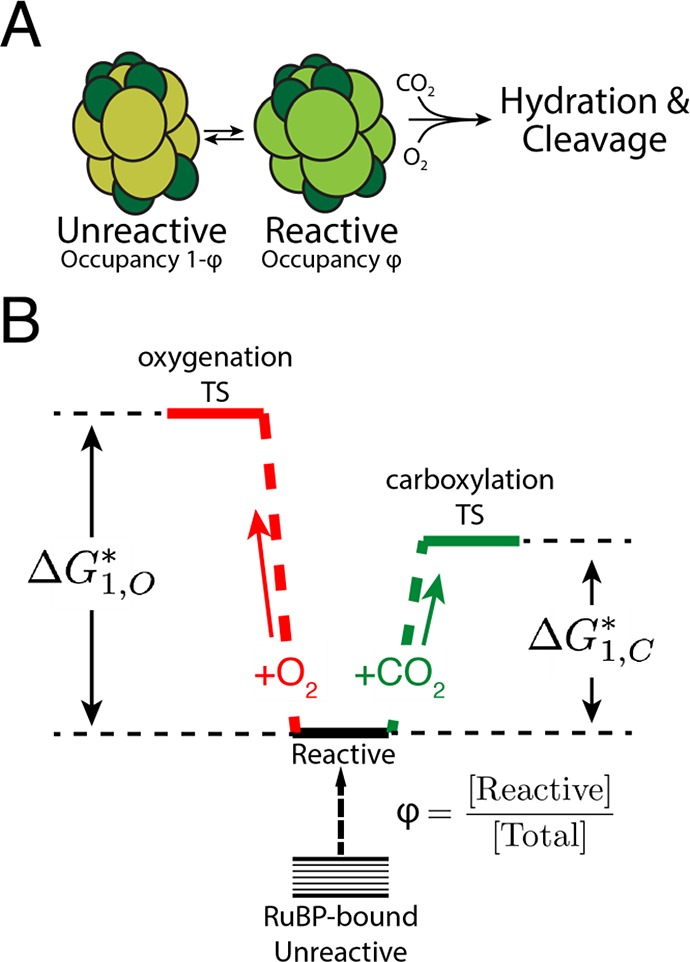
Rubisco is the primary carboxylase of the Calvin cycle, the most abundant enzyme in the biosphere, and one of the best-characterized enzymes. On the basis of correlations between Rubisco kinetic parameters, it is widely posited that constraints embedded in the catalytic mechanism enforce trade-offs between CO2 specificity, SC/O, and maximum carboxylation rate, kcat,C. However, the reasoning that established this view was based on data from ≈20 organisms. Here, we re-examine models of trade-offs in Rubisco catalysis using a data set from ≈300 organisms. Correlations between kinetic parameters are substantially attenuated in this larger data set, with the inverse relationship between kcat,C and SC/O being a key example. Nonetheless, measured kinetic parameters display extremely limited variation, consistent with a view of Rubisco as a highly constrained enzyme. More than 95% of kcat,C values are between 1 and 10 s-1, and no measured kcat,C exceeds 15 s-1. Similarly, SC/O varies by only 30% among Form I Rubiscos and <10% among C3 plant enzymes. Limited variation in SC/O forces a strong positive correlation between the catalytic efficiencies (kcat/KM) for carboxylation and oxygenation, consistent with a model of Rubisco catalysis in which increasing the rate of addition of CO2 to the enzyme-substrate complex requires an equal increase in the O2 addition rate. Altogether, these data suggest that Rubisco evolution is tightly constrained by the physicochemical limits of CO2/O2 discrimination.


Conflict of interest statement

The authors declare no competing financial interest.

Figures

Figure 1
Figure 1
Description of the catalytic mechanism of Rubisco. The “middle-out” diagram in panel A shows the ordered mechanisms of carboxylation and oxygenation. Circles represent carbon atoms. RuBP is isomerized to an enediolate before carboxylation or oxygenation. Addition of CO2 or O2 to the enediolate of RuBP is considered irreversible as are the subsequent hydration and cleavage steps of the carboxylation and oxygenation arms. (B) Carboxylation displays effective Michaelis–Menten kinetics (maximum catalytic rate kcat,C, half-maximum CO2 concentration KM = KC) with competitive inhibition by O2 (assuming half-maximum inhibitory O2 concentration Ki = KO). Carboxylation results in net addition of one carbon to the five-carbon RuBP, producing two 3PG molecules. 3PG is part of the CBB cycle and can therefore be used to continue the cycle and produce biomass. Oxygenation also displays effective Michaelis–Menten kinetics (kcat,O, KM = KO, half-maximum inhibitory CO2 concentration KI = KC). Oxygenation of RuBP produces one 3PG and one 2PG. Rates of carboxylation (RC) and oxygenation (RO) are calculated from kinetic parameters and the CO2 and O2 concentrations. The reaction coordinate diagram in panel C describes carboxylation and oxygenation as a function of two “effective” barriers. The first effective barrier includes enolization and gas addition, while the second includes hydration and cleavage. (D) Given standard assumptions (Supporting Information), catalytic efficiencies (kcat/KM) are related to the height of the first effective barrier while kcats are related to the second. The first barrier to oxygenation is drawn higher than for carboxylation because oxygenation is typically slower than carboxylation. Net reactions of RuBP carboxylation and oxygenation are both quite thermodynamically favorable.
Figure 2
Figure 2
Scenarios that produce strong correlations between enzyme kinetic parameters. As the logs of the kinetic parameters are linearly related to energy barriers, linear energetic trade-offs should manifest as log–log correlations between kinetic parameters (power laws). Panel A describes a situation in which two kinetic parameters are inextricably linked by the enzyme mechanism, diagrammed here as negative coupling between kcat,C and SC/O as an example. These couplings take the form of “equality constraints” in which one parameter determines the other within measurement error. Correlation is expected as long as diverse enzymes are measured. In panel A, selection moves enzymes along the blue curve but cannot produce enzymes off the curve (gray) because they are not feasible. Panel B diagrams an alternative scenario in which the enzyme mechanism imposes an upper limit on two parameters (an inequality constraint). In the “selection within limits” scenario, effective selection is required for correlation to emerge because suboptimal enzymes (e.g., ancestral sequences) are feasible. In the examples plotted, different environmental CO2 and O2 concentrations should select for different combinations of rate (kcat,C) and affinity (SC/O), resulting in present-day enzymes occupying distinct regions of the plots in panels A and B.
Figure 3
Figure 3
Summary of the full extended data set. We collected measurements of Rubisco kinetic parameters from a variety of organisms (A) representing four classes of Rubisco isoforms (B). Form I enzymes from plants, cyanobacteria, and algae make up the bulk of the data (A and B). (C) Rubisco kinetic parameters display a narrow dynamic range. The box plot and gray points describe the distribution of Form I Rubiscos, while data for Form II Rubiscos are colored yellow. Colored boxes give the range of the central 50% of FI values, and the notch indicates the median. N is the number values, and σ* gives the geometric standard deviation of Form I data. σ* < 3 for all parameters, meaning a single standard deviation varies by <3-fold. All data are from wild-type Rubiscos measured at 25 °C and near pH 8. More detailed histograms are given in Figure S4.
Figure 4
Figure 4
Correlations between measured kinetic parameters are attenuated by the addition of new data. This figure gives Pearson correlations (R) between pairs of log-transformed kinetic parameters of Form I Rubiscos. When multiple measurements of the same enzyme were available, the median value was used (Materials and Methods). SC/OKC, SC/Okcat,C, and KCkcat,C correlations are of particular interest because they were highlighted in previous works, which found R values of 0.8–0.95. None of these pairs have R values exceeding 0.7 in the extended data set.
Figure 5
Figure 5
Focal correlations of previous analyses are not robust to new data. Points with black outlines are from ref (6), and dashed gray lines represent the best fit to FI Rubisco data. Histograms for kcat,C, SC/O, and KC are plotted on parallel axes. Panel A plots kcat,C against SC/O. kcat,C and SC/O correlate with an R of approximately −0.6 among FI Rubiscos as compared to ≈0.9 previously., The 95% confidence intervals are (−4.0, −2.0) for the fit exponent and (3 × 10⁴, 2 × 10⁸) for the prefactor (slope and intercept on a log–log scale, respectively), indicating that the form of kcat,CSC/O correlation is very uncertain. Notably, SC/O displays very limited variation overall and especially within physiological groupings with sufficient data. Median SC/O values are 177 for red algae (σ* = 1.2; N = 6), 98 for C3 plants (σ* = 1.1; N = 162), 80 for C4 plants (σ* = 1.1; N = 35), and 48 for cyanobacteria (σ* = 1.1; N = 16). Panel B plots kcat,C against KC. Here, the R is ≈0.5 as compared to ≈0.9 previously. This fit is more robust, with 95% confidence intervals of (0.3, 0.5) and (0.8, 1.5) for the fit exponent and prefactor, respectively.
Figure 6
Figure 6
Negative power-law correlation between kcat,C and kcat,C/KC is not supported by the extended data set. In the model diagrammed in panel A, CO2-specific Rubiscos have low barriers to enolization and CO2 addition (first effective carboxylation barrier ΔG1,C), but lowering the first effective barrier necessarily increases the second effective barrier (ΔG2,C), reducing kcat,C. In this view, stabilizing the first carboxylation TS also enhances selectivity but also slows carboxylation (Figure S2). ΔG1,C and ΔG2,C should be negatively correlated, which would manifest as negative power-law correlation between kcat,C and kcat,C/KC under certain assumptions (Supporting Information). (B) The extended data set does not evidence the expected correlation (for Form I enzymes, R = 0.02 and p = 0.8). While previous analyses gave an R of approximately −0.9, the 95% confidence interval for R now includes 0.0. Restricting our focus to particular physiologies like C3 plants does not result in the expected correlation.
Figure 7
Figure 7
Second mechanistic proposal that is remarkably well-supported by the extended data set. (A) In this proposal, mutations increasing the rate of addition of CO2 to the Rubisco–RuBP complex also increase the rate of O2 addition. In energetic terms, lowering the effective barrier to enolization and CO2 addition (ΔG1,C) lowers the first effective barrier to O2 addition (ΔG1,O), as well. Given this model, barrier heights should be positively correlated, which would manifest as a positive linear correlation on a log–log plot of kcat,C/KC against kcat,O/KO. (B) SC/O displays limited variation within physiological groups such as C3 and C4 plants for which we have substantial data. Dashed lines give the geometric mean of SC/O values. The multiplicative standard deviation, σ*, sets the width of the shaded region. (C) SC/O = (kcat,C/KC)/(kcat,O/KO), so restricted SC/O variation implies a power-law relationship (kcat,C/KC) = SC/O(kcat,O/KO). kcat,C/KC is strongly correlated with kcat,O/KO on a log–log scale (R = 0.94; p < 10–10). Fitting FI measurements gives kcat,C/KC = 119(kcat,O/KO)1.04. A 95% confidence interval for the exponent is (0.94, 1.13), which includes 1.0. The geometric mean of measured SC/O values predicts kcat,O/KO = (kcat,C/KC)/SC/O and vice versa. This simple approach accurately predicts the kcat,O/KO for FI Rubiscos (prediction R2 = 0.80), C3 plants (R2 = 0.84), C4 plants (R2 = 0.96), and cyanobacteria (R2 = 0.79). Other groups, e.g., red algae, are omitted because of insufficient data.
Figure 8
Figure 8
A power-law relationship between kcat,C/KC and kcat,O/KO can be explained by an active site that fluctuates between “reactive” and “unreactive” states. (A) In this model, CO2 and O2 react with bound RuBP only when the enzyme is in the reactive state, which has an occupancy φ. (B) φ can vary between related enzymes. In the reactive state, CO2 and O2 react with the bound RuBP with intrinsic reactivities ΔG*1,C and ΔG*1,O that do not vary between related Rubiscos. If the difference in intrinsic reactivities (ΔG*1,OΔG*1,C) is constant, we derive a power-law relationship between kcat,C/KC and kcat,O/KO with an exponent of 1.0. This relationship requires a constant SC/O (Supporting Information).

References

    1. Raven J. A. (2013) Rubisco: still the most abundant protein of Earth?. New Phytol. 198, 1–3. 10.1111/nph.12197. - DOI - PubMed
    1. Galmés J.; Kapralov M. V.; Andralojc P. J.; Conesa M. À.; Keys A. J.; Parry M. A. J.; Flexas J. (2014) Expanding knowledge of the Rubisco kinetics variability in plant species: environmental and evolutionary trends. Plant, Cell Environ. 37, 1989–2001. 10.1111/pce.12335. - DOI - PubMed
    1. Bar-On Y. M.; Phillips R.; Milo R. (2018) The biomass distribution on Earth. Proc. Natl. Acad. Sci. U. S. A. 115, 6506–6511. 10.1073/pnas.1711842115. - DOI - PMC - PubMed
    1. Bar-On Y. M.; Milo R. (2019) The global mass and average rate of rubisco. Proc. Natl. Acad. Sci. U. S. A. 116, 4738–4743. 10.1073/pnas.1816654116. - DOI - PMC - PubMed
    1. Tcherkez G. G. B.; Farquhar G. D.; Andrews T. J. (2006) Despite slow catalysis and confused substrate specificity, all ribulose bisphosphate carboxylases may be nearly perfectly optimized. Proc. Natl. Acad. Sci. U. S. A. 103, 7246–7251. 10.1073/pnas.0600605103. - DOI - PMC - PubMed

Publication types