. 2019 Jul 22;59(7):3198-3213.
doi: 10.1021/acs.jcim.9b00224. Epub 2019 Jul 1.

Physics-Based Method for Modeling Passive Membrane Permeability and Translocation Pathways of Bioactive Molecules

Affiliations

Physics-Based Method for Modeling Passive Membrane Permeability and Translocation Pathways of Bioactive Molecules

Andrei L Lomize et al. J Chem Inf Model. .

Abstract

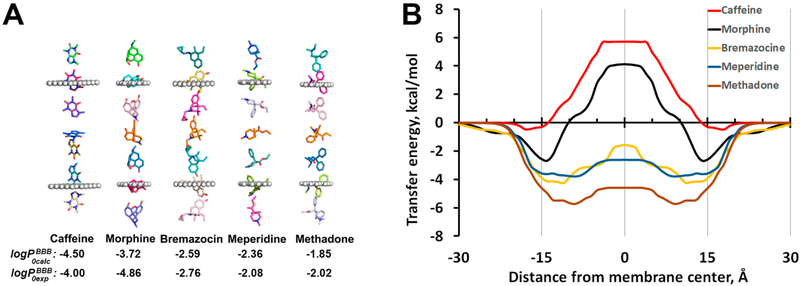
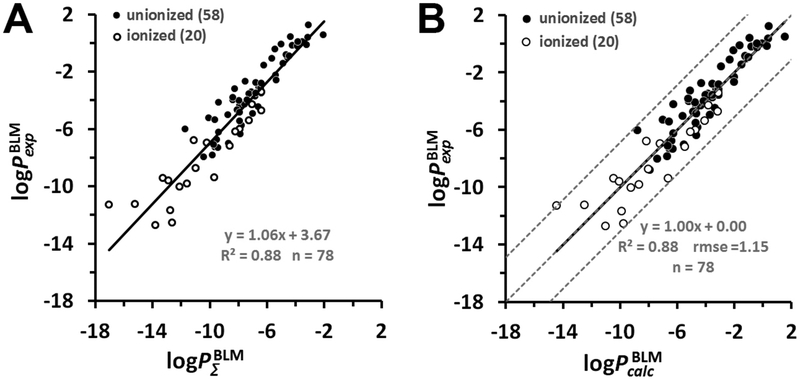
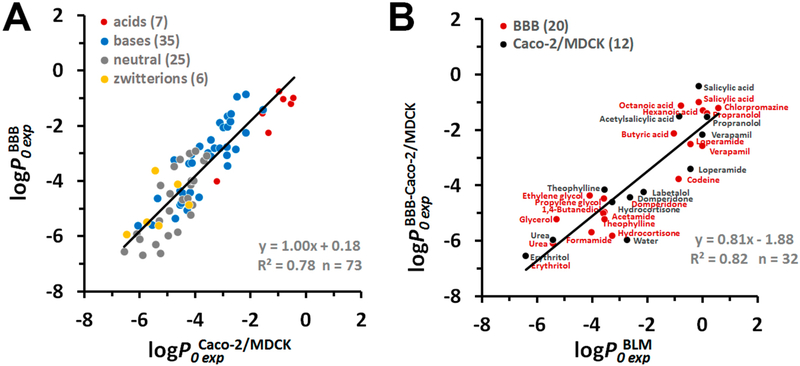
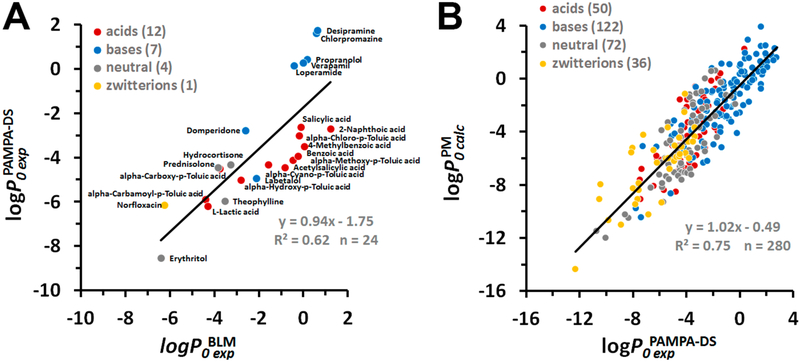
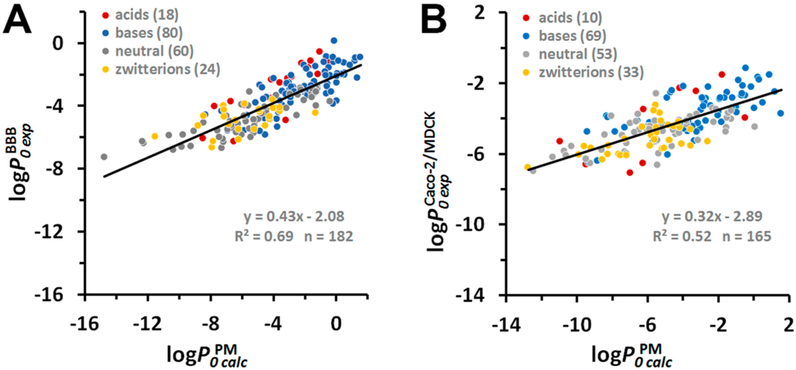
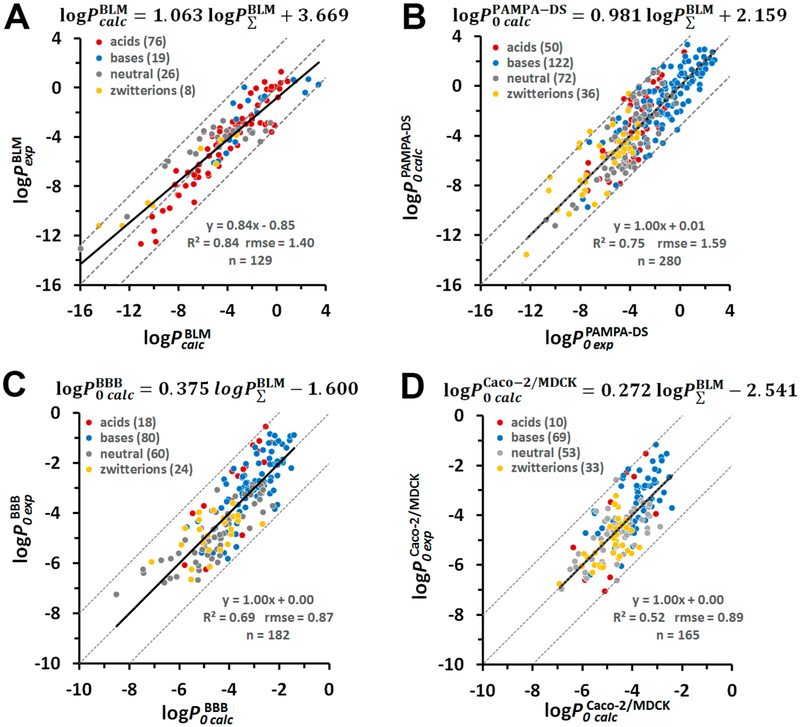
Assessment of permeability is a critical step in the drug development process for selection of drug candidates with favorable ADME properties. We have developed a novel physics-based method for fast computational modeling of passive permeation of diverse classes of molecules across lipid membranes. The method is based on heterogeneous solubility-diffusion theory and operates with all-atom 3D structures of solutes and the anisotropic solvent model of the lipid bilayer characterized by transbilayer profiles of dielectric and hydrogen bonding capacity parameters. The optimal translocation pathway of a solute is determined by moving an ensemble of representative conformations of the molecule through the dioleoyl-phosphatidylcholine (DOPC) bilayer and optimizing their rotational orientations in every point of the transmembrane trajectory. The method calculates (1) the membrane-bound state of the solute molecule; (2) free energy profile of the solute along the permeation pathway; and (3) the permeability coefficient obtained by integration over the transbilayer energy profile and assuming a constant size-dependent diffusivity along the membrane normal. The accuracy of the predictions was evaluated against experimental permeability coefficients measured in pure lipid membranes (for 78 compounds, R2 was 0.88 and rmse was 1.15 log units), PAMPA-DS (for 280 compounds, R2 was 0.75 and rmse was 1.59 log units), BBB (for 182 compounds, R2 was 0.69 and rmse was 0.87 log units), and Caco-2/MDCK assays (for 165 compounds, R2 was 0.52 and rmse was 0.89 log units).


Conflict of interest statement

The authors declare no competing financial interest.

Figures

Figure 1.
Figure 1.
Spatial positions, optimized orientations (A), and transfer energy profiles (B) calculated for several drug molecules as they move through the DOPC bilayer. Calculations of transbilayer energy profiles were performed by the publicly available PerMM web server (https://permm.phar.umich.edu/server) using the “global rotational optimization” option. The locations of hydrocarbon core boundaries between the acyl chains and head groups of lipids (at ±15 Å distances from the membrane center) are approximated by planes and shown as dummy atoms (A).
Figure 2.
Figure 2.
Prediction of the permeability of artificial lipid bilayers to organic molecules. (A) Comparison of experimental (logPexpBLM) and calculated (logPΣBLM) permeability coefficients across unilamellar lipid bilayers of 58 un-ionized (black circles) and 20 ionized in water (open circles) organic molecules. The corresponding data values are from Tables S1 and S2. (B) Plot of experimental BLM permeability coefficients (logPexpBLM) vs the calculated ones (logPcalc BLM) for 78 organic molecules. Dashed lines indicate ideal line and residual line limits (using a cutoff of |3.1| that corresponds to 2.0 rmse for ionized molecules). Predicted permeability coefficients, logPcalc BLM, in B were calculated using eq 15. The logPΣBLM values were calculated using eq 6. For ionized species, the integral logPmΣBLM accounted for the deionization penalty of ionizable groups at the specified pH. The number of molecules “n” is indicated in parentheses.
Figure 3.
Figure 3.
Comparison of experimental permeability data for natural and artificial membrane systems. (A) Correlation between intrinsic permeability coefficients obtained in situ rodent brain perfusion experiments (logP0exp BBB) vs Caco-2/MDCK assays (logP0expCaco2/MDCK). (B) Correlation between intrinsic BBB or Caco-2/MDCK permeability coefficients vs intrinsic permeability coefficients through BLM/liposomes (logP0exp BLM). Colors indicate different types of molecules: red for acids, blue for bases, gray for neutral molecules, and yellow for zwitterions. The number of molecules “n” is indicated in parentheses. Experimental BLM, BBB, and Caco-2/MDCK permeability coefficients are from Tables S7 and S8.
Figure 4.
Figure 4.
Experimental and calculated permeability data for PAMPA-DS. (A) Correlation between intrinsic permeability coefficients obtained in PAMPA-DS assays and using BLM or liposomes (logP0expBLM). Experimental PAMPA-DS and BLM data were taken from Table S9. (B) Correlation between permeability coefficients through the plasma membrane and PAMPA-DS. Intrinsic permeability coefficients of molecules through the plasma membrane (logP0calc PM) were calculated using eq 17. Experimental data for PAMPA-DS (logP0calc PAMPA-DS ) were taken from Table S5. Colors indicate different types of molecules: red for acids, blue for bases, gray for neutral molecules, and yellow for zwitterions. The number of molecules “n” is indicated in parentheses.
Figure 5.
Figure 5.
Correlation between calculated intrinsic permeability coefficients through the plasma membrane (PM) and experimental intrinsic permeability coefficients through BBB (A) and Caco-2/MDCK cells (B). Intrinsic permeability coefficients of molecules through the plasma membrane (logP0calcPM) were calculated using eq 16. Experimental data were taken from Tables S3 for BBB (logP0expBBB) and Table S4 for Caco-2/MDCK assays (logP0exp Caco2/MDCK). Colors indicate different types of molecules: red for acids, blue for bases, gray for neutral molecules, and yellow for zwitterions. The number of molecules “n” is indicated in parentheses.
Figure 6.
Figure 6.
Prediction of intrinsic permeability coefficients through different membrane systems. Plot of experimental vs calculated permeability coefficients through BLM (A), PAMPA-DS (B), BBB (C), and Caco-2/MDCK cells (D). The formula above each panel relates the calculated intrinsic log P0calc values for each systems and the integral logPΣBLM values of molecules in the neutral state determined by integration of eq 6. Dashed lines indicate the ideal line and residual line limits with cutoffs of |3.2| (A and B) and |2.0| (C and D). Colored circles indicate different charge classes of molecules: red for acids, blue for bases, gray for neutral molecules, and yellow for zwitterions. The number of molecules “n” is indicated in parentheses.

References

    1. Smith D; Artursson P; Avdeef A; Di L; Ecker GF; Faller B; Houston JB; Kansy M; Kerns EH; Kramer SD; Lennernas H; van de Waterbeemd H; Sugano K; Testa B Passive Lipoidal Diffusion and Carrier-Mediated Cell Uptake are Both Important Mechanisms of Membrane Permeation in Drug Disposition. Mol. Pharmaceutics 2014, 11, 1727–1738. - PubMed
    1. Al-Awqati Q One Hundred Years of Membrane Permeability: Does Overton Still Rule? Nat. Cell Biol 1999, 1, E201. - PubMed
    1. Missner A; Pohl P 110 Years of the Meyer-Overton Rule: Predicting Membrane Permeability of Gases and Other Small Compounds. ChemPhysChem 2009, 10, 1405–1414. - PMC - PubMed
    1. Xiang TX; Xu YH; Anderson BD The Barrier Domain for Solute Permeation Varies with Lipid Bilayer Phase Structure. J.Membr. Biol 1998, 165, 77–90. - PubMed
    1. Diamond JM; Katz Y Interpretation of Nonelectrolyte Partition Coefficients Between Dimyristoyl Lecithin and Water. J. Membr. Biol 1974, 17, 121–154. - PubMed

Publication types