. 2019 Jul 1;15(7):e1007082.
doi: 10.1371/journal.pcbi.1007082. eCollection 2019 Jul.

DART-ID increases single-cell proteome coverage

Affiliations

DART-ID increases single-cell proteome coverage

Albert Tian Chen et al. PLoS Comput Biol. .

Abstract

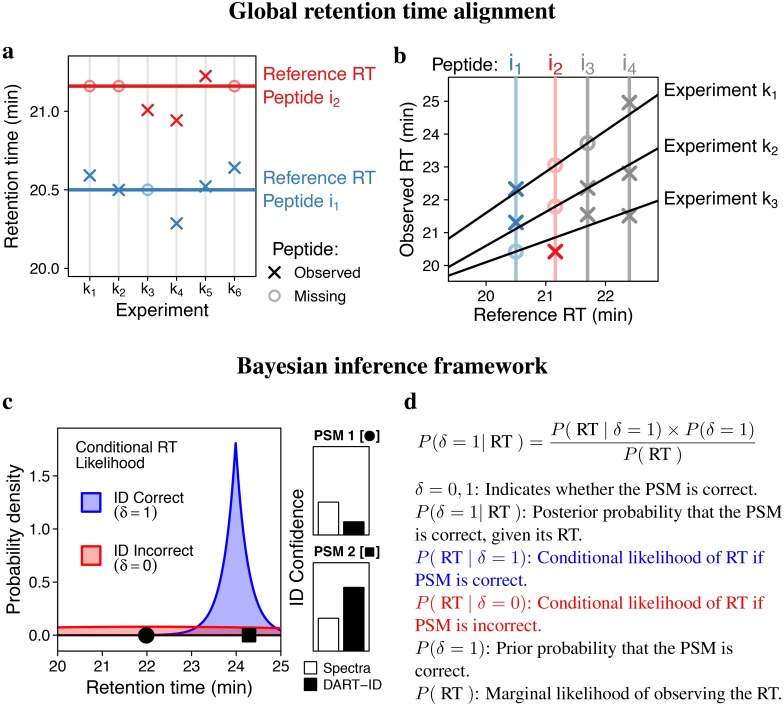
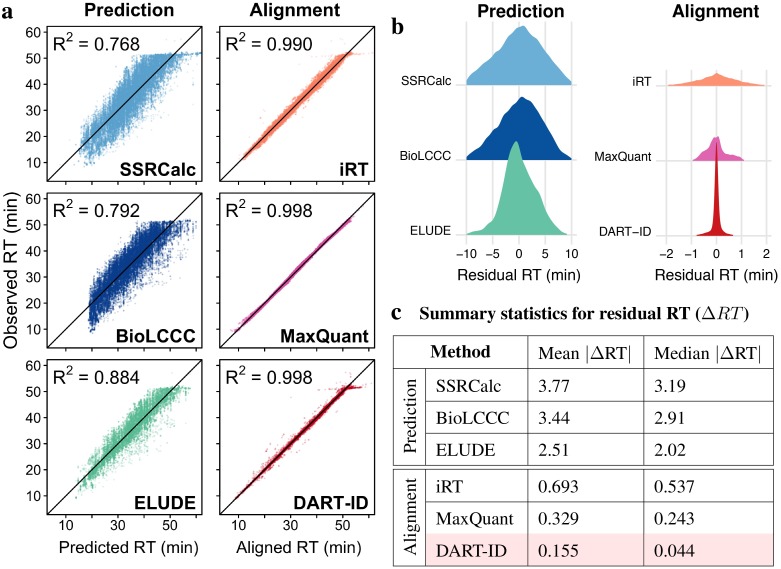
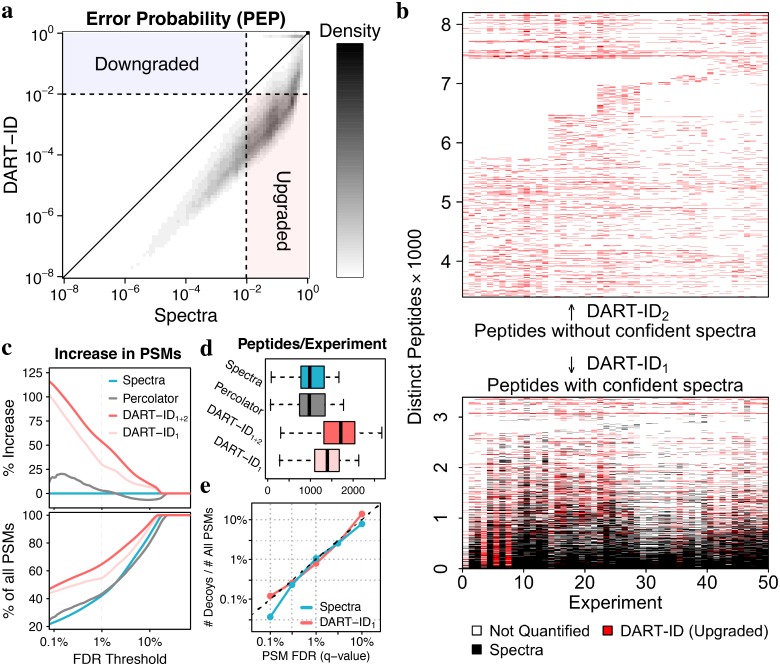
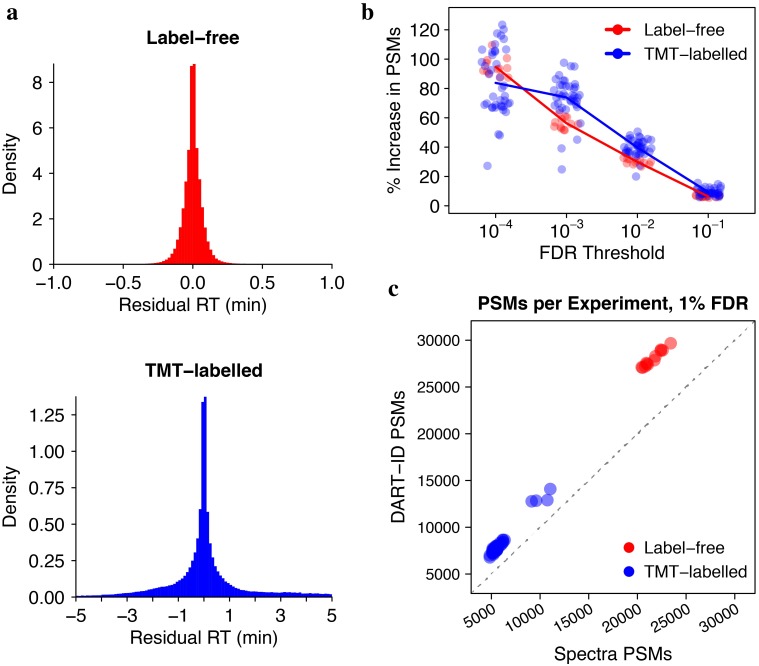
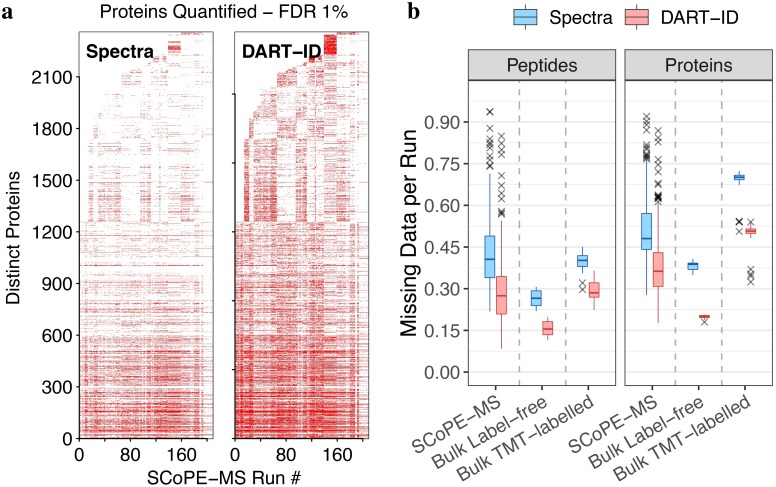
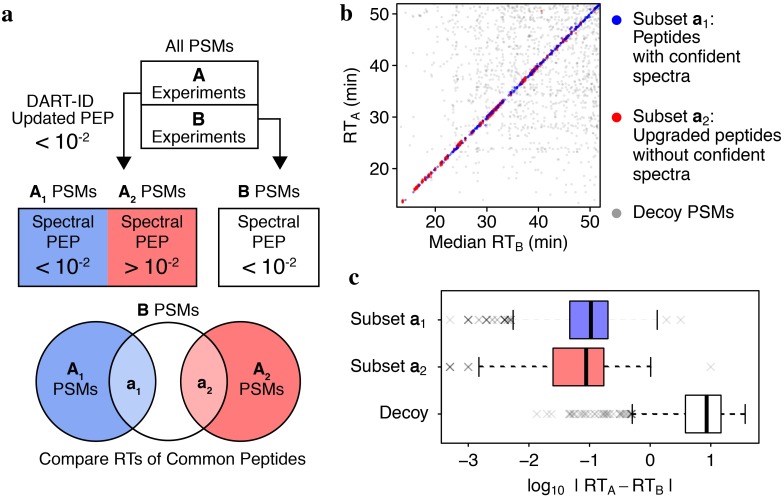
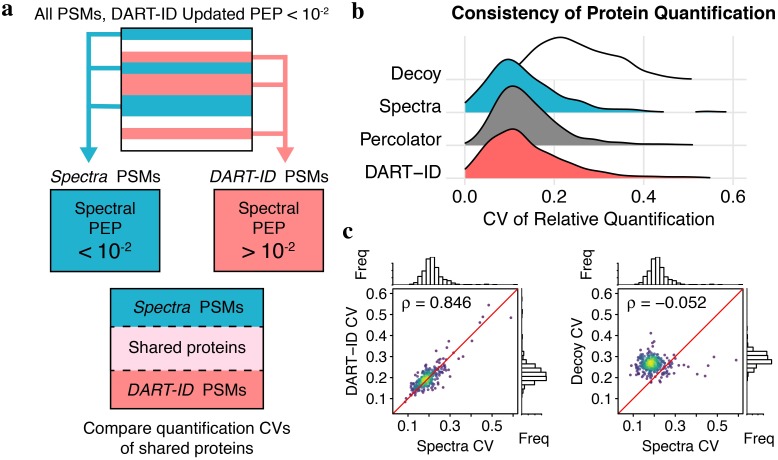
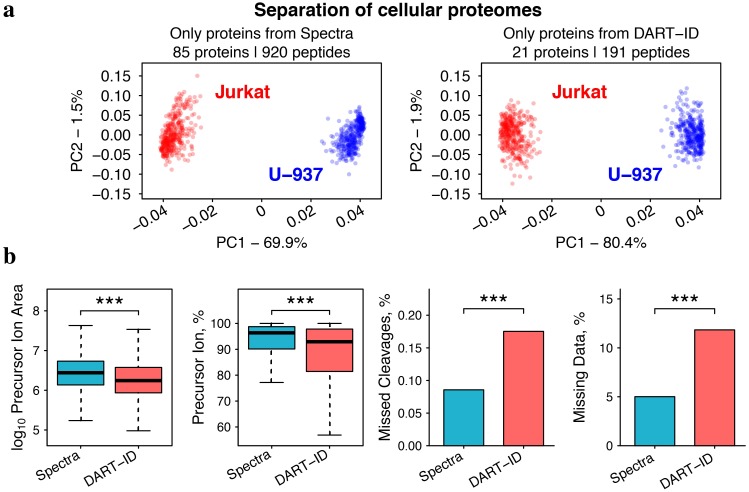
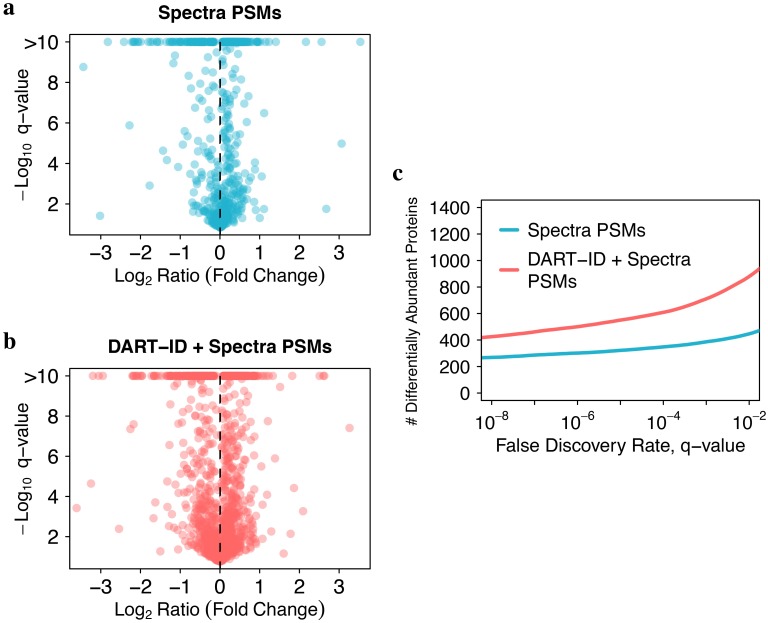
Analysis by liquid chromatography and tandem mass spectrometry (LC-MS/MS) can identify and quantify thousands of proteins in microgram-level samples, such as those comprised of thousands of cells. This process, however, remains challenging for smaller samples, such as the proteomes of single mammalian cells, because reduced protein levels reduce the number of confidently sequenced peptides. To alleviate this reduction, we developed Data-driven Alignment of Retention Times for IDentification (DART-ID). DART-ID implements principled Bayesian frameworks for global retention time (RT) alignment and for incorporating RT estimates towards improved confidence estimates of peptide-spectrum-matches. When applied to bulk or to single-cell samples, DART-ID increased the number of data points by 30-50% at 1% FDR, and thus decreased missing data. Benchmarks indicate excellent quantification of peptides upgraded by DART-ID and support their utility for quantitative analysis, such as identifying cell types and cell-type specific proteins. The additional datapoints provided by DART-ID boost the statistical power and double the number of proteins identified as differentially abundant in monocytes and T-cells. DART-ID can be applied to diverse experimental designs and is freely available at http://dart-id.slavovlab.net.


Conflict of interest statement

The authors have declared that no competing interests exist.

Figures

Fig 1
Fig 1. Bayesian framework for global RT alignment and matching spectra to peptides.
(a) DART-ID defines the global reference RT as a latent variable, Eq 1. (b) The observed RTs are modeled as a function of the reference RT, which allows incorporating experiment specific weights and the uncertainty in measured RTs and peptide identification as shown in Eq 3. Then the global alignment model simultaneously infers the reference RT and aligns all experiments by solving Eq 4. (c) A conceptual diagram for updating the confidence in a peptide-spectrum-match (PSM). The probability to observe each PSM is estimated from the conditional likelihoods for observing the RT if the PSM is assigned correctly (blue density) or incorrectly (red density). For PSM 1, P(δ = 1 | RT) < P(δ = 0 | RT), and thus the confidence decreases. Conversely, for PSM 2, P(δ = 1 | RT) > P(δ = 0 | RT), and thus the confidence increases. (d) The Bayes’ formula used to formalize the model from panel c and to update the error probability of PSMs.
Fig 2
Fig 2. Comparison of inferred reference RTs to empirical RTs.
(a) Scatter plots of observed RTs versus inferred RTs. The comparisons include 33,383 PSMs with PEP < 0.01 from 46 LC-MS/MS runs over the span of three months. The left column displays comparisons for RT prediction methods—SSRCalc [30], BioLCCC [31], and ELUDE [34]. The right column displays comparisons for alignment methods—precision iRT [52], MaxQuant match-between-runs [7, 8], and DART-ID. (b) Distributions of residual RTs: ΔRT = Observed RT − Reference RT. Note the different scales of the x-axes between the prediction and alignment methods. (c) Mean and median of the absolute values of ΔRT from panel (b).
Fig 3
Fig 3. Incorporating RTs increases confident peptide identifications.
(a) A 2D density distribution of error probabilities derived from spectra alone (Spectral PEP), compared to that after incorporating RT evidence (DART-ID PEP). (b) Map of all peptides observed across all experiments. Black marks indicate peptides with Spectral FDR < 1%, and red marks peptides with DART-ID FDR < 1%. (c) Increase in confident PSMs (top), and in the fraction of all PSMs (bottom) across the confidence range of the x-axis. The curves correspond to PEPs estimated from spectra alone, from spectra and RTs using percolator and from spectra and RTs using DART-ID. DART-ID identifications are split into DART-ID1 and DART-ID2 depending on whether the peptides have confident spectral PSMs as marked in panel (b). (d) Distributions of number of unique peptides identified per experiment. (e) The fraction of decoys, i.e. the number of decoy hits divided by the total number of PSMs, as a function of the FDR estimated from spectra alone or from DART-ID. The Spectral FDR is estimated from separate MaxQuant searches, with the FDR applied on the peptide level.
Fig 4
Fig 4. Application of DART-ID on bulk LC-MS/MS runs.
Residual RTs after DART-ID alignment for (a) label-free dataset [57] and TMT-labelled dataset [58]. (b) DART-ID doubles the PSMs at 0.01% FDR and increase them by about 40% at 1% FDR. Each circle corresponds to the number of PSMs in an LC-MS/MS run. (c) Number of PSMs per run at 1% FDR, after applying DART-ID versus before its application. The x-coordinate represents the Spectra PSMs and and y-coordinate represents the DART-ID PSMs at 1% FDR.
Fig 5
Fig 5. DART-ID decreases missing datapoints across runs.
(a) Map of quantified proteins across 209 SCoPE-MS runs, before and after applying DART-ID. A red mark denotes a protein quantified in an run at 1% FDR. Only peptides seen in >50% of experiments are included. (b) Decrease in missing data across all runs after applying DART-ID, for SCoPE-MS and the two bulk sets from Fig 4 at 1% FDR. All corresponding Spectra and DART-ID distributions differ significantly; the probability that they are sampled from the same distribution ≪ 1 * 10−10.
Fig 6
Fig 6. Validation of newly identified peptides with RT of technical replicates.
(a) Schematic design of this validation experiment. It used 11 technical replicate LC-MS/MS experiments that were run on the same day. (b) Comparison of the RTs of subsets a1 and a2 to the RTs of corresponding peptides from B. Decoy PSMs have randomly sampled RTs and are included here as a null model. (c) Residual RT distributions for the two subsets of data a1 and a2 as defined in panel a and for a decoy subset.
Fig 7
Fig 7. Validation of boosted PSMs by internal consistency.
(a) Schematic for separating PSM subsets, where Spectra and DART-ID subsets of PSMs are disjoint. (b) Distributions of coefficient of variation (CVs) for each protein in each subset. Decoy is a subset of PSMs with their protein assignments randomized. (c) Comparing protein CVs of n = 275 proteins between the Spectra and DART-ID PSM subsets, and from the Spectra and Decoy subsets.
Fig 8
Fig 8. Quantification of proteins identified by spectra alone and by DART-ID.
(a) Principal component analysis of the proteomes of 375 samples corresponding to either T-cells (Jurkat cell line) or to monocytes (U-937 cell line). The Spectra set contains proteins with Spectral PSMs filtered at 1% FDR, and the DART-ID set contains a disjoint set of proteins quantified from PSMs with high Spectral PEP but low DART-ID PEP. Only peptides with less than 5% missing data were used for this analysis, and the missing data were imputed. (b) The distributions of some features of the Spectra and DART-ID PSMs differ slightly. These features include: precursor ion area is the area under the MS1 elution peak and reflects peptide abundance; precursor ion fraction which reflects MS2 spectral purity; missed cleavages is the average number of internal lysine and arginine residues; and % missing data is the average fraction of missing TMT reporter ion quantitation per PSM. All distributions are significantly different, with p < 10−4.
Fig 9
Fig 9. DART-ID identifies more differentially abundant proteins.
The difference in protein abundance between T-cells and monocytes was visualized in the space of fold-change and its significance, i.e., volcano plots. The volcano plot using only proteins quantified from Spectra PSMs (a) identifies fewer proteins than the volcano plot using proteins from Spectra + DART-ID PSMs (b). Fold changes are averaged normalized RI intensities of T-cells (Jurkat cell line) / monocytes (U-937 cell line). q-values are computed from two-tailed t-test p-values and corrected for multiple hypotheses testing. (c) Number of differentially abundant proteins as a function of the significance FDR from panels a and b.

References

    1. Budnik B, Levy E, Harmange G, Slavov N. SCoPE-MS: mass-spectrometry of single mammalian cells quantifies proteome heterogeneity during cell differentiation. Genome Biology. 2018;19:161 10.1186/s13059-018-1547-5 - DOI - PMC - PubMed
    1. Specht H, Harmange G, Perlman DH, Emmott E, Niziolek Z, Budnik B, et al. Automated sample preparation for high-throughput single-cell proteomics. bioRxiv. 2018. 10.1101/399774 - DOI
    1. Levy E, Slavov N. Single cell protein analysis for systems biology. Essays In Biochemistry. 2018;62 10.1042/EBC20180014 - DOI - PMC - PubMed
    1. Specht H, Slavov N. Transformative opportunities for single-cell proteomics. Journal of Proteome Research. 2018;17:2563–2916. 10.1021/acs.jproteome.8b00257 - DOI - PMC - PubMed
    1. MacLean B, Tomazela DM, Shulman N, Chambers M, Finley GL, Frewen B, et al. Skyline: an open source document editor for creating and analyzing targeted proteomics experiments. Bioinformatics. 2010;26(7):966–968. 10.1093/bioinformatics/btq054 - DOI - PMC - PubMed

Publication types