

Mathematical models for cytarabine-derived myelosuppression in acute myeloid leukaemia
- PMID: 31260449
- PMCID: PMC6602180
- DOI: 10.1371/journal.pone.0204540
Mathematical models for cytarabine-derived myelosuppression in acute myeloid leukaemia
Abstract
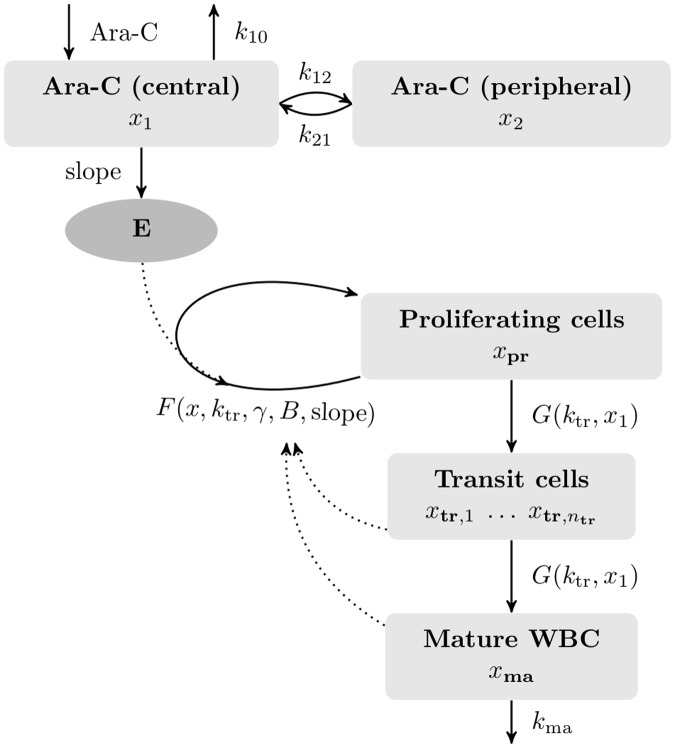
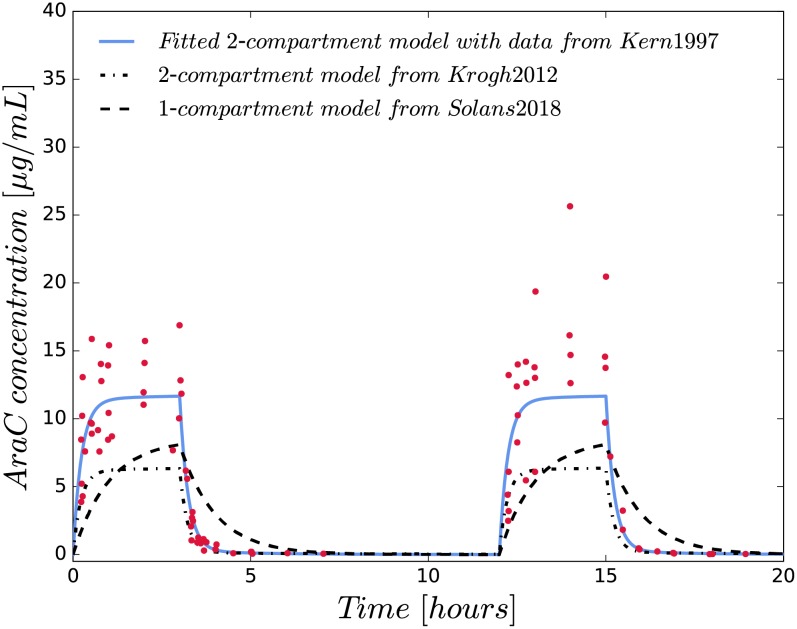
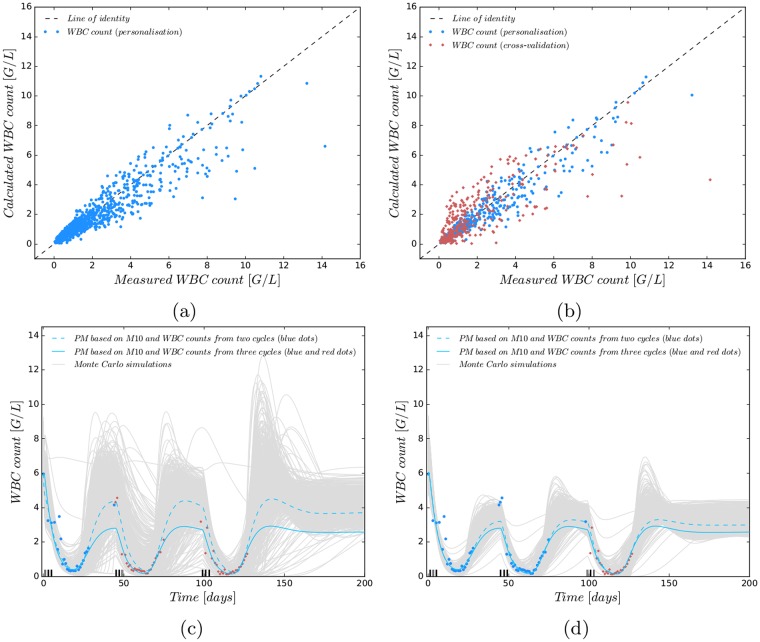
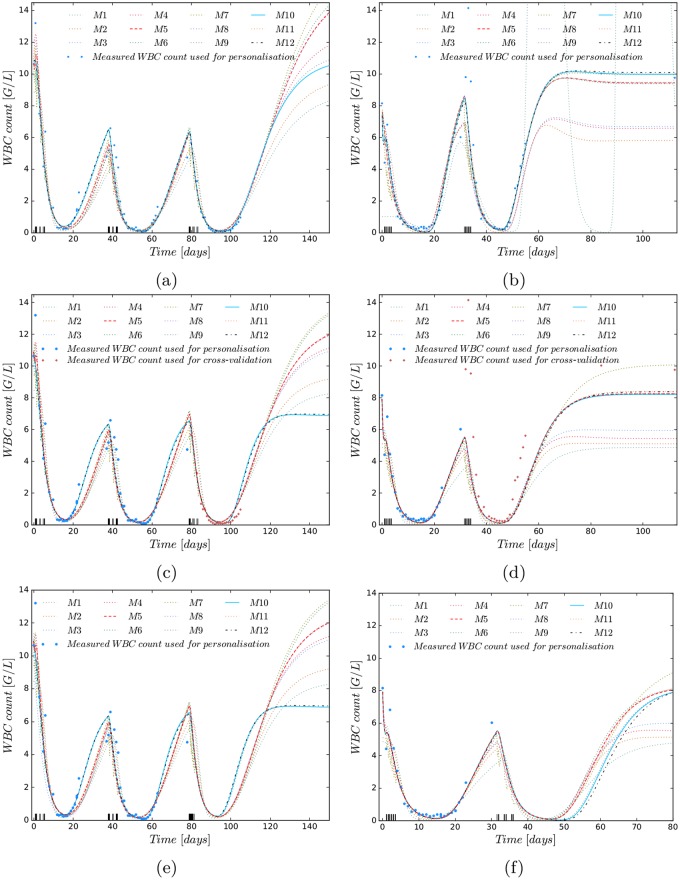
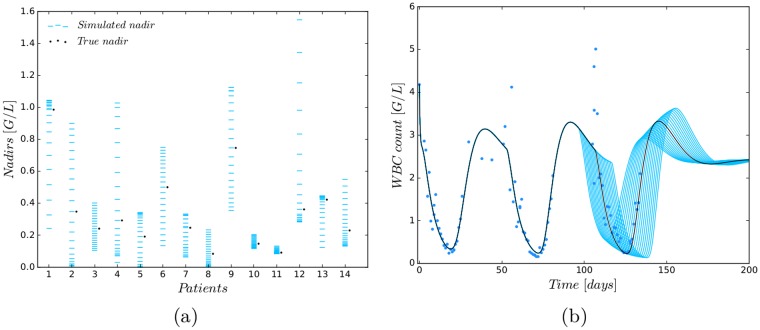
We investigate the personalisation and prediction accuracy of mathematical models for white blood cell (WBC) count dynamics during consolidation treatment using intermediate or high-dose cytarabine (Ara-C) in acute myeloid leukaemia (AML). Ara-C is the clinically most relevant cytotoxic agent for AML treatment. We extend a mathematical model of myelosuppression and a pharmacokinetic model of Ara-C with different hypotheses of Ara-C's pharmacodynamic effects. We cross-validate the 12 model variations using dense WBC count measurements from 23 AML patients. Surprisingly, the prediction accuracy remains satisfactory in each of the models despite different modelling hypotheses. Therefore, we compare average clinical and calculated WBC recovery times for different Ara-C schedules as a successful methodology for model discrimination. As a result, a new hypothesis of a secondary pharmacodynamic effect on the proliferation rate seems plausible. Furthermore, we demonstrate the impact of treatment timing on subsequent nadir values based on personalised predictions as a possibility for influencing/controlling myelosuppression.
Conflict of interest statement
The authors have declared that no competing interests exist.
Figures
Similar articles
-
Model-Based Optimal AML Consolidation Treatment.IEEE Trans Biomed Eng. 2020 Dec;67(12):3296-3306. doi: 10.1109/TBME.2020.2982749. Epub 2020 Nov 19. IEEE Trans Biomed Eng. 2020. PMID: 32406820
-
Homoharringtonine enhances cytarabine-induced apoptosis in acute myeloid leukaemia by regulating the p38 MAPK/H2AX/Mcl-1 axis.BMC Cancer. 2024 Apr 24;24(1):520. doi: 10.1186/s12885-024-12286-7. BMC Cancer. 2024. PMID: 38658865 Free PMC article.
-
A randomized comparison of modified intermediate-dose Ara-C versus high-dose ara-c in post-remission therapy for acute myeloid leukemia.Anticancer Res. 2012 Feb;32(2):643-7. Anticancer Res. 2012. PMID: 22287757 Clinical Trial.
-
[Is the pharmacokinetic profile of cytarabine clinically relevant?].Klin Padiatr. 1992 Jul-Aug;204(4):198-203. doi: 10.1055/s-2007-1025349. Klin Padiatr. 1992. PMID: 1518256 Review. German.
-
Daunorubicin and cytarabine for certain types of poor-prognosis acute myeloid leukemia: a systematic literature review.Expert Rev Clin Pharmacol. 2019 Mar;12(3):197-218. doi: 10.1080/17512433.2019.1573668. Epub 2019 Feb 6. Expert Rev Clin Pharmacol. 2019. PMID: 30672340
Cited by
-
AML consolidation therapy: timing matters.J Cancer Res Clin Oncol. 2023 Nov;149(15):13811-13821. doi: 10.1007/s00432-023-05115-0. Epub 2023 Aug 3. J Cancer Res Clin Oncol. 2023. PMID: 37535164 Free PMC article.
-
Modelling post-chemotherapy stem cell dynamics in the bone marrow niche of AML patients.Sci Rep. 2024 Oct 23;14(1):25060. doi: 10.1038/s41598-024-75429-7. Sci Rep. 2024. PMID: 39443599 Free PMC article.
-
An integrative systems biology approach to overcome venetoclax resistance in acute myeloid leukemia.PLoS Comput Biol. 2022 Sep 13;18(9):e1010439. doi: 10.1371/journal.pcbi.1010439. eCollection 2022 Sep. PLoS Comput Biol. 2022. PMID: 36099249 Free PMC article.
-
Pharmacokinetic-pharmacodynamic modeling of maintenance therapy for childhood acute lymphoblastic leukemia.Sci Rep. 2023 Jul 20;13(1):11749. doi: 10.1038/s41598-023-38414-0. Sci Rep. 2023. PMID: 37474565 Free PMC article.
-
Prediction of leukocyte counts during paediatric acute lymphoblastic leukaemia maintenance therapy.Sci Rep. 2019 Dec 2;9(1):18076. doi: 10.1038/s41598-019-54492-5. Sci Rep. 2019. PMID: 31792398 Free PMC article.
References
-
- Jost F, Sager S, Le TTT. A feedback optimal control algorithm with optimal measurement time points. Processes. 2017;5(10):1–19.
Publication types
MeSH terms
Substances
LinkOut - more resources
Full Text Sources
Medical
Research Materials
