. 2019 Oct 15:200:302-312.
doi: 10.1016/j.neuroimage.2019.06.065. Epub 2019 Jun 28.

Development of a transcallosal tractography template and its application to dementia

Affiliations

Development of a transcallosal tractography template and its application to dementia

Derek B Archer et al. Neuroimage. .

Abstract

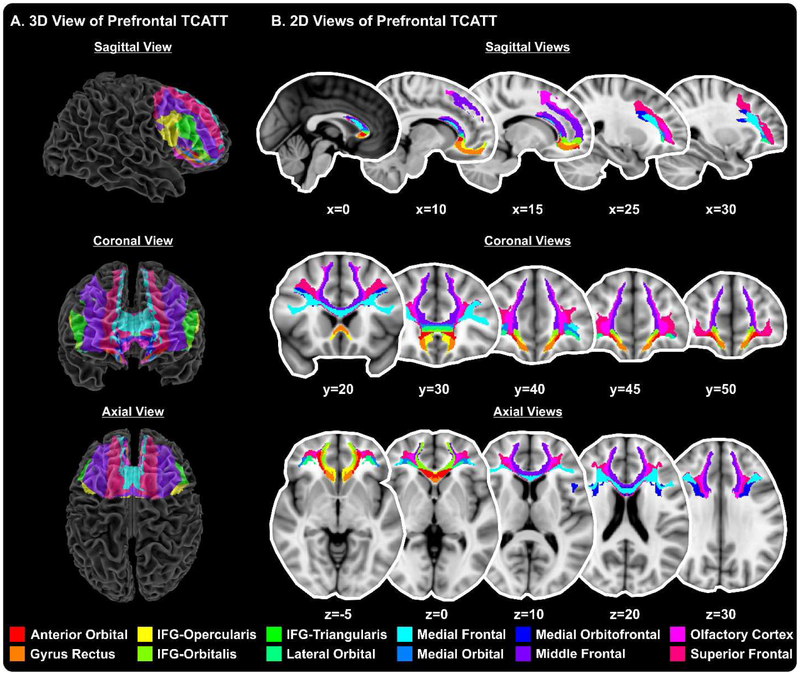
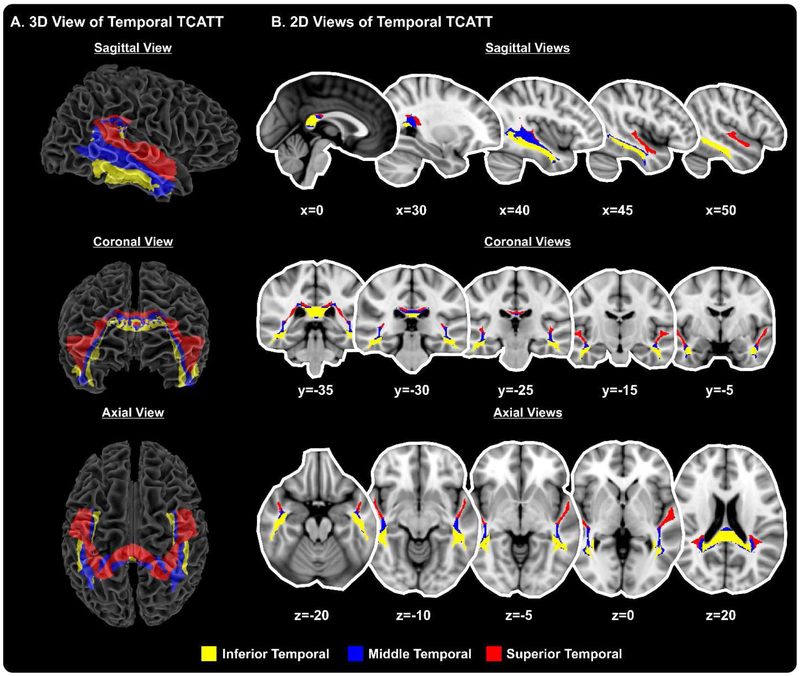
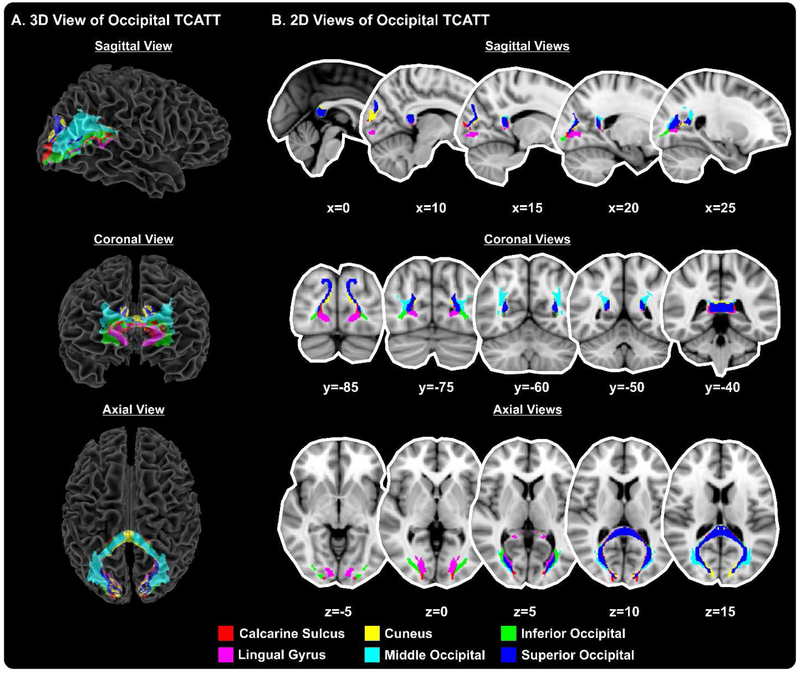
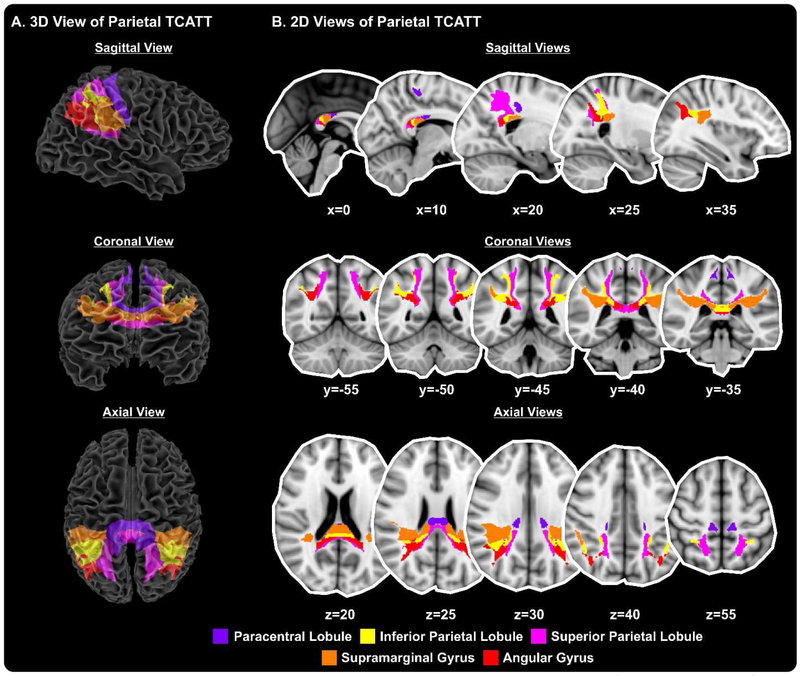
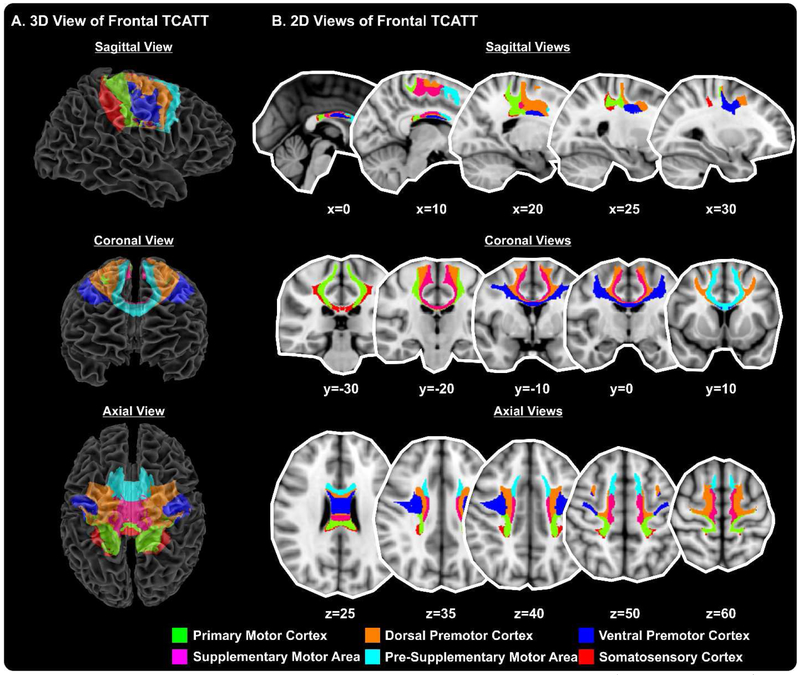
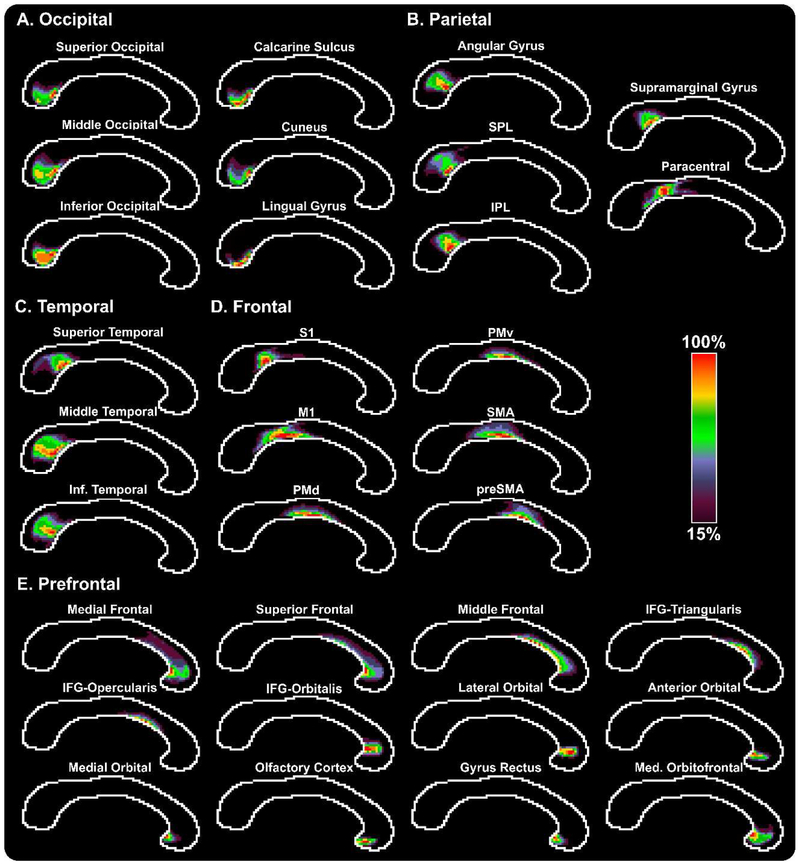
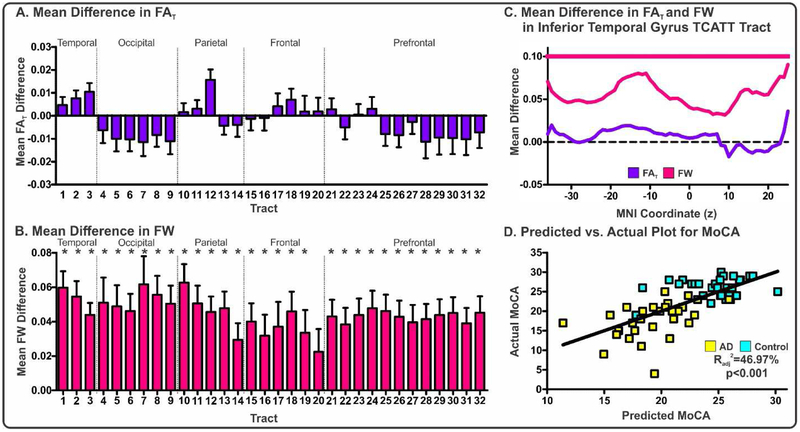
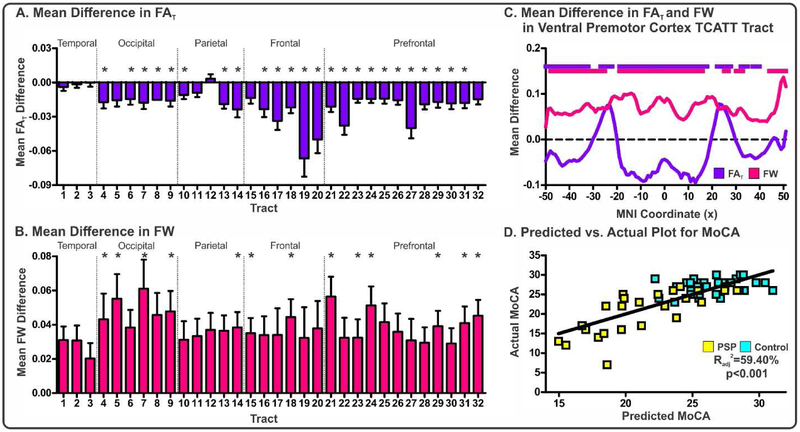
Understanding the architecture of transcallosal connections would allow for more specific assessments of neurodegeneration across many fields of neuroscience, neurology, and psychiatry. To map these connections, we conducted probabilistic tractography in 100 Human Connectome Project subjects in 32 cortical areas using novel post-processing algorithms to create a spatially precise Trancallosal Tract Template (TCATT). We found robust transcallosal tracts in all 32 regions, and a topographical analysis in the corpus callosum largely agreed with well-established subdivisions of the corpus callosum. We then obtained diffusion MRI data from a cohort of patients with Alzheimer's disease (AD) and another with progressive supranuclear palsy (PSP) and used a two-compartment model to calculate free-water corrected fractional anisotropy (FAT) and free-water (FW) within the TCATT. These metrics were used to determine between-group differences and to determine which subset of tracts was best associated with cognitive function (Montreal Cognitive Assessment (MoCA)). In AD, we found robust between-group differences in FW (31/32 TCATT tracts) in the absence of between-group differences in FAT. FW in the inferior temporal gyrus TCATT tract was most associated with MoCA scores in AD. In PSP, there were widespread differences in both FAT and FW, and MoCA was predicted by FAT in the inferior frontal pars triangularis, preSMA, and medial frontal gyrus TCATT tracts as well as FW in the inferior frontal pars opercularis TCATT tract. The TCATT improves spatial localization of corpus callosum measurements to enhance the evaluation of treatment effects, as well as the monitoring of brain microstructure in relation to cognitive dysfunction and disease progression. Here, we have shown its direct relevance in capturing between-group differences and associating it with the MoCA in AD and PSP.

Keywords: Alzheimer's disease; Atlas; Corpus callosum; Free-water; Progressive supranuclear palsy; Template.


Figures

Figure 1.
Figure 1.. The Transcallosal Tract Template (TCATT) Prefrontal Tracts.
The TCATT contains 3-dimensional commissural connections of 12 different prefrontal cortical areas (A), including the anterior orbital gyrus, gyrus rectus, inferior frontal gyrus pars opercularis (IFG-Opercularis), inferior frontal gyrus pars orbitalis (IFG-Orbitalis), inferior frontal gyrus pars triangularis (IFG-Triangularis), lateral orbital gyrus, medial frontal gyrus, medial orbital gyrus, medial orbitofrontal gyrus, middle frontal gyrus, olfactory cortex, and the superior frontal gyrus. (B) The 2-dimensional representation of these tracts in the sagittal view (x=0, 10, 15, 25, 30), coronal view (y=20, 30, 40, 45, 50), and axial view (z=−5, z=0, z=10, z=20, z=30).
Figure 2.
Figure 2.. The Transcallosal Tract Template (TCATT) Temporal Tracts.
The TCATT contains 3-dimensional commissural connections of 3 different temporal cortical areas (A), including the inferior temporal gyrus, middle temporal gyrus, and superior temporal gyrus. (B) The 2-dimensional representation of these tracts in the sagittal view (x=0, 30, 40, 45, 50), coronal view (y=−5, −15, −25, −30, − 35), and axial view (z=−20, z=−10, z=−5, z=0, z=20).
Figure 3.
Figure 3.. The Transcallosal Tract Template (TCATT) Occipital Tracts.
The TCATT contains 3-dimensional commissural connections of 6 different occipital cortical areas (A), including the calcarine sulcus, cuneus, inferior occipital gyrus, lingual gyrus, middle occipital gyrus, and superior occipital gyrus. (B) The 2-dimensional representation of these tracts in the sagittal view (x=0, 10, 15, 20, 25), coronal view (y=−85, −75, −60, −50, −40), and axial view (z=−5, z=0, z=5, z=10, z=15).
Figure 4.
Figure 4.. The Transcallosal Tract Template (TCATT) Parietal Tracts.
The TCATT contains 3-dimensional commissural connections of 5 different parietal cortical areas (A), including the paracentral lobule, inferior parietal lobule, superior parietal lobule, supramarginal gyrus, and angular gyrus. (B) The 2-dimensional representation of these tracts in the sagittal view (x=0, 10, 20, 25, 35), coronal view (y= −55, −50, −45, −40, −35), and axial view (z=20, z=25, z=30, z=40, z=55).
Figure 5.
Figure 5.. The Transcallosal Tract Template (TCATT) Frontal Tracts.
The TCATT contains 3-dimensional commissural connections of 6 different frontal cortical areas (A), including the primary motor cortex, dorsal premotor cortex, ventral premotor cortex, supplementary motor area, presupplementary motor area, and somatosensory cortex. (B) The 2-dimensional representation of these tracts in the sagittal view (x=0, 10, 20, 25, 30), coronal view (y=−30, −20, −10, 0, 10), and axial view (z=25, z=35, z=40, z=50, z=60).
Figure 6.
Figure 6.. TCATT Topography in the Corpus Callosum in Young Healthy Adults.
Probabilistic group maps are shown for each TCATT tract, grouped into their respective lobes (A – Occipital, B – Parietal, C – Temporal, D – Frontal, E – Prefrontal). The color bar ranges from purple (15%) to red (100%), with higher intensity indicating higher probability that a voxel is within a tract. Voxels with less than 15% probability have been excluded from the group maps. Abbreviations: IFG, inferior frontal gyrus; M1, primary motor cortex; PMd, dorsal premotor cortex; PMv, ventral premotor cortex; SMA, supplementary motor area; preSMA, pre-supplementary motor area; S1, somatosensory cortex; IPL, inferior parietal lobule; SPL, superior parietal lobule.
Figure 7.
Figure 7.. Evaluation of FAT and FW within the TCATT for the AD Cohort.
Mean differences in FAT (A) and FW (B) for AD-control for each TCATT tract grouped by their cortical projection (Temporal, Occipital, Parietal, Frontal, Prefrontal). Columns represent mean difference between group and error bars represent standard deviation. Significant mean differences were followed with slice-level analyses. The FAT (blue) and FW (pink) profiles for the inferior temporal gyrus commissural TCATT tract are shown in (C), where FDR corrected t-tests were performed at each slice, in which age, sex, and scanner site were inputted as covariates. Slices which exhibited FDR corrected significance (pFDR<0.05) are shown with horizontal blue or pink lines. (D) The predicted versus actual plot for the input variables which were most associated with MoCA in the AD cohort (AD: yellow; Control:cyan), which included FW in inferior temporal gyrus TCATT tract and scanner site. Abbreviations:1, inferior temporal gyrus; 2, middle temporal gyrus; 3, superior temporal gyrus; 4, lingual gyrus; 5,calcarine sulcus; 6, cuneus; 7, inferior occipital gyrus; 8, middle occipital gyrus; 9, superior occipital gyrus; 10, angular gyrus; 11,inferior parietal lobule; 12, supramarginal gyrus; 13, superior parietal lobule; 14, paracentral lobule; 15, somatosensory cortex; 16, primary motor cortex; 17, dorsal premotor cortex; 18, ventral premotor cortex; 19, pre-supplementary motor area; 20, supplementary motor area; 21, inferior frontal gyrus pars opercularis; 22, medial frontal gyrus; 23, middle frontal gyrus; 24, inferior frontal gyrus pars triangularis; 25, inferior frontal gyrus pars orbitalis; 26, lateral orbital gyrus; 27, superior frontal gyrus; 28, anterior orbital gyrus; 29, gyrus rectus; 30, medial orbital gyrus; 31, medial orbitofrontal gyrus; 32, olfactory cortex. All subjects in the AD cohort were obtained from the ADNI database.
Figure 8.
Figure 8.. Evaluation of FAT and FW within the TCATT for the PSP Cohort.
Mean differences in FAT (A) and FW (B) for PSP-control for each TCATT tract grouped by their cortical projection (Temporal, Occipital, Parietal, Frontal, Prefrontal). Columns represent mean difference between group and error bars represent standard deviation. Significant mean differences were followed with slice-level analyses. The FAT (blue) and FW (pink) profiles for the ventral premotor cortex TCATT tract are shown in (C), where FDR corrected t-tests were performed at each slice, in which age and sex were inputted as covariates. Slices which exhibited FDR corrected significance (pFDR<0.05) are shown with horizontal blue or pink lines. (D) The predicted versus actual plot for the input variables which were most associated with MoCA in the PSP cohort (PSP: yellow; Control: cyan), which included gender, FAT in the inferior frontal pars triangularis, preSMA, and medial frontal gyrus TCATT tracts as well as and FW in the inferior frontal pars opercularis TCATT tract. Abbreviations: 1, inferior temporal gyrus; 2, middle temporal gyrus; 3, superior temporal gyrus; 4, lingual gyrus; 5, calcarine sulcus; 6, cuneus; 7, inferior occipital gyrus; 8, middle occipital gyrus; 9, superior occipital gyrus; 10, angular gyrus; 11, inferior parietal lobule; 12, supramarginal gyrus; 13, superior parietal lobule; 14, paracentral lobule; 15, somatosensory cortex; 16, primary motor cortex; 17, dorsal premotor cortex; 18, ventral premotor cortex; 19, pre-supplementary motor area; 20, supplementary motor area; 21, inferior frontal gyrus pars opercularis; 22, medial frontal gyrus; 23, middle frontal gyrus; 24, inferior frontal gyrus pars triangularis; 25, inferior frontal gyrus pars orbitalis; 26, lateral orbital gyrus; 27, superior frontal gyrus; 28, anterior orbital gyrus; 29, gyrus rectus; 30, medial orbital gyrus; 31, medial orbitofrontal gyrus; 32, olfactory cortex. All subjects in the PSP cohort were obtained from the University of Florida.

References

    1. Abe O, Masutani Y, Aoki S, Yamasue H, Yamada H, Kasai K, Mori H, Hayashi N, Masumoto T, Ohtomo K, 2004. Topography of the human corpus callosum using diffusion tensor tractography. J Comput Assist Tomogr 28, 533–539. - PubMed
    1. Andersson JLR, Sotiropoulos SN, 2016. An integrated approach to correction for off-resonance effects and subject movement in diffusion MR imaging. Neuroimage 125, 1063–1078. - PMC - PubMed
    1. Archer DB, Coombes SA, Chu WT, Chung JW, Burciu RG, Okun MS, Wagle Shukla A, Vaillancourt DE, 2018a. A widespread visually-sensitive functional network relates to symptoms in essential tremor. Brain 141, 472–485. - PMC - PubMed
    1. Archer DB, Vaillancourt DE, Coombes SA, 2018b. A Template and Probabilistic Atlas of the Human Sensorimotor Tracts using Diffusion MRI. Cereb Cortex 28, 1685–1699. - PMC - PubMed
    1. Arnone D, Barrick TR, Chengappa S, Mackay CE, Clark CA, Abou-Saleh MT, 2008. Corpus callosum damage in heavy marijuana use: preliminary evidence from diffusion tensor tractography and tract-based spatial statistics. Neuroimage 41, 1067–1074. - PubMed

Publication types