

Safety-Net Hospitals, Neighborhood Disadvantage, and Readmissions Under Maryland's All-Payer Program: An Observational Study
- PMID: 31261378
- PMCID: PMC6736732
- DOI: 10.7326/M16-2671
Safety-Net Hospitals, Neighborhood Disadvantage, and Readmissions Under Maryland's All-Payer Program: An Observational Study
Abstract
Background: Safety-net hospitals have higher-than-expected readmission rates. The relative roles of the mean disadvantage of neighborhoods the hospitals serve and the disadvantage of individual patients in predicting a patient's readmission are unclear.
Objective: To examine the independent contributions of the patient's neighborhood and the hospital's service area to risk for 30-day readmission.
Design: Retrospective observational study.
Setting: Maryland.
Participants: All Maryland residents discharged from a Maryland hospital in 2015.
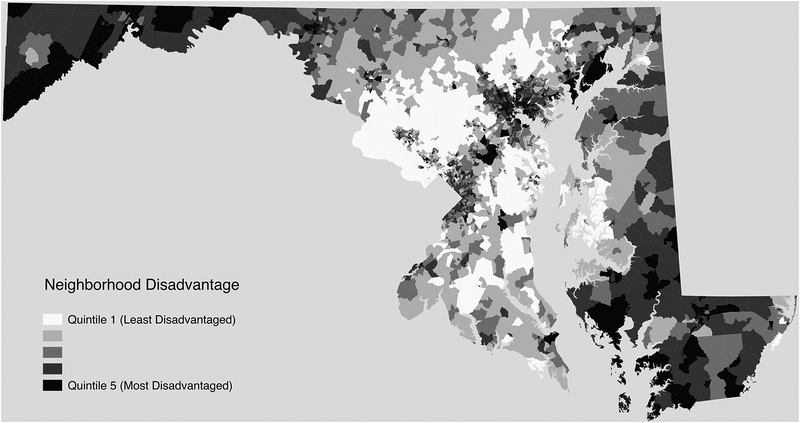
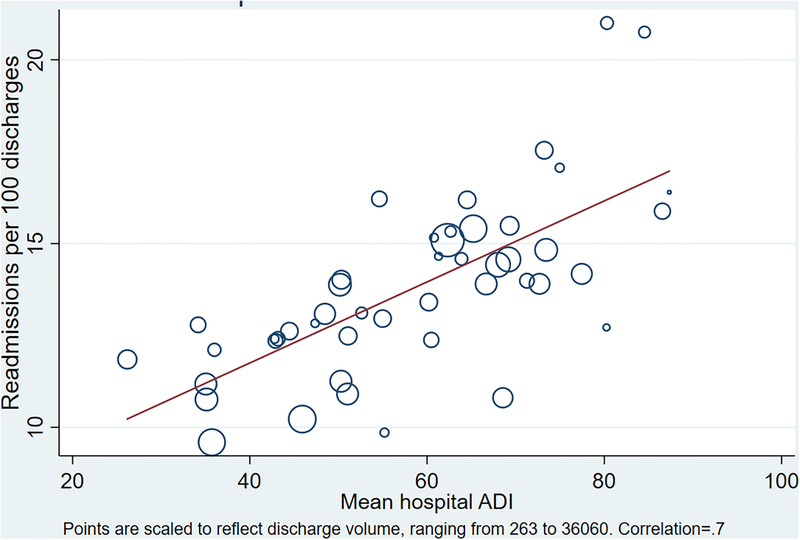
Measurements: Predictors included the disadvantage of neighborhoods for each Maryland resident (area disadvantage index) and the mean disadvantage of each hospital's discharged patients (safety-net index). The primary outcome was unplanned 30-day hospital readmission. Generalized estimating equations and marginal modeling were used to estimate readmission rates. Results were adjusted for clinical readmission risk.
Results: 13.4% of discharged patients were readmitted within 30 days. Patients living in neighborhoods at the 90th percentile of disadvantage had a readmission rate of 14.1% (95% CI, 13.6% to 14.5%) compared with 12.5% (CI, 11.8% to 13.2%) for similar patients living in neighborhoods at the 10th percentile. Patients discharged from hospitals at the 90th percentile of safety-net status had a readmission rate of 14.8% (CI, 13.4% to 16.1%) compared with 11.6% (CI, 10.5% to 12.7%) for similar patients discharged from hospitals at the 10th percentile of safety-net status. The association of readmission risk with the hospital's safety-net index was approximately twice the observed association with the patient's neighborhood disadvantage status.
Limitations: Generalizability outside Maryland is unknown. Confounding may be present.
Conclusion: In Maryland, residing in a disadvantaged neighborhood and being discharged from a hospital serving a large proportion of disadvantaged neighborhoods are independently associated with increased risk for readmission.
Primary funding source: National Institute on Minority Health and Health Disparities and Maryland Health Services Cost Review Commission.
Figures
Comment in
-
Area Deprivation and Inequalities in Health and Health Care Outcomes.Ann Intern Med. 2019 Jul 16;171(2):131-132. doi: 10.7326/M19-1510. Epub 2019 Jul 2. Ann Intern Med. 2019. PMID: 31261382 No abstract available.
References
-
- Boccuti C, Casillas G. Aiming for fewer hospital U-turns: the Medicare Hospital Readmission Reduction Program. Washington, DC: Kaiser Family Foundation; 2017. Accessed at https://www.kff.org/medicare/issue-brief/aiming-for-fewer-hospital-u-tur... 8 May 2019.
-
- Improving Medicare Post-Acute Care Transformation Act of 2014. Pub L No 113–185, 128 Stat 1952.
-
- Assistant Secretary for Planning and Evaluation. Report to Congress: Social Risk Factors and Performance Under Medicare’s Value-Based Purchasing Programs. Washington, DC: U.S. Department of Health & Human Services; 2016.
-
- Kwan LY, Stratton K, Steinwachs DM. Accounting for Social Risk Factors in Medicare Payment. Washington, DC: National Academies Pr; 2017. - PubMed
Publication types
MeSH terms
Grants and funding
LinkOut - more resources
Full Text Sources