

In Silico Prediction of PAMPA Effective Permeability Using a Two-QSAR Approach
- PMID: 31261723
- PMCID: PMC6651837
- DOI: 10.3390/ijms20133170
In Silico Prediction of PAMPA Effective Permeability Using a Two-QSAR Approach
Abstract
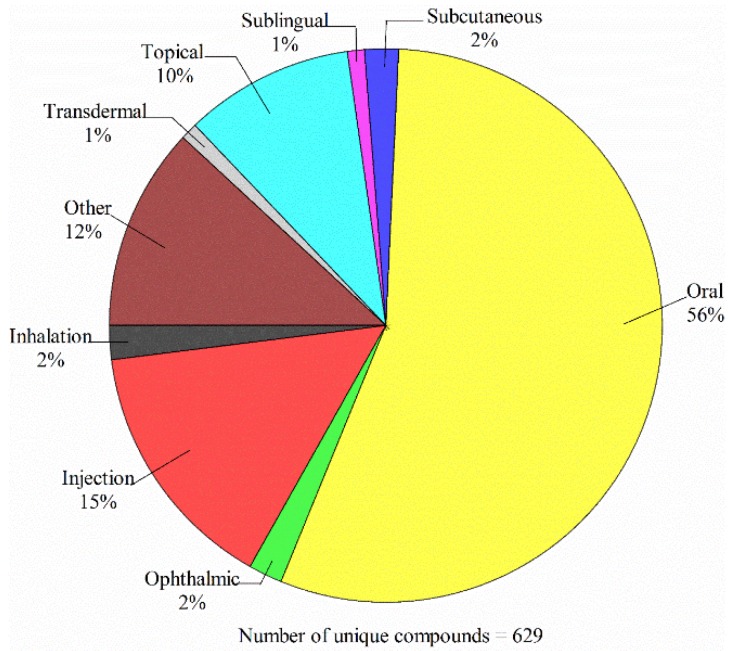
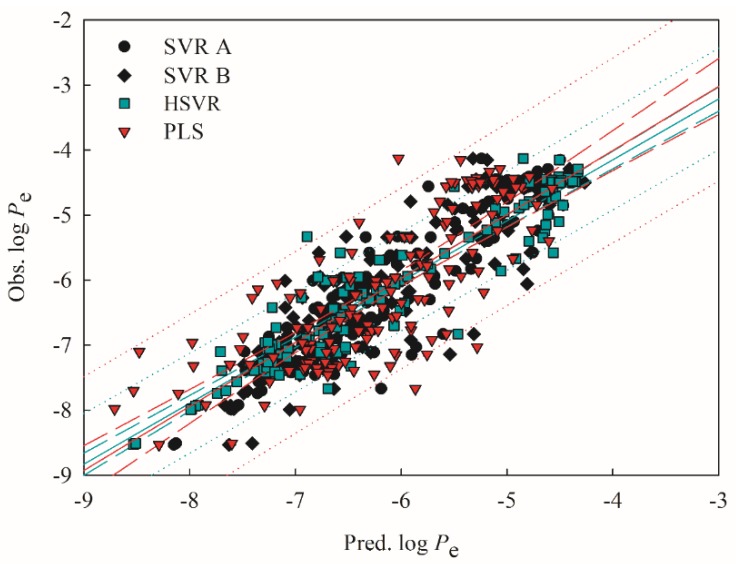
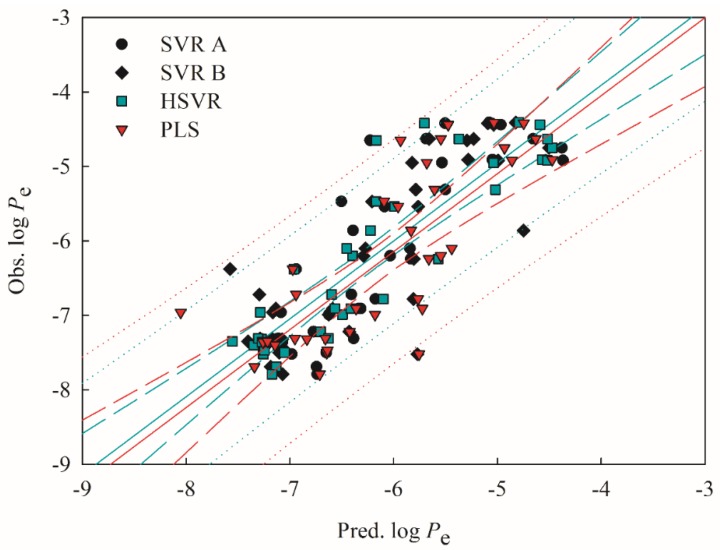
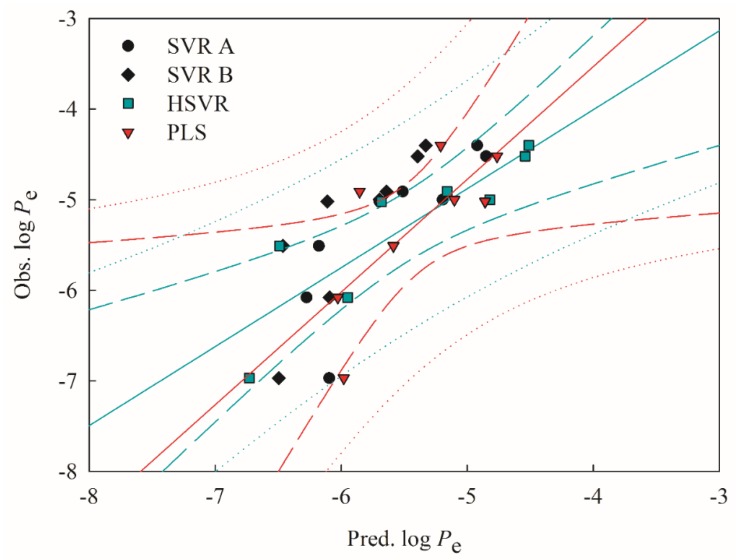
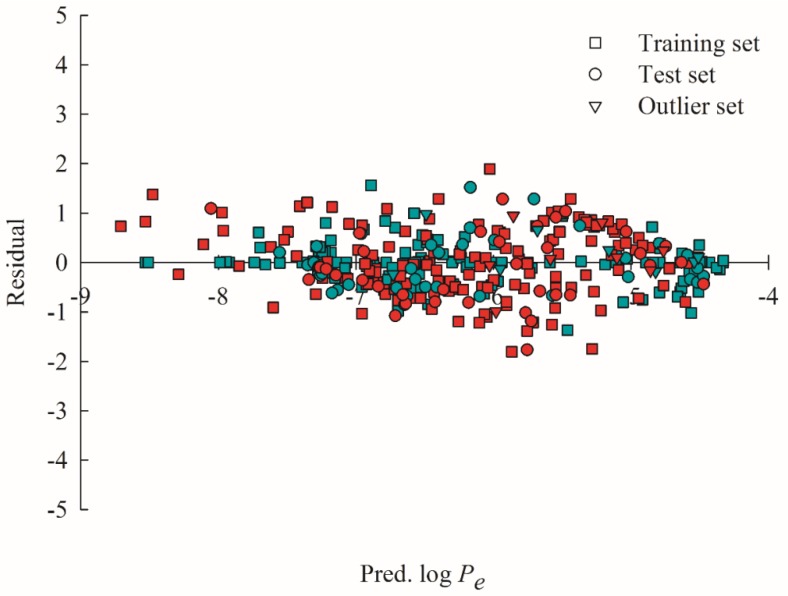
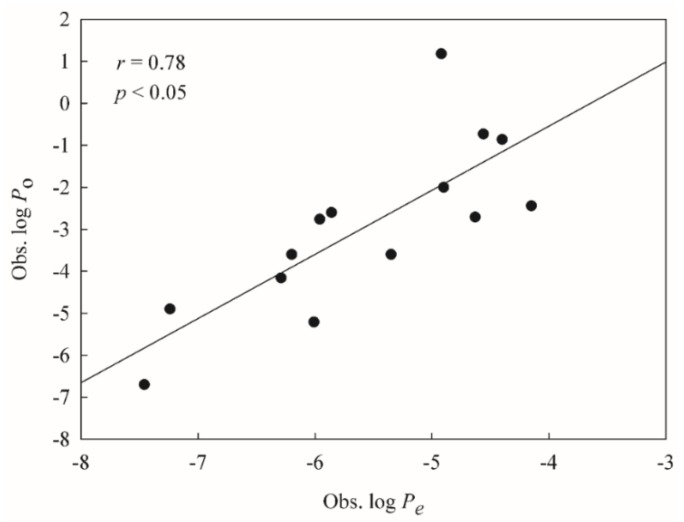
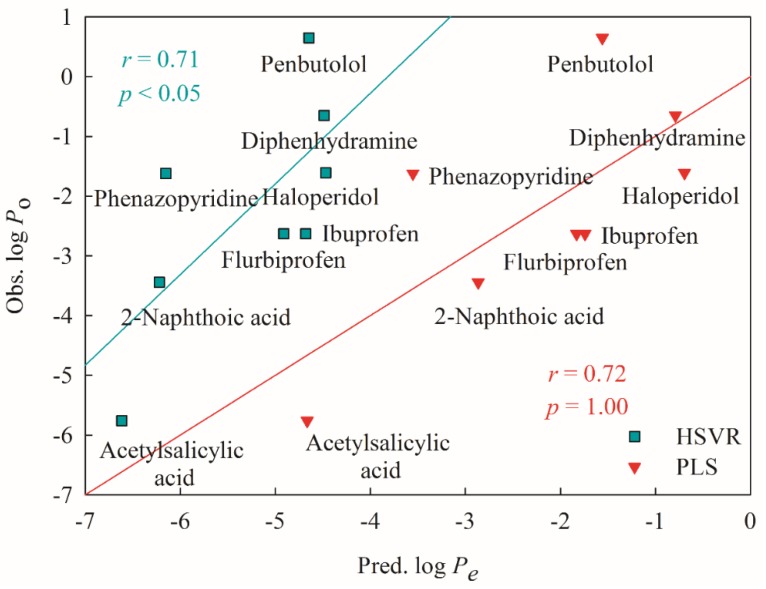
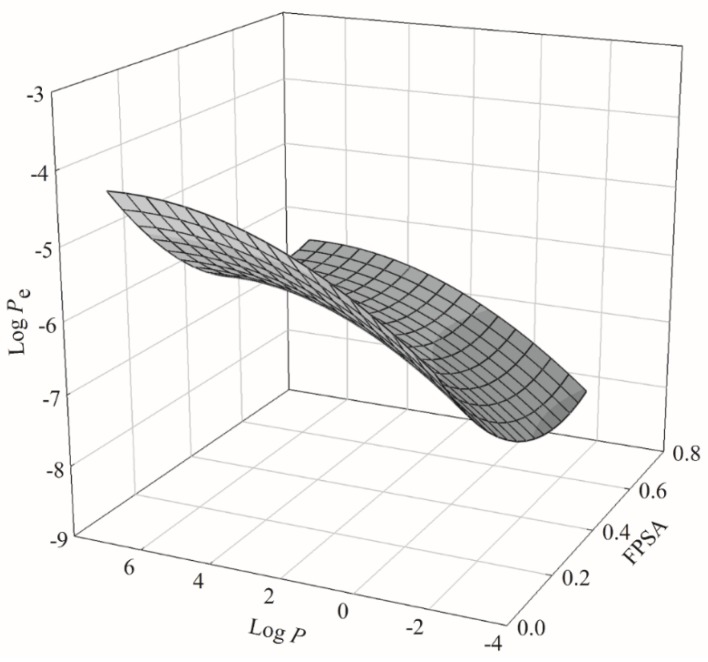
Oral administration is the preferred and predominant route of choice for medication. As such, drug absorption is one of critical drug metabolism and pharmacokinetics (DM/PK) parameters that should be taken into consideration in the process of drug discovery and development. The cell-free in vitro parallel artificial membrane permeability assay (PAMPA) has been adopted as the primary screening to assess the passive diffusion of compounds in the practical applications. A classical quantitative structure-activity relationship (QSAR) model and a machine learning (ML)-based QSAR model were derived using the partial least square (PLS) scheme and hierarchical support vector regression (HSVR) scheme to elucidate the underlying passive diffusion mechanism and to predict the PAMPA effective permeability, respectively, in this study. It was observed that HSVR executed better than PLS as manifested by the predictions of the samples in the training set, test set, and outlier set as well as various statistical assessments. When applied to the mock test, which was designated to mimic real challenges, HSVR also showed better predictive performance. PLS, conversely, cannot cover some mechanistically interpretable relationships between descriptors and permeability. Accordingly, the synergy of predictive HSVR and interpretable PLS models can be greatly useful in facilitating drug discovery and development by predicting passive diffusion.
Keywords: effective permeability coefficient (Pe); hierarchical support vector regression; in silico; parallel artificial membrane permeability assay (PAMPA); partial least square; two-QSAR.
Conflict of interest statement
The authors declare that they have no conflict of interest.
Figures

Similar articles
-
In Silico Prediction of Intestinal Permeability by Hierarchical Support Vector Regression.Int J Mol Sci. 2020 May 19;21(10):3582. doi: 10.3390/ijms21103582. Int J Mol Sci. 2020. PMID: 32438630 Free PMC article.
-
Using in vitro ADME data for lead compound selection: An emphasis on PAMPA pH 5 permeability and oral bioavailability.Bioorg Med Chem. 2022 Feb 15;56:116588. doi: 10.1016/j.bmc.2021.116588. Epub 2022 Jan 5. Bioorg Med Chem. 2022. PMID: 35030421 Free PMC article. Review.
-
In Silico Prediction of Skin Permeability Using a Two-QSAR Approach.Pharmaceutics. 2022 Apr 28;14(5):961. doi: 10.3390/pharmaceutics14050961. Pharmaceutics. 2022. PMID: 35631545 Free PMC article.
-
In silico prediction of the mutagenicity of nitroaromatic compounds using a novel two-QSAR approach.Toxicol In Vitro. 2017 Apr;40:102-114. doi: 10.1016/j.tiv.2016.12.013. Epub 2016 Dec 24. Toxicol In Vitro. 2017. PMID: 28027902
-
[In-silico prediction of pharmacokinetic properties].Yakugaku Zasshi. 2005 Nov;125(11):853-61. doi: 10.1248/yakushi.125.853. Yakugaku Zasshi. 2005. PMID: 16272806 Review. Japanese.
Cited by
-
In Silico Prediction of Intestinal Permeability by Hierarchical Support Vector Regression.Int J Mol Sci. 2020 May 19;21(10):3582. doi: 10.3390/ijms21103582. Int J Mol Sci. 2020. PMID: 32438630 Free PMC article.
-
Predicting Pharmacokinetic Properties of Potential Anticancer Agents via Their Chromatographic Behavior on Different Reversed Phase Materials.Int J Mol Sci. 2021 Apr 20;22(8):4257. doi: 10.3390/ijms22084257. Int J Mol Sci. 2021. PMID: 33923942 Free PMC article.
-
Using in vitro ADME data for lead compound selection: An emphasis on PAMPA pH 5 permeability and oral bioavailability.Bioorg Med Chem. 2022 Feb 15;56:116588. doi: 10.1016/j.bmc.2021.116588. Epub 2022 Jan 5. Bioorg Med Chem. 2022. PMID: 35030421 Free PMC article. Review.
-
Investigation of the Uptake and Transport of Aspirin Eugenol Ester in the Caco-2 Cell Model.Front Pharmacol. 2022 May 4;13:887598. doi: 10.3389/fphar.2022.887598. eCollection 2022. Front Pharmacol. 2022. PMID: 35600888 Free PMC article.
-
In Silico Prediction of Skin Permeability Using a Two-QSAR Approach.Pharmaceutics. 2022 Apr 28;14(5):961. doi: 10.3390/pharmaceutics14050961. Pharmaceutics. 2022. PMID: 35631545 Free PMC article.
References
-
- Gad S.C. Oral Drug Formulation Development in Pharmaceutical Lead Selection Stage. In: Kwong E., editor. Oral Formulation Roadmap from Early Drug Discovery to Development. John Wiley & Sons, Inc.; Hoboken, NJ, USA: 2017. pp. 39–88.
MeSH terms
Grants and funding
LinkOut - more resources
Full Text Sources
Molecular Biology Databases
Research Materials
