

Morphological, Transcriptomic and Hormonal Characterization of Trimonoecious and Subandroecious Pumpkin (Cucurbita maxima) Suggests Important Roles of Ethylene in Sex Expression
- PMID: 31261811
- PMCID: PMC6651883
- DOI: 10.3390/ijms20133185
Morphological, Transcriptomic and Hormonal Characterization of Trimonoecious and Subandroecious Pumpkin (Cucurbita maxima) Suggests Important Roles of Ethylene in Sex Expression
Abstract
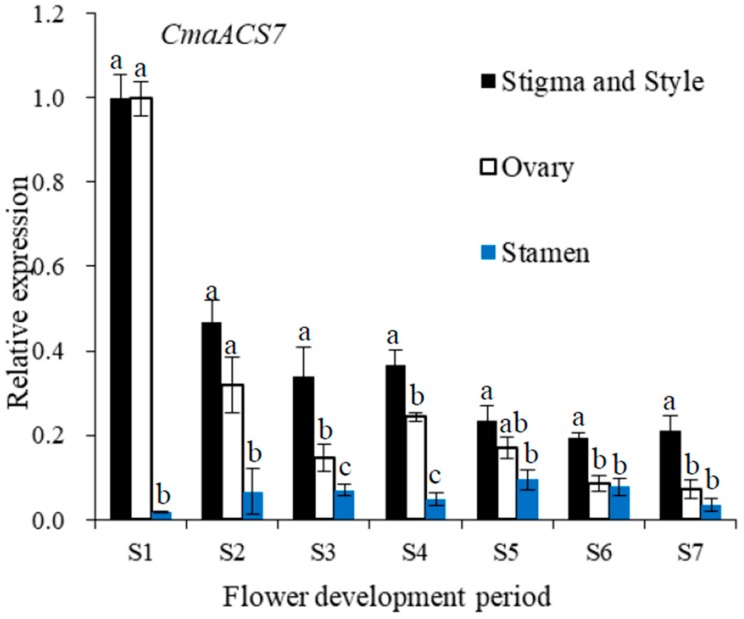
: Sex expression is a complex process, and in-depth knowledge of its mechanism in pumpkin is important. In this study, young shoot apices at the one-true-leaf stage and 10-leaf stage in Cucurbita maxima trimonoecious line '2013-12' and subandroecious line '9-6' were collected as materials, and transcriptome sequencing was performed using an Illumina HiSeqTM 2000 System. 496 up-regulated genes and 375 down-regulated genes were identified between shoot apices containing mostly male flower buds and only female flower buds. Based on gene ontology (GO) and Kyoto Encyclopedia of Genes and Genomes (KEGG) analysis, the differentially expressed genes were mainly enriched in the ethylene and auxin synthesis and signal transduction pathways. In addition, shoot apices at the 4-leaf stage were treated with the ethylene-releasing agent 2-chloroethylphosphonic acid (Ethrel), aminoethoxyvinyl glycine (AVG), AgNO3 and indoleacetic acid (IAA). The number of female flowers up to node 20 on the main stem of '2013-12' increased significantly after Ethrel and IAA treatment and decreased significantly after AVG and AgNO3 treatment. The female flowers in '9-6' showed slight changes after treatment with the exogenous chemicals. The expression of key genes in ethylene synthesis and signal transduction (CmaACS7, CmaACO1, CmaETR1 and CmaEIN3) was determined using quantitative RT-PCR, and the expression of these four genes was positively correlated with the number of female flowers in '2013-12'. The variations in gene expression, especially that of CmaACS7, after chemical treatment were small in '9-6'. From stage 1 (S1) to stage 7 (S7) of flower development, the expression of CmaACS7 in the stamen was much lower than that in the ovary, stigma and style. These transcriptome data and chemical treatment results indicated that IAA might affect pumpkin sex expression by inducing CmaACS7 expression and indirectly affecting ethylene production, and the ethylene synthesis and signal transduction pathways play crucial roles in pumpkin flower sex expression. A possible reason for the differences in sex expression between pumpkin lines '2013-12' and '9-6' was proposed based on the key gene expression. Overall, these transcriptome data and chemical treatment results suggest important roles for ethylene in pumpkin sex expression.
Keywords: Cucurbita maxima; chemical treatment; ethylene signal synthesis and transduction; floral sex expression; transcriptome sequencing.
Conflict of interest statement
The authors declare that the research was conducted in the absence of any commercial or financial relationships that could be construed as a potential conflict of interest.
Figures


Similar articles
-
Genome-Wide Identification and Characterization of Members of the ACS Gene Family in Cucurbita maxima and Their Transcriptional Responses to the Specific Treatments.Int J Mol Sci. 2022 Jul 30;23(15):8476. doi: 10.3390/ijms23158476. Int J Mol Sci. 2022. PMID: 35955610 Free PMC article.
-
The calcium-dependent protein kinase CmaCPK4 regulates sex determination in pumpkin (Cucurbita maxima D.).Plant Physiol. 2025 Feb 7;197(2):kiae666. doi: 10.1093/plphys/kiae666. Plant Physiol. 2025. PMID: 39700433
-
Stamen-derived bioactive gibberellin is essential for male flower development of Cucurbita maxima L.J Exp Bot. 2012 Apr;63(7):2681-91. doi: 10.1093/jxb/err448. Epub 2012 Jan 20. J Exp Bot. 2012. PMID: 22268154 Free PMC article.
-
Flower opening and closure: an update.J Exp Bot. 2014 Nov;65(20):5749-57. doi: 10.1093/jxb/eru327. Epub 2014 Aug 18. J Exp Bot. 2014. PMID: 25135521 Review.
-
Flower senescence: some molecular aspects.Planta. 2014 Feb;239(2):277-97. doi: 10.1007/s00425-013-1984-z. Epub 2013 Nov 1. Planta. 2014. PMID: 24178586 Review.
Cited by
-
Identification of Key Genes during Ethylene-Induced Adventitious Root Development in Cucumber (Cucumis sativus L.).Int J Mol Sci. 2022 Oct 26;23(21):12981. doi: 10.3390/ijms232112981. Int J Mol Sci. 2022. PMID: 36361778 Free PMC article.
-
Identification of Fruit-Associated QTLs in Winter Squash (Cucurbita maxima Duchesne) Using Recombinant Inbred Lines.Genes (Basel). 2020 Apr 14;11(4):419. doi: 10.3390/genes11040419. Genes (Basel). 2020. PMID: 32295204 Free PMC article.
-
Fine mapping and identification of CqMYB62 as the subgynoecy gene in chieh-qua (Benincasa hispida Cogn. var. Chieh-qua How).Theor Appl Genet. 2025 Apr 9;138(5):96. doi: 10.1007/s00122-025-04872-5. Theor Appl Genet. 2025. PMID: 40204945
-
Salt Stress Leads to Morphological and Transcriptional Changes in Roots of Pumpkins (Cucurbita spp.).Plants (Basel). 2025 May 30;14(11):1674. doi: 10.3390/plants14111674. Plants (Basel). 2025. PMID: 40508347 Free PMC article.
-
Targeted Metabolites and Transcriptome Analysis Uncover the Putative Role of Auxin in Floral Sex Determination in Litchi chinensis Sonn.Plants (Basel). 2024 Sep 16;13(18):2592. doi: 10.3390/plants13182592. Plants (Basel). 2024. PMID: 39339567 Free PMC article.
References
-
- Ekaterina P., Holly A.L., Sue A.H., Rebecca G. Effect of modified endogenous ethylene production on sex expression, bisexual flower development and fruit production in melon (Cucumis melo L.) Sex. Plant Reprod. 2005;18:131–142.
-
- Li Z., Huang S., Liu S., Pan J., Zhang Z., Tao Q., Shi Q., Jia Z., Zhang W., Chen H., et al. Molecular isolation of the M gene suggests that a conserved-residue conversion induces the formation of bisexual flowers in cucumber plants. Genetics. 2009;182:1381–1385. doi: 10.1534/genetics.109.104737. - DOI - PMC - PubMed
-
- Boualem A., Troadec C., Camps C., Lemhemdi A., Morin H., Sari M., Fraenkel-Zagouri R., Kovalski I., Dogimont C., Perl-Treves R., et al. A cucurbit androecygene reveals how unisexual flowers develop and dioecy emerges. Plant Genetics. 2015;350:688–691. - PubMed
MeSH terms
Substances
Grants and funding
LinkOut - more resources
Full Text Sources
Molecular Biology Databases
