. 2019 Jun 29;12(13):2101.
doi: 10.3390/ma12132101.

Zinc Uptake, Photosynthetic Efficiency and Oxidative Stress in the Seagrass Cymodocea nodosa Exposed to ZnO Nanoparticles

Affiliations

Zinc Uptake, Photosynthetic Efficiency and Oxidative Stress in the Seagrass Cymodocea nodosa Exposed to ZnO Nanoparticles

Paraskevi Malea et al. Materials (Basel). .

Abstract

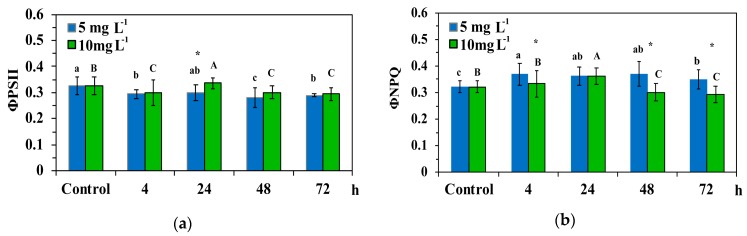
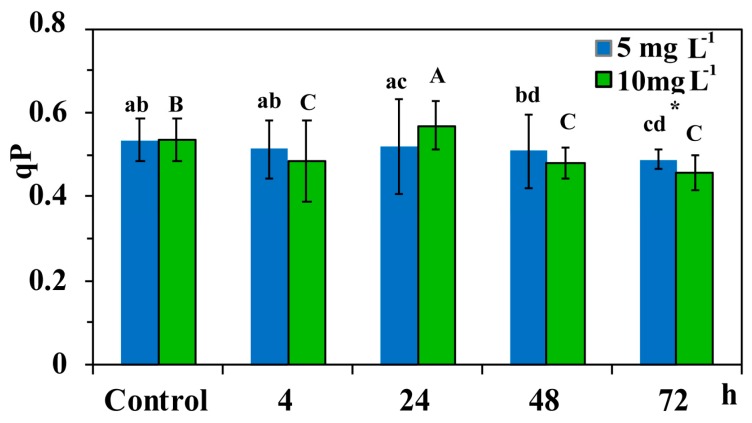
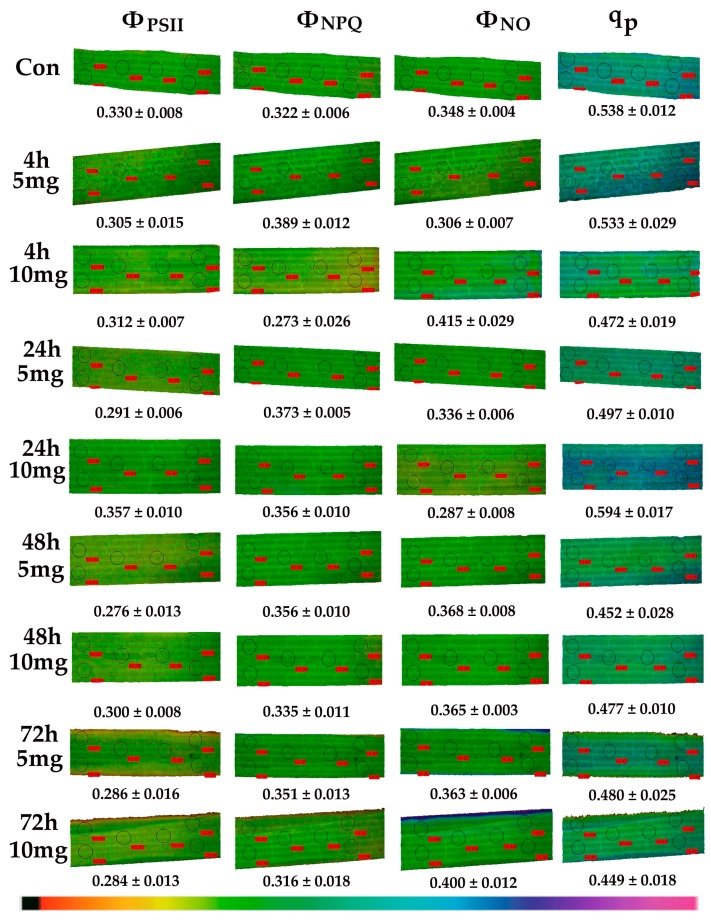
We characterized zinc oxide nanoparticles (ZnO NPs) by dynamic light scattering (DLS) measurements, and transmission electron microscopy (TEM), while we evaluated photosystem II (PSII) responses, Zn uptake kinetics, and hydrogen peroxide (H2O2) accumulation, in C. nodosa exposed to 5 mg L-1 and 10 mg L-1 ZnO NPs for 4 h, 12 h, 24 h, 48 h and 72 h. Four h after exposure to 10 mg L-1 ZnO NPs, we noticed a disturbance of PSII functioning that became more severe after 12 h. However, after a 24 h exposure to 10 mg L-1 ZnO NPs, we observed a hormetic response, with both time and dose as the basal stress levels needed for induction of the adaptive response. This was achieved through the reduced plastoquinone (PQ) pool, at a 12 h exposure, which mediated the generation of chloroplastic H2O2; acting as a fast acclimation signaling molecule. Nevertheless, longer treatment (48 h and 72 h) resulted in decreasing the photoprotective mechanism to dissipate excess energy as heat (NPQ) and increasing the quantum yield of non-regulated energy loss (ΦNO). This increased the formation of singlet oxygen (1O2), and decreased the fraction of open reaction centers, mostly after a 72-h exposure at 10 mg L-1 ZnO NPs due to increased Zn uptake compared to 5 mg L-1.

Keywords: adaptive response; hormetic response; hydrogen peroxide; marine angiosperms; non-photochemical quenching; photoprotective mechanism; plastoquinone pool; reactive oxygen species (ROS); redox state; zinc oxide nanoparticles.


Conflict of interest statement

The authors declare no conflict of interest.

Figures

Figure 1
Figure 1
Transmission electron microscope (TEM) images of zinc oxide nanoparticles (ZnO NPs) stock solution (50 mg L−1).
Figure 2
Figure 2
Distribution pattern of ZnO NPs from TEM micrographs.
Figure 3
Figure 3
Size distribution by intensity of 5 mg L−1 ZnO NPs (a); and 10 mg L−1 ZnO NPs (b). Different colours indicate the replications.
Figure 4
Figure 4
Kinetics of zinc uptake (μg g−1 dry weight) in C. nodosa leaf blades at 5 mg L−1 and 10 mg L−1 ZnO NPs ± SD (n = 3); dashed and bold lines are the uptake kinetics calculated using Michaelis-Menten equation.
Figure 5
Figure 5
The quantum efficiency of PSII photochemistry (ΦPSΙΙ) (a); and the quantum yield of regulated non-photochemical energy loss as heat (ΦNPQ) (b), in control leaf blades of C. nodosa and in leaf blades exposed to 5 mg L−1 and 10 mg L−1 ZnO NPs for 4 h, 24 h, 48 h and 72 h. Columns with the same letter (lower case for 5 mg L−1 ZnO NPs and capitals for 10 mg L−1 ZnO NPs) are not statistically different (p < 0.05). An asterisk represents a significantly different mean of the same time treatment between 5 and 10 mg L−1 ZnO NPs (p < 0.05). Bars in columns represent standard deviation.
Figure 6
Figure 6
The quantum yield of non-regulated energy dissipated in PSII (non-regulated heat dissipation, a loss process due to PSII inactivity) (ΦNO) in control leaf blades of C. nodosa (Cymodocea nodosa) and in leaf blades exposed to 5 mg L−1 and 10 mg L−1 ZnO NPs for 4 h, 24 h, 48 h and 72 h. Symbol explanations as in Figure 5.
Figure 7
Figure 7
The relative electron transport rate of PSII (ETR) (a); and the non-photochemical quenching (NPQ) (b), in control leaf blades of C. nodosa and in leaf blades exposed to 5 mg L−1 and 10 mg L−1 ZnO NPs for 4 h, 24 h, 48 h and 72 h. Symbol explanations as in Figure 5.
Figure 8
Figure 8
The photochemical quenching (qp) in control leaf blades of C. nodosa and in leaf blades exposed to 5 mg L−1 and 10 mg L−1 ZnO NPs for 4 h, 24 h, 48 h and 72 h. Symbol explanations as in Figure 5.
Figure 9
Figure 9
Representative chlorophyll fluorescence images at 200 μmol photons m−2 s−1 actinic light of ΦPSΙΙ, ΦNPQ, ΦNO, and qp; of C. nodosa control leaf blades and leaf blades exposed to 5 mg L1 and 10 mg L1 ZnO NPs for 4 h, 24 h, 48 h and 72 h. The colour code depicted at the bottom of the images ranges from black (pixel values 0.0) to purple (1.0). The six areas of interest are shown. Average values are presented for each photosynthetic parameter.
Figure 10
Figure 10
Representative chlorophyll fluorescence images after 5 min illumination at 200 μmol photons m−2 s−1 actinic light of ΦPSΙΙ, ΦNPQ, ΦNO, and qp of C. nodosa leaf blades exposed to 10 mg L1 ZnO NPs for 12 h. The colour code depicted at the bottom of the images ranges from 0.0 to 1.0. The average values are presented for each photosynthetic parameter (a). Below is the representative pattern of H2O2 production in a C. nodosa leaf blade exposed for 12 h to 10 mg L−1 ZnO NPs. Scale bare: 200 µm. Increased H2O2 content is indicated by light green colour (b).
Figure 10
Figure 10
Representative chlorophyll fluorescence images after 5 min illumination at 200 μmol photons m−2 s−1 actinic light of ΦPSΙΙ, ΦNPQ, ΦNO, and qp of C. nodosa leaf blades exposed to 10 mg L1 ZnO NPs for 12 h. The colour code depicted at the bottom of the images ranges from 0.0 to 1.0. The average values are presented for each photosynthetic parameter (a). Below is the representative pattern of H2O2 production in a C. nodosa leaf blade exposed for 12 h to 10 mg L−1 ZnO NPs. Scale bare: 200 µm. Increased H2O2 content is indicated by light green colour (b).
Figure 11
Figure 11
Representative patterns of H2O2 production in C. nodosa control leaf blades and after exposure to 5 mg L1 and 10 mg L1 ZnO NPs, as indicated by the fluorescence of H2DCF-DA. The H2O2 real-time generation in control leaf blade (a); after a 4-h exposure to 5 mg L1 (b); after a 4-h exposure to 10 mg L1 (c); after a 24-h exposure to 5 mg L1 (d); after a 24-h exposure to 10 mg L1 (e); after a 48-h exposure to 5 mg L1 (f); after a 48-h exposure to 10 mg L1 (g); after a 72-h exposure to 5 mg L1 (h); and after a 72-h exposure to 10 mg L1 (i). Scale bare: 200 µm. A higher H2O2 content is indicated by light green colour.

References

    1. Maynard A., Aitken R.J., Butz T., Colvin V., Donaldson K., Oberdörster G., Philbert M.A., Ryan J., Seaton A., Stone V., et al. Safe handling of nanotechnology. Nature. 2006;444:267–269. doi: 10.1038/444267a. - DOI - PubMed
    1. Chang Y.N., Zhang M., Xia L., Zhang J., Xing G. The toxic effects and mechanisms of CuO and ZnO nanoparticles. Materials. 2012;5:2850–2871. doi: 10.3390/ma5122850. - DOI
    1. Kołodziejczak-Radzimska A., Jesionowski T. Zinc oxide—From synthesis to application: A review. Materials. 2014;7:2833–2881. doi: 10.3390/ma7042833. - DOI - PMC - PubMed
    1. Hong J., Rico C., Zhao L., Adeleye A.S., Keller A.A., Peralta-Videa J.R., Gardea-Torresdey J.L. Toxic effects of copper-based nanoparticles or compounds to lettuce (Lactuca sativa) and alfalfa (Medicago sativa) Environ. Sci. Proc. Impacts. 2015;17:177–185. doi: 10.1039/C4EM00551A. - DOI - PMC - PubMed
    1. Moustakas M., Malea P., Haritonidou K., Sperdouli I. Copper bioaccumulation, photosystem II functioning and oxidative stress in the seagrass Cymodocea nodosa exposed to copper oxide nanoparticles. Environ. Sci. Pollut. Res. 2017;24:16007–16018. doi: 10.1007/s11356-017-9174-3. - DOI - PubMed

LinkOut - more resources