Review
. 2019 Jun 30;9(7):952.
doi: 10.3390/nano9070952.

Electrospun Polyvinylidene Fluoride-Based Fibrous Scaffolds with Piezoelectric Characteristics for Bone and Neural Tissue Engineering

Affiliations
Review

Electrospun Polyvinylidene Fluoride-Based Fibrous Scaffolds with Piezoelectric Characteristics for Bone and Neural Tissue Engineering

Yuchao Li et al. Nanomaterials (Basel). .

Abstract

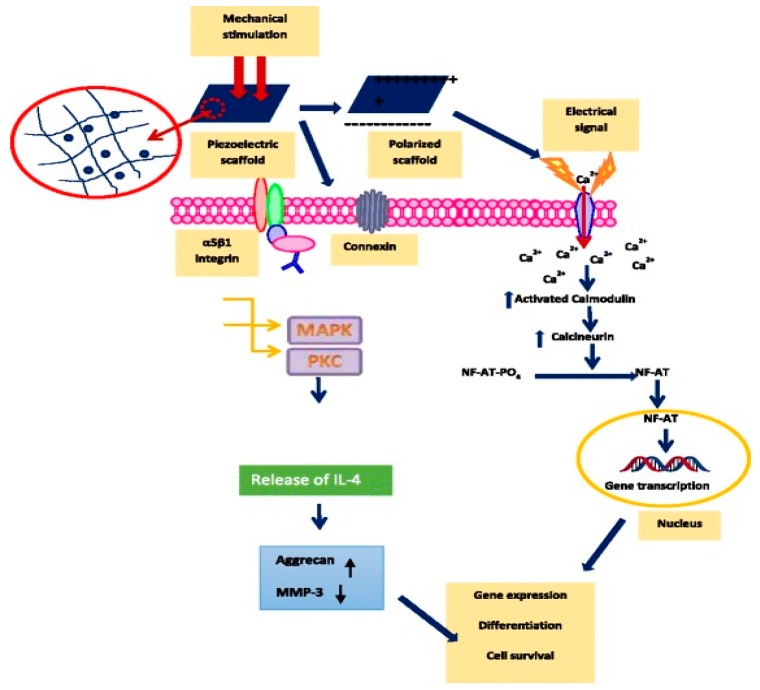
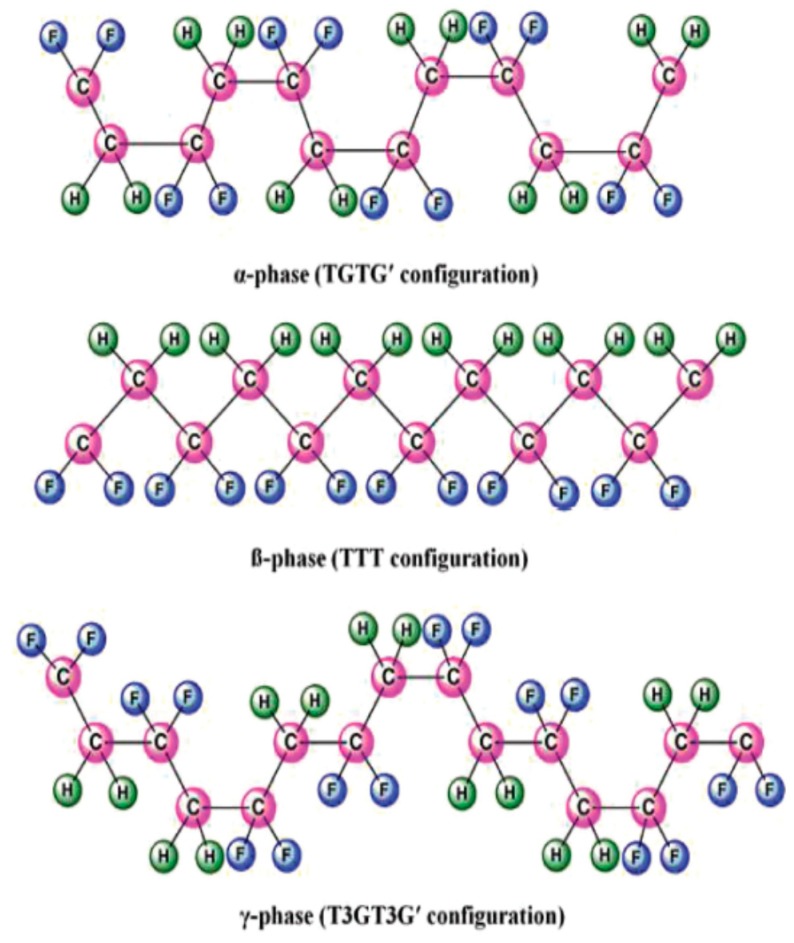
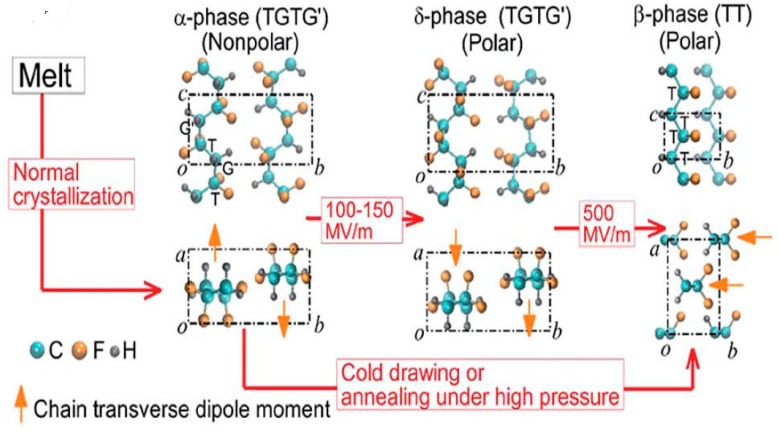
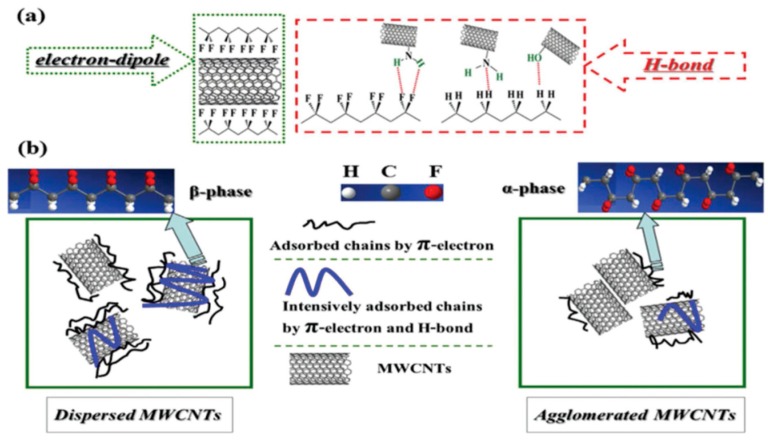
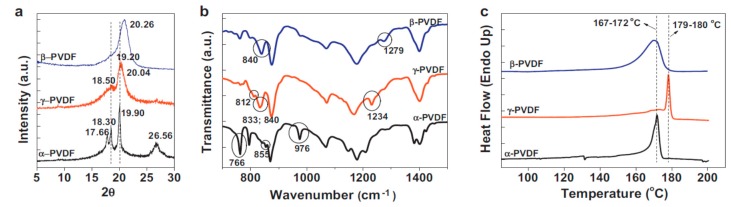
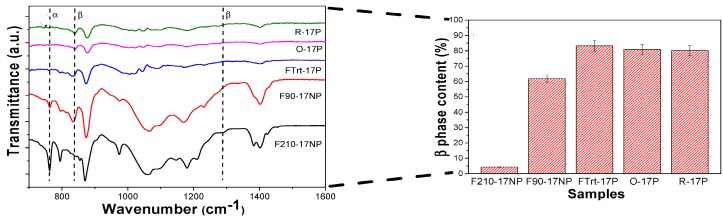
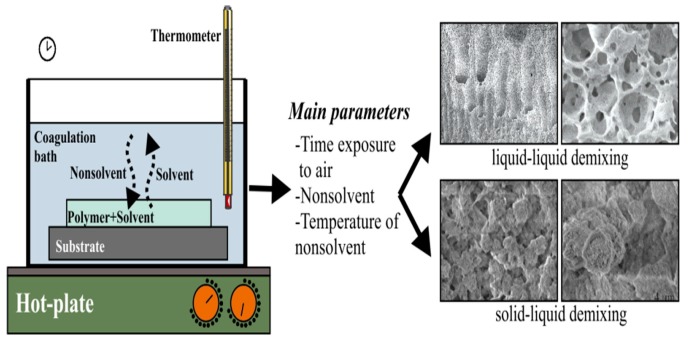
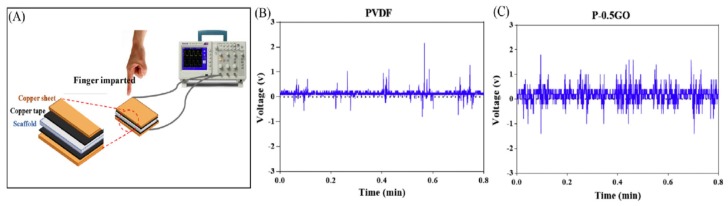
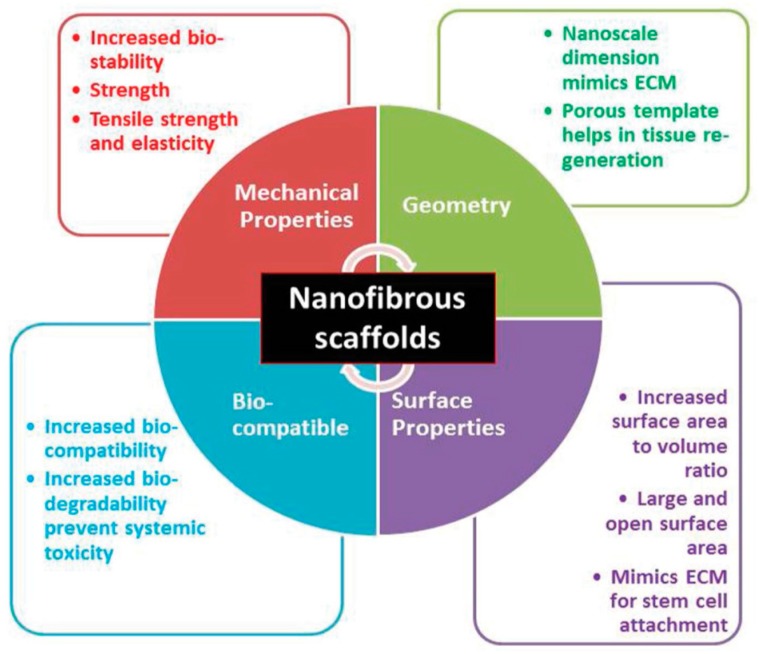
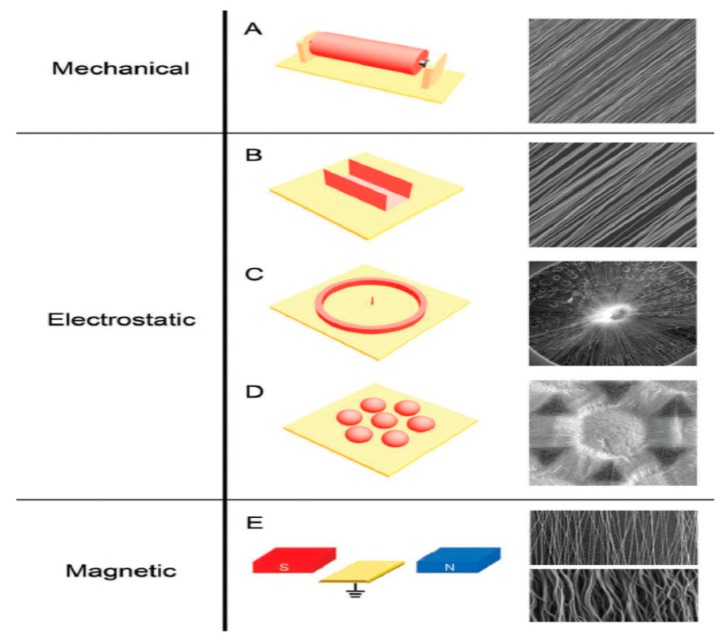
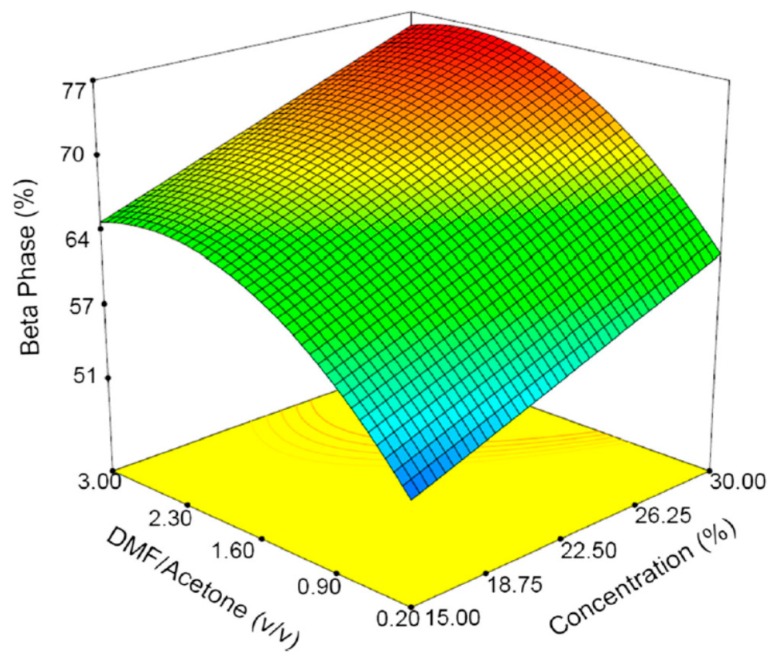
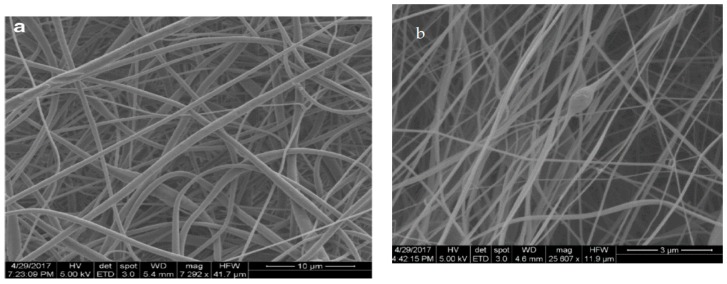
Polyvinylidene fluoride (PVDF) and polyvinylidene fluoride-trifluoroethylene (P(VDF-TrFE) with excellent piezoelectricity and good biocompatibility are attractive materials for making functional scaffolds for bone and neural tissue engineering applications. Electrospun PVDF and P(VDF-TrFE) scaffolds can produce electrical charges during mechanical deformation, which can provide necessary stimulation for repairing bone defects and damaged nerve cells. As such, these fibrous mats promote the adhesion, proliferation and differentiation of bone and neural cells on their surfaces. Furthermore, aligned PVDF and P(VDF-TrFE) fibrous mats can enhance neurite growth along the fiber orientation direction. These beneficial effects derive from the formation of electroactive, polar β-phase having piezoelectric properties. Polar β-phase can be induced in the PVDF fibers as a result of the polymer jet stretching and electrical poling during electrospinning. Moreover, the incorporation of TrFE monomer into PVDF can stabilize the β-phase without mechanical stretching or electrical poling. The main drawbacks of electrospinning process for making piezoelectric PVDF-based scaffolds are their small pore sizes and the use of highly toxic organic solvents. The small pore sizes prevent the infiltration of bone and neuronal cells into the scaffolds, leading to the formation of a single cell layer on the scaffold surfaces. Accordingly, modified electrospinning methods such as melt-electrospinning and near-field electrospinning have been explored by the researchers to tackle this issue. This article reviews recent development strategies, achievements and major challenges of electrospun PVDF and P(VDF-TrFE) scaffolds for tissue engineering applications.

Keywords: aligned fiber; electrospinning; neuron; osteoblast; piezoelectricity; polyvinylidene fluoride; polyvinylidene fluoride-trifluoroethylene; scaffold; stem cell; tissue engineering.


Conflict of interest statement

The authors declare no conflict of interest.

Figures

Figure 1
Figure 1
Schematic diagram showing the activation of Ca2+ signal transduction pathway and other miscellaneous pathways in response to the electrical and mechanical stimulations. Ca2+ is an important signal transducer.
Figure 2
Figure 2
Primary polymorphic crystalline phases of PVDF. Reproduced with permission from [50], published by Wiley-VCH, 2019.
Figure 3
Figure 3
Electric field-induced phase transitions of PVDF. Electric poling aligns the dipoles along the electric field by applying a very high voltage. The transverse dipole moment of each polymer chain is shown using an orange arrow that points from the negatively charged fluorine atoms to the positively charged hydrogen atoms. T-trans; G-gauche. Reproduced with permission from [55], published by AIP Publishing, 2016.
Figure 4
Figure 4
Schematic showing the effect of MWCNTs on the β-phase formation in PVDF: (a) Hydrogen bonding between functionalized MWCNTs and PVDF chains; (b) the adsorbed chains of PVDF on the surface of MWCNTs influenced by the dispersion of MWCNTs. Reproduced with permission from [96], published by Elsevier, 2014.
Figure 5
Figure 5
(a) XRD patterns, (b) FTIR spectra, and (c) DSC curves of the polymorphs of PVDF. Reproduced with permission from [2], published by Elsevier, 2014.
Figure 6
Figure 6
FTIR spectra of nonporous PVDF/silica (17 nm) nanocomposite films processed at 90 °C (F90-17NP) and at 210 °C (F210-17NP), porous nanocomposite film processed at room temperature (FTrt-17P), electrospun nanocomposite mats with oriented (O-17P) and random (R-17P) fibers. Right panel displays the β-phase content of these nanocomposites.
Figure 7
Figure 7
Porous scaffolds produced by non-solvent induced phase separation (NIPS). Reproduced with permission from [112], published by Elsevier, 2015.
Figure 8
Figure 8
(A) Schematic of piezoelectricity measurement. Output voltage generation from representative (B) PVDF and (C) PVDF/0.5 wt% GO scaffolds. Reproduced with permission from [81], published by Elsevier, 2019.
Figure 9
Figure 9
Schematic representation of the required properties of nanofibrous scaffolds including geometry, mechanical competence, biocompatibility and surface behavior.
Figure 10
Figure 10
Schematics of electrospinning methods to direct fiber orientation by means of mechanical rotation of mandrel (A), electrostatic forces through the use of a metallic staple (B), a metallic ring (C), and an array of metallic beads (D), as well as magnetic forces through the use of a pair of permanent magnets (E). The yellow plates are grounded conductive electrodes. Scanning electron micrographs in the right panel show the morphologies of aligned nanofibers depositing at the target via different methods. Reproduced with permission from [120], published by Wiley-VCH, 2012. Reproduced with permission from [121], published by American Chemical Society, 2010.
Figure 11
Figure 11
Three-dimensional plots of beta phase content vs. PVDF concentration and DMF/acetone ratio. Reproduced with permission from [124], published by Springer, 2018.
Figure 12
Figure 12
Scanning electron micrographs of electrospun nanofibers with a PVDF concentration of 25% and (a) DMF/acetone ratio of 1, and (b) DMF/acetone ratio of 3. Reproduced with permission from [124], published by Springer, 2018.
Figure 13
Figure 13
Effects of (a) applied voltage and (b) spinning distance on the fiber diameters, β-phase contents and electrical outputs of PVDF nanofiber mats (PVDF concentration 20%; nanofiber mat thickness 100 µm). Reproduced with permission from [129], published by Royal Society of Chemistry, 2015.
Figure 14
Figure 14
Schematic diagram showing electrospinning setup for forming uniaxially aligned nanofibers. (A) A collector with two pieces of conductive silicon stripes separated by a gap. (B) Electric field strength around the needle and the collector. The arrows denote the direction of the electrostatic field lines. Reproduced with permission from [135], published by American Chemical Society, 2003.
Figure 15
Figure 15
(A) Randomly oriented PVDF nanofibers deposited on a stationary metal plate covered with aluminum foil. (B) Aligned PVDF nanofibers deposited at the gap between two metallic bars of a collector.
Figure 16
Figure 16
(a) X-ray diffraction (XRD) patterns of spin-coated P(VDF-TrFE) film and electrospun P(VDF-TrFE) nanofibers. (b) XRD patterns of the P(VDF-TrFE) nanofibers before and after annealing at 130 °C and 140 °C for 2 h. (c) FTIR spectra of the P(VDF-TrFE) nanofibers before and after annealing at 140 °C for 2 h.
Figure 17
Figure 17
Piezoresponse force microscopy: (a) amplitude and (b) phase images of a single P(VDF-TrFE) nanofiber. (c) PFM amplitude and (d) PFM phase of the P(VDF-TrFE) nanofiber as functions of DC bias for two cycles, displaying good repeatability for forward and reverse scans.
Figure 18
Figure 18
(a) Measured d33 as a function of fiber diameter from PFM. The red dashed line corresponds to the measured d33 of a 80 µm thick film, and the black dashed line is the d33 of bulk P(VDF-TrFE). Thick P(VDF-TrFE) film (80 µm) was made by drop-casting and employed as a reference. (b) Electroactive phase content determined by FTIR as a function of mean fiber diameter. The black dashed line represents the measured electroactive active content of a thick film prepared by drop-casting. Reproduced with permission from [152], published by Royal Society of Chemistry, 2016.
Figure 19
Figure 19
SEM images of PVDF fibrous mats prepared by melt-electrospinning at various applied voltages and collector rotating speeds. The laser output power and the polymer feed rate were fixed at 53 W and 1 mm min−1, respectively. Reproduced with permission from [160], published by Royal Society of Chemistry, 2017.
Figure 20
Figure 20
(a) Relative ALP, (b) collagen I, and (c) osteopontin gene expressions of rBMSCs cultured on PPTi and NPTi samples for 14 days (n = 3). * p < 0.05, ** p < 0.01 compared with NPTi.
Figure 21
Figure 21
Relative alkaline phosphatase activity of hASCs on different PVDF films and tissue culture polystyrene (TCPS) control. The ALP activity was normalized against the DNA content of the cells. Reproduced with permission from [171], published by Wiley, 2015.
Figure 22
Figure 22
A simple set-up of flexible-bottomed culture plate together with an attached speaker for inducing mechanical vibration.
Figure 23
Figure 23
(a) Fluorescence micrographs of MC3T3 cells cultured on fibrous A-NFM, P80-NG, and P100-NG mats for 1, 3, and 5 days. The scale bar is 100 µm. (b) Proliferation of MC3T3 cells on P80-NG, P100-NG, and A-NFM mats. All data represent the mean standard deviation (n = 3, * p < 0.05).
Figure 24
Figure 24
(a) Cell proliferation based on Alamar Blue assay of MG63 osteoblasts cultured on PVDF(+), and PVDF(−) scaffolds, as well as tissue culture polystyrene (TCPC) control for 1, 3 and 7 days. (b) Number of cells/mm2 growing on TCPS control, PVDF(+) and PVDF(−) fibers after cultivation of MG63 cells for 1, 3 and 7 days. * Significant difference between PVDF(+) and PVDF(−) samples determined with Tukey test (p < 0.05). Reproduced with permission from [10], published by American Chemical Society, 2019.
Figure 25
Figure 25
SEM images showing the formation of collagen fibrils on MG63 osteoblasts cultured on electrospun (a) PVDF(+) and (b) PVDF(−) scaffolds for three days. Accumulation of collagen fibrils and calcium phosphate nodules on MG63 osteoblasts cultured on (c) PVDF(+) and (d) PVDF(−) scaffolds for seven days. Red arrows indicate collagen fibrils present on cell surfaces. Reproduced with permission from [10], Copyright American Chemical Society, 2019.
Figure 26
Figure 26
(a) Photographs showing the dimension of a poled P(VDF-TrFE) scaffold before implantation (left), the process of implanting piezoelectric scaffold into subcutaneous thigh region of a SD rat (upper right), and the implanting site after suturing (lower right). (b) Current and (c) voltage outputs of electrospun P(VDF-TrFE) nanofibrous scaffold after implantation under pulling. Reproduced with permission from [180], published by Elsevier, 2018.
Figure 26
Figure 26
(a) Photographs showing the dimension of a poled P(VDF-TrFE) scaffold before implantation (left), the process of implanting piezoelectric scaffold into subcutaneous thigh region of a SD rat (upper right), and the implanting site after suturing (lower right). (b) Current and (c) voltage outputs of electrospun P(VDF-TrFE) nanofibrous scaffold after implantation under pulling. Reproduced with permission from [180], published by Elsevier, 2018.
Figure 27
Figure 27
(a) Schematic showing the fabrication of electrospun P(VDF-TrFE) and P(VDF-TrFE)/ZnO scaffolds, hMSC seeding, and subsequent implantation into Wistar rats. (b) Histological examinations of fibrous scaffolds with or without pre-seeded hMSCs after implantation in rats for 7 days, and stained with Masson’s trichrome. Blood vessels developed in connective tissue adjacent to scaffolds as distinguished by yellow dashed lines, and collagen was found in all scaffolds (green). P(VDF-TrFE)/ZnO-1 and P(VDF-TrFE)/ZnO-2 contained 1 wt% and 2 wt% ZnO, respectively. Reproduced with permission from [177], published by Springer, 2017.
Figure 27
Figure 27
(a) Schematic showing the fabrication of electrospun P(VDF-TrFE) and P(VDF-TrFE)/ZnO scaffolds, hMSC seeding, and subsequent implantation into Wistar rats. (b) Histological examinations of fibrous scaffolds with or without pre-seeded hMSCs after implantation in rats for 7 days, and stained with Masson’s trichrome. Blood vessels developed in connective tissue adjacent to scaffolds as distinguished by yellow dashed lines, and collagen was found in all scaffolds (green). P(VDF-TrFE)/ZnO-1 and P(VDF-TrFE)/ZnO-2 contained 1 wt% and 2 wt% ZnO, respectively. Reproduced with permission from [177], published by Springer, 2017.
Figure 28
Figure 28
(a) Confocal fluorescence microscopic images of SH-SY5Y cells on solvent-cast P(VDF-TrFE) and P(VDF-TrFE)/BTNP films, as well as Ibidi (control) at the end of differentiation period of 6 days. SH-SY5Y cells were treated with or without ultrasound stimulation (US+ or US−). β3-tubulin was stained in green, nuclei in blue. (b) Percentages of β3-tubulin positive cells. (c) Neurite lengths are expressed as median values ± confidence interval at 95%. * p < 0.05. Reproduced with permission from [182], published by Wiley-VCH, 2016.
Figure 29
Figure 29
(A) Immunofluorescent staining for β3-tubulin (red) and GFAP (blue), and (B) mean percentage of cells expressing β3-tubulin and GFAP upon NSCs differentiation. n = 3–5. Reproduced with permission from [15], published by Wiley, 2017.
Figure 30
Figure 30
Scanning electron micrographs showing the morphologies of stem cell, neuronal cell, and glial cell cultivated on electrospun PVDF scaffolds with different fiber orientations. Reproduced with permission from [15], published by Wiley, 2017.
Figure 31
Figure 31
Confocal fluorescent images of DRG stained with phalloidin (actin) on micron-sized, annealed (a) random and (b) aligned P(VDF-TrFE) mats. Scale bar: 300 µm. (c) Average neurite length of DRG neurons cultured on micron-sized (L) and nano-sized (S) P(VDF-TrFE) mats with random and aligned fibers under as-spun and annealed conditions. Mean neurite length cultured on nano-sized (S) PVDF mats with random and aligned fibers, and collagen control are also shown for comparison. * and ** denote statistically significant difference between the sample groups; p < 0.05. Reproduced with permission from [6], published by Elsevier, 2011.
Figure 31
Figure 31
Confocal fluorescent images of DRG stained with phalloidin (actin) on micron-sized, annealed (a) random and (b) aligned P(VDF-TrFE) mats. Scale bar: 300 µm. (c) Average neurite length of DRG neurons cultured on micron-sized (L) and nano-sized (S) P(VDF-TrFE) mats with random and aligned fibers under as-spun and annealed conditions. Mean neurite length cultured on nano-sized (S) PVDF mats with random and aligned fibers, and collagen control are also shown for comparison. * and ** denote statistically significant difference between the sample groups; p < 0.05. Reproduced with permission from [6], published by Elsevier, 2011.
Figure 32
Figure 32
(a) SC number on aligned PVDF-TrFE fibrous scaffolds with or without Matrigel coating. Cell number on Matrigel coated scaffolds was significantly higher than on uncoated scaffolds at all time points (* p < 0.05). (b) Average neurite extension of DRGs cultured on uncoated and Matrigel coated PVDF-TrFE scaffolds. Neurite extension on Matrigel coated scaffolds was significantly higher than uncoated scaffolds (* p < 0.05). Reproduced from [194], published by Frontiers, 2018.

References

    1. Acosta M., Novak N., Patel S., Vaish R., Koruza J., Rossetti R.A., Rodel J. BaTiO3-based piezoelectrics: Fundamentals, current status, and perspectives. Appl. Phys. Rev. 2017;4:041305. doi: 10.1063/1.4990046. - DOI
    1. Martins P., Lopes A.C., Lanceros-Méndez S. Electroactive phases of poly(vinylidene fluoride): Determination, processing and applications. Prog. Polym. Sci. 2014;39:683–706. doi: 10.1016/j.progpolymsci.2013.07.006. - DOI
    1. Ribeiro C., Sencadas V., Correia D.M., Lanceros-Méndez S. Piezoelectric polymers as biomaterials for tissue engineering applications. Colloids Surf. B Biointerfaces. 2015;136:46–55. doi: 10.1016/j.colsurfb.2015.08.043. - DOI - PubMed
    1. Cardoso V.F., Correia D.M., Ribeiro C., Fernandes M.M., Lanceros-Méndez S. Fluorinated polymers as smart materials for advanced biomedical applications. Polymers. 2018;10:161. doi: 10.3390/polym10020161. - DOI - PMC - PubMed
    1. Soulestin T., Ladmiral V., Dos Santos F.D., Ameduri B. Vinylidene fluoride- and trifluoroethylene-containing fluorinated electroactive copolymers. How does chemistry impact properties? Prog. Polym. Sci. 2017;72:16–60. doi: 10.1016/j.progpolymsci.2017.04.004. - DOI