. 2019 Jun 30;11(7):921.
doi: 10.3390/cancers11070921.

Comparative Transcriptomic Analysis of Temozolomide Resistant Primary GBM Stem-Like Cells and Recurrent GBM Identifies Up-Regulation of the Carbonic Anhydrase CA2 Gene as Resistance Factor

Affiliations

Comparative Transcriptomic Analysis of Temozolomide Resistant Primary GBM Stem-Like Cells and Recurrent GBM Identifies Up-Regulation of the Carbonic Anhydrase CA2 Gene as Resistance Factor

Ricarda Hannen et al. Cancers (Basel). .

Abstract

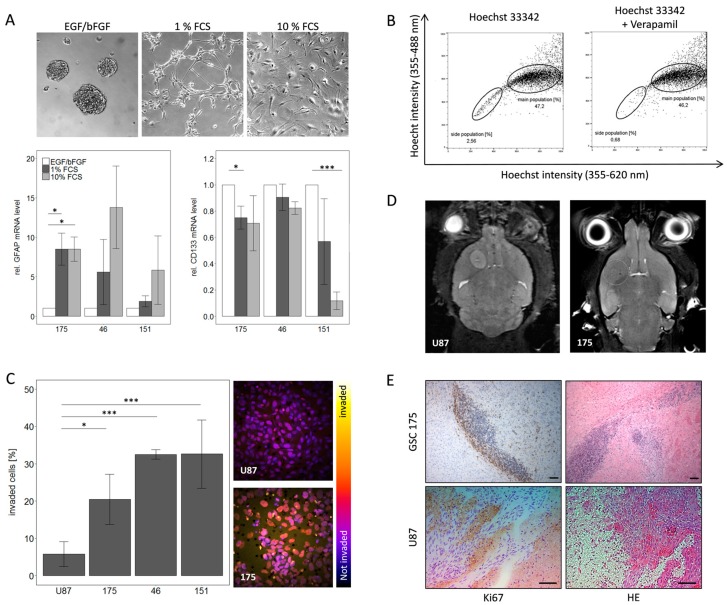
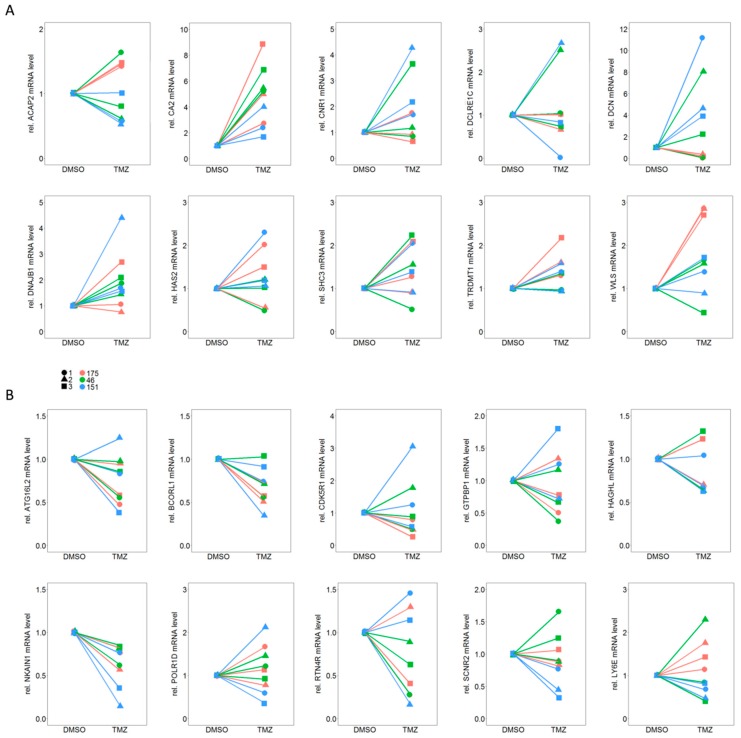
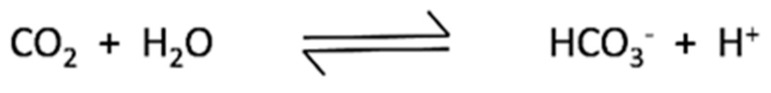
About 95% of patients with Glioblastoma (GBM) show tumor relapse, leaving them with limited therapeutic options as recurrent tumors are most often resistant to the first line chemotherapy standard Temozolomide (TMZ). To identify molecular pathways involved in TMZ resistance, primary GBM Stem-like Cells (GSCs) were isolated, characterized, and selected for TMZ resistance in vitro. Subsequently, RNA sequencing analysis was performed and revealed a total of 49 differentially expressed genes (|log2-fold change| > 0.5 and adjusted p-value < 0.1) in TMZ resistant stem-like cells compared to their matched DMSO control cells. Among up-regulated genes, we identified carbonic anhydrase 2 (CA2) as a candidate gene correlated with glioma malignancy and patient survival. Notably, we describe consistent up-regulation of CA2 not only in TMZ resistant GSCs on mRNA and protein level, but also in patient-matched clinical samples of first manifest and recurrent tumors. Co-treatment with the carbonic anhydrase inhibitor Acetazolamid (ACZ) sensitized cells to TMZ induced cell death. Cumulatively, our findings illustrate the potential of CA2 as a chemosensitizing target in recurrent GBM and provide a rationale for a therapy associated inhibition of CA2 to overcome TMZ induced chemoresistance.

Keywords: GBM Stem-like cells; GBM recurrence; acetazolamide; carbonic anhydrase 2; chemoresistance; glioblastoma; temozolomide; transcriptomics.


Conflict of interest statement

The authors declare no conflict of interest.

Figures

Figure A1
Figure A1
Principal Component Analysis (PCA) of the RNA Seq data for the three treatment conditions (CTR, DMSO, TMZ) for cells from all three patients (175, 46, 151).
Figure 1
Figure 1
Characterization of primary GBM stem-like cells regarding their stem cell phenotype and GBM specific features. (A) Differentiation of primary GSCs can be induced by FCS leading to a phenotypic change as well as alterations in gene expression for the stem cell marker CD133 and the differentiation marker GFAP. (B) Further validation of stem-like character was achieved by side population analysis which showed a specific population with a higher efflux of Hoechst 33342, this effect is due to higher activity of ABC transporters since it can be blocked with verapamil. (C) Invasiveness of GSCs is much higher compared to the established cell line U87 in vitro. (D) MRI analysis of mice and (E) HE and Ki67 staining of tumors derived from GSC 175 and U87 cells in vivo. Please note that Ki67 positive cells can be detected in the tissue surrounding the tumor mass after injection of GSC175 cells, but not after injection of U87 cells. Scale bar: 100 µm, respectively.
Figure 2
Figure 2
Dose-Response-Curves of TMZ resistant and DMSO control cells based on the viability measurement with CellTiter-Glo® 3D Cell Viability Assay (Promega). Please note that the X-axis scale has different dimensions, the half lethal dose is between 15 and 100-fold higher in cells that previously were continuously exposed to TMZ and thereby acquired resistance to TMZ. Significance is indicated for each concentration compared to the respective untreated cells with * p < 0.05; ** p < 0.01; *** p < 0.001.
Figure 3
Figure 3
Results of the RNA Sequencing analysis are demonstrated as (A) volcano plot of differential expression analysis results by DEseq2, plotting the log2(fold change) versus the –log10(adjusted p-value). 49 differentially expressed genes between TMZ resistant cell group and DMSO control cell group are exceeding the threshold set at adjusted p-value < 0.1 and |log2-fold change| > 0.5 (red dots). (B) Normalized enrichment scores (NES) derived from the gene set enrichment analysis (GSEA) and ranking of the genes according to fold-changes derived by DESeq2 analysis using the Hallmark gene sets. Only those gene sets displayed in turquoise are depleted in TMZ resistant cells with an adjusted p-value < 0.05. Positive NES values suggest an up-regulation of the respective set, whereas negative values indicate a down-regulation.
Figure 4
Figure 4
qPCR analysis for (A) 10 up-regulated and (B) 10 down-regulated genes out of the total of 49 genes which showed differential expression between TMZ resistant and their matched DMSO control cells. Please note that only for one gene from each set (A: CA2 and B: NKAIN1) the trend in regulation could be reproduced for all three independent experiments (1–3) and all three individual TMZ-DMSO pairs (175, 46, 151).
Figure 5
Figure 5
CA2 up-regulation correlates with TMZ resistance, not only in GSCs but also in patient matched samples from primary and recurrent GBMs. (A) CA2 was among the differentially expressed genes in RNA sequencing analysis which showed similar trends for all three TMZ-DMSO pairs. (B) Validation by qPCR analysis (n = 3). Significance levels were: * p < 0.05; ** p < 0.01 (C) Consistent with qPCR data, an up-regulation of CA2 in TMZ resistant cells compared to the DMSO control cells was observed by Western Blot, detailed information can be found in Figure S1. (D) qPCR analysis of patient matched primary and recurrent GBM tissue reinforces the impression that CA2 up-regulation is linked to TMZ resistance, since an up-regulation of CA2 was observed in recurrent tumor tissue compared to the respective primary tumor tissue. This effect was significant in 7 out of 8 pairs for n = 3 independent experiments. *** p < 0.001 (E) IHC for CA2 performed on FFPE samples from the same patients showed immunoreactive tumor cells as exemplified by pictures on the left. On the right quantification is visualized as the percentage of positively stained area in respect to the total area of the sections.
Figure 6
Figure 6
Co-treatment with the respective IC50 dosages of TMZ and 100 µM ACZ decreased viability significantly compared to treatment with TMZ alone. This effect is less pronounced for DMSO control cells shown on the left with the used IC50 values of 3 µM for 175, 7.5 µM for 46 and 2.5 µM for 151. For TMZ resistant cells IC50 values of 250 µM for 175, 150 µM for 46 and 250 µM for 151 were used. For reasons of clarity, significance was only indicated for the comparison between TMZ alone and TMZ in combination with ACZ. However, co-treatment as well as TMZ alone led to a significant reduction of viability compared to untreated cells, whereas ACZ alone had no significant impact. Treatment with equivalent amounts of DMSO led to a reduction in viability of less than 10% in comparison to untreated cells. Significance determined: * p < 0.05; ** p < 0.01.
Figure 7
Figure 7
Reaction catalyzed by Carbonic anhydrases.
Figure 8
Figure 8
Reaction scheme of TMZ activation.

References

    1. Thakkar J.P., Dolecek T.A., Horbinski C., Ostrom Q.T., Lightner D.D., Barnholtz-Sloan J.S., Villano J.L. Epidemiologic and molecular prognostic review of glioblastoma. Cancer Epidemiol. Biomarkers Prev. 2014;23:1985–1996. doi: 10.1158/1055-9965.EPI-14-0275. - DOI - PMC - PubMed
    1. Stupp R., Mason W.P., van den Bent M.J., Weller M., Fisher B., Taphoorn M.J.B., Belanger K., Brandes A.A., Marosi C., Bogdahn U., et al. Radiotherapy plus concomitant and adjuvant temozolomide for glioblastoma. N. Eng. J. Med. 2005;352:987–996. doi: 10.1056/NEJMoa043330. - DOI - PubMed
    1. Dey M., Ulasov I.V., Lesniak M.S. Virotherapy against malignant glioma stem cells. Cancer Lett. 2010;289:1–10. doi: 10.1016/j.canlet.2009.04.045. - DOI - PMC - PubMed
    1. Hochberg F.H., Pruitt A. Assumptions in the radiotherapy of glioblastoma. Neurology. 1980;30:907–911. doi: 10.1212/WNL.30.9.907. - DOI - PubMed
    1. Safa A.R., Saadatzadeh M.R., Cohen-Gadol A.A., Pollok K.E., Bijangi-Vishehsaraei K. Glioblastoma stem cells (GSCs) epigenetic plasticity and interconversion between differentiated non-GSCs and GSCs. Genes Dis. 2015;2:152–163. doi: 10.1016/j.gendis.2015.02.001. - DOI - PMC - PubMed

LinkOut - more resources