. 2019 Jun 30;11(7):1503.
doi: 10.3390/nu11071503.

Rice Porridge Containing Welsh Onion Root Water Extract Alleviates Osteoarthritis-Related Pain Behaviors, Glucose Levels, and Bone Metabolism in Osteoarthritis-Induced Ovariectomized Rats

Affiliations

Rice Porridge Containing Welsh Onion Root Water Extract Alleviates Osteoarthritis-Related Pain Behaviors, Glucose Levels, and Bone Metabolism in Osteoarthritis-Induced Ovariectomized Rats

Hye Jeong Yang et al. Nutrients. .

Abstract

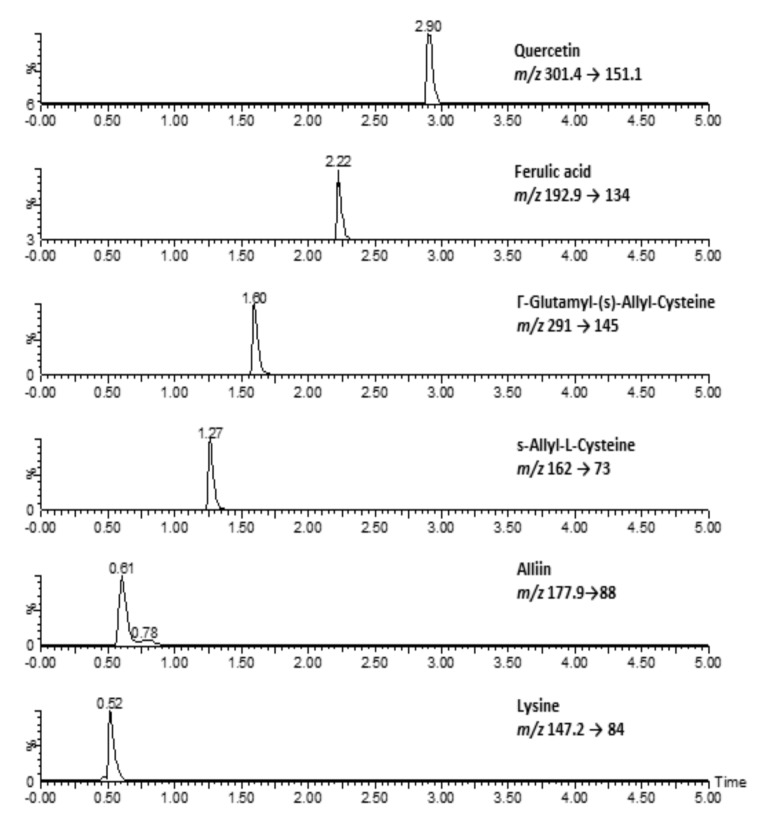
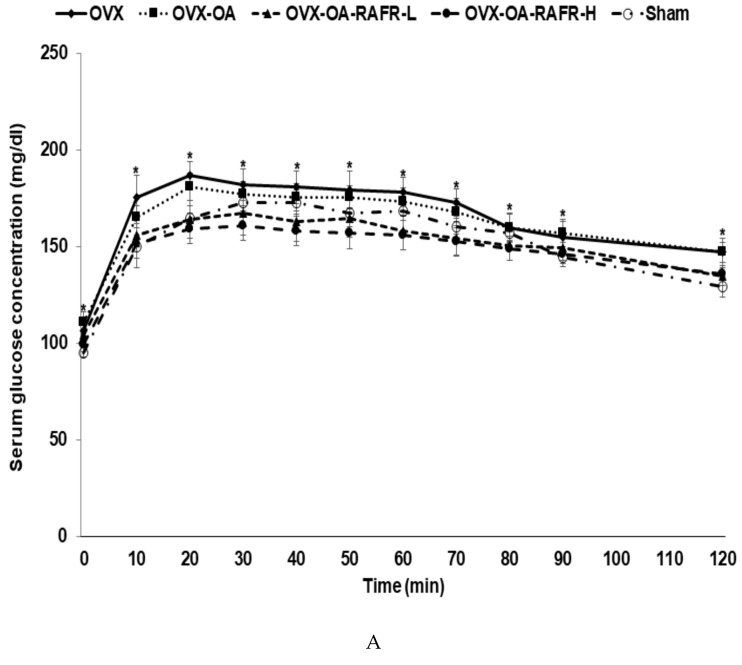
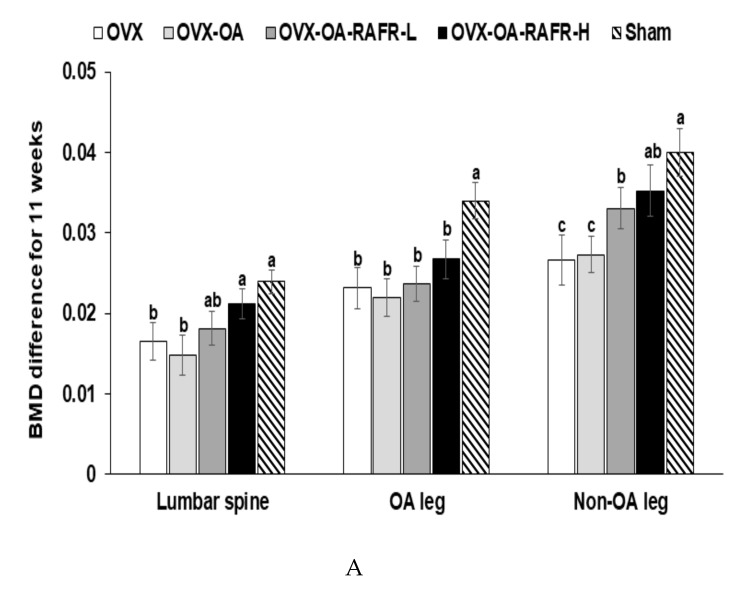
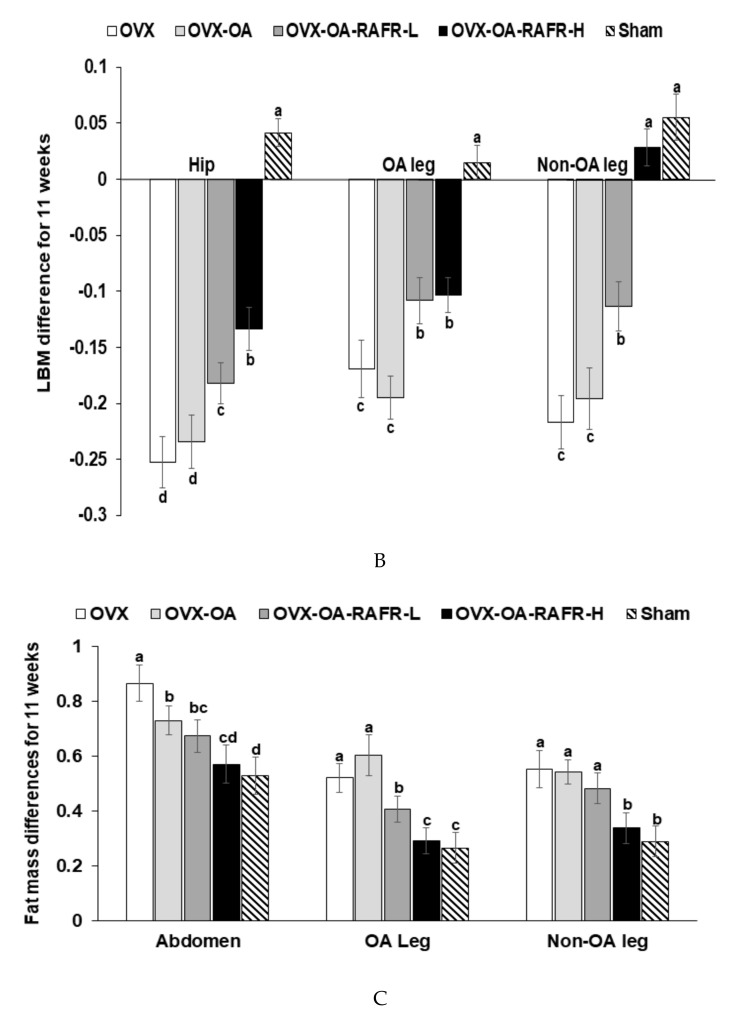
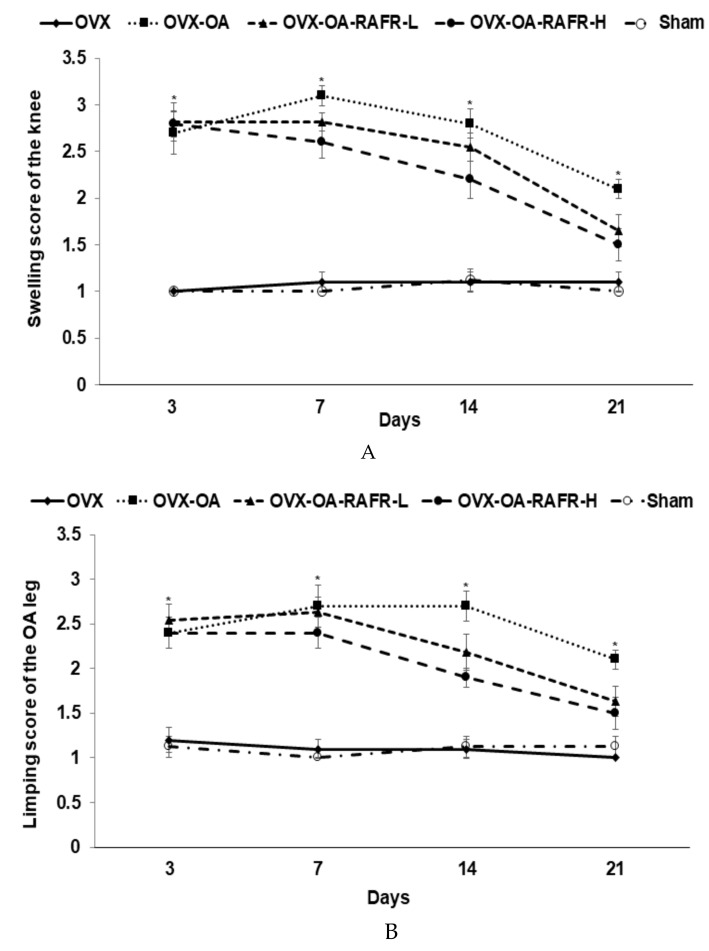
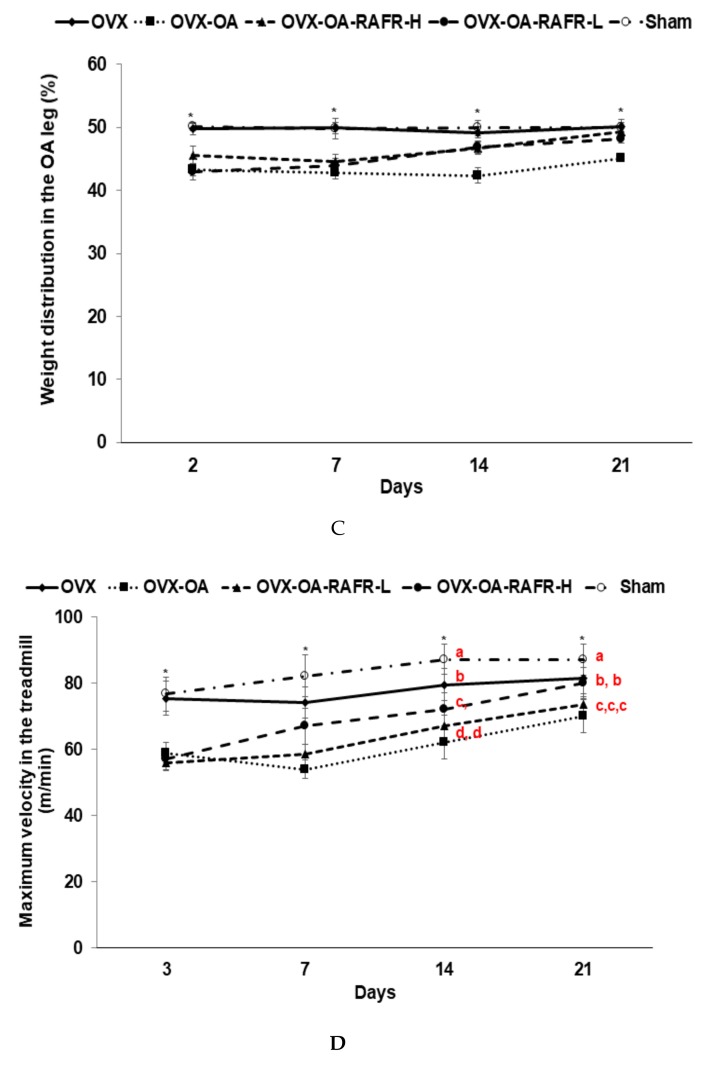
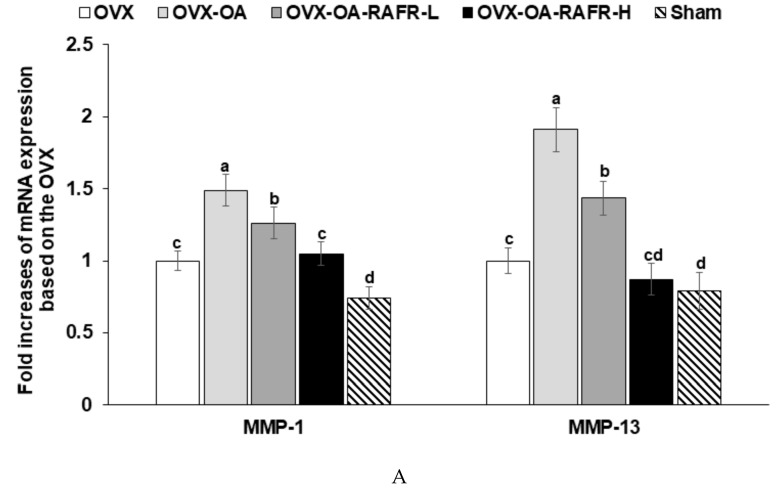
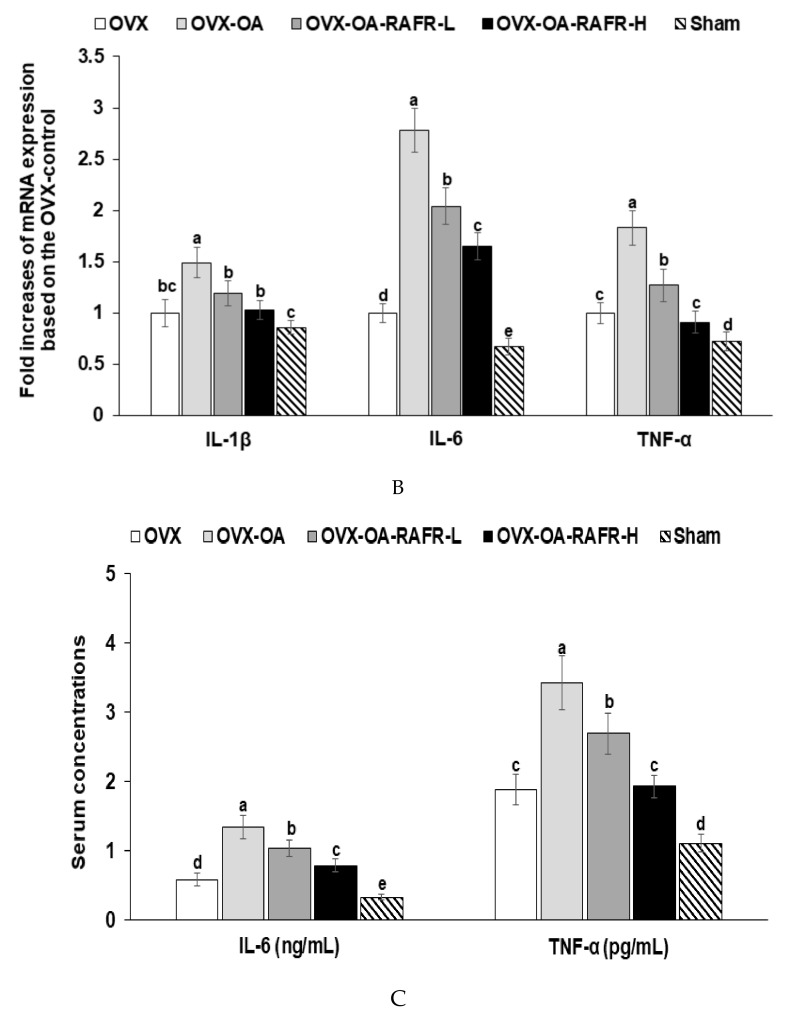
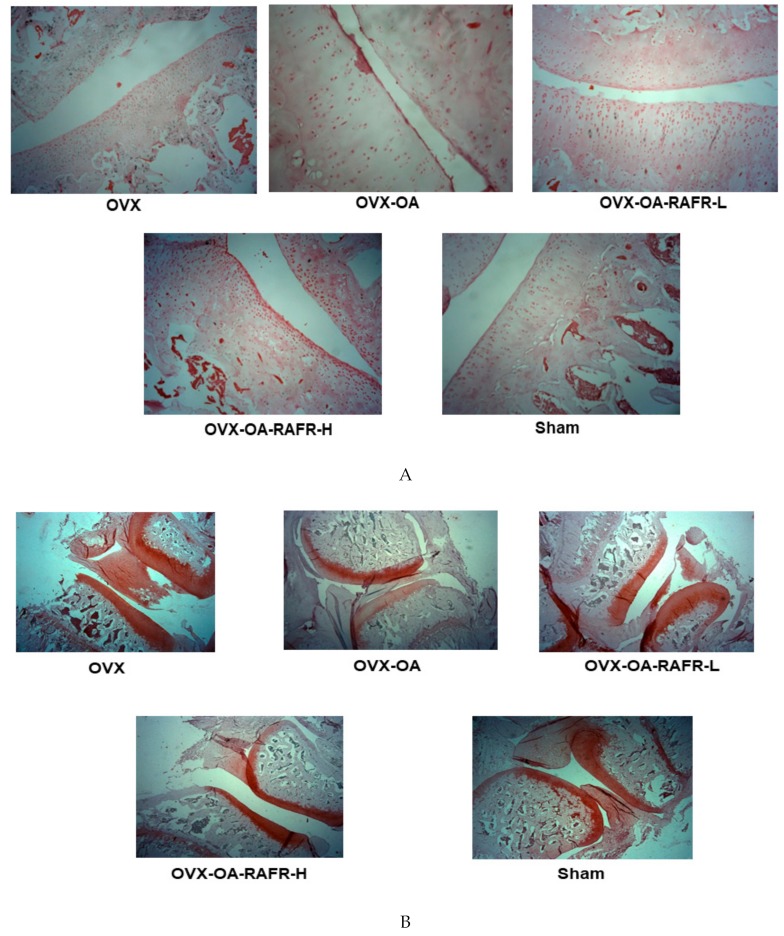
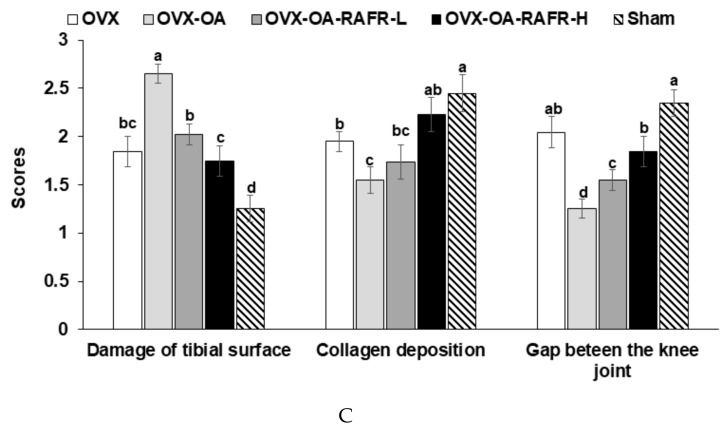
Rice porridge containing Allium fistulosum (Welsh onion) root water extract (RAFR) has anti-inflammatory bioactive compounds. We examined whether the long-term administration of rice porridge with RAFR would prevent or delay the progression of osteoarthritis and menopausal symptoms in estrogen-deficient animals by ovariectomy. The rats consumed 40% fat energy diets containing 250 mg RAFR (rice: Allium fistulosum root = 13:1)/kg body weight (bw) (OVX-OA-RAFR-Low), 750 mg RAFR/kg bw (OVX-OA-RAFR-High) and 750 mg starch and protein/kg bw(OVX), respectively. After consuming the assigned diets for eight weeks, monoiodoacetate (OVX-OA) or saline (OVX) were injected into the knee joints of the rats for an additional three weeks. Sham rats were administered saline injections (normal-control). OVX-OA-RAFR improved oral glucose tolerance and also protected against decreases in bone mineral density and lean body mass in the legs and increases in fat mass in the abdomen, compared to the OVX and OVX-OA. OVX-OA-RAFR improved swelling and limping scores, normalized weight distribution between the osteoarthritic and normal limbs, and increased maximum running speeds compared to the OVX-OA. The OVX-OA deteriorated the articular cartilage by reducing the articular matrix and bone loss in the knee joint and it prevented knee joint deterioration when compared to the OVX. The improvement in osteoarthritis symptoms in OVX-OA-RAFR decreased the mRNA expression of matrix metallo-proteinase-1 and matrix metalloproteinase-13, tumor necrosis factor-α, and interleukin-1β and interleukin-6 in the articular cartilage compared to OVX-OA rats. In conclusions, RAFR is effective in treating osteoarthritis symptoms and it may be used for a therapeutic agent in osteoarthritis-induced menopausal women.

Keywords: Welsh onion root; estrogen-deficiency; inflammation; osteoarthritis; pain; rice porridge.


Conflict of interest statement

The authors declare no conflicts of interest.

Figures

Figure 1
Figure 1
The UPLC-MS/MS chromatograms of rice porridge containing Allium fistulosum root water extract.
Figure 2
Figure 2
The area under the curve (AUC) of serum glucose concentrations during the oral glucose tolerance test. Ovariectomized (OVX) rats were divided into four groups: (1) MIA injection into the knee joint and fed a high-fat diet containing 0.23% rice + 0.018% AFR diet (RAFR-L). (2) MIA injection into the knee joint and fed a high-fat diet containing 0.69% rice + 0.053% AFR diet (RAFR-H). (3) MIA injection into the knee joint and fed a high-fat diet containing 0.053% cellulose (OA-control). (4) saline injection into the knee joint and fed a high-fat diet containing 0.053% cellulose (non-OA control). Sham rats had the same diet as a control and received a saline injection (normal-control). At the beginning of the eighth week, an articular injection of monoiodoacetate (MIA) into the right knee was performed in all OVX groups except the non-OA control and normal-control groups. Two weeks after the MIA injection, oral glucose tolerance tests were performed with 2 g glucose per kg body weight after 16 h of fasting. Serum glucose (A) was measured, and the area under the glucose curve (B) was calculated. The dots or bars and error bars represent the mean+SD (n = 10). a,b Values of the bars with different superscripts were significantly different among groups, as per the Tukey test at p < 0.05.
Figure 2
Figure 2
The area under the curve (AUC) of serum glucose concentrations during the oral glucose tolerance test. Ovariectomized (OVX) rats were divided into four groups: (1) MIA injection into the knee joint and fed a high-fat diet containing 0.23% rice + 0.018% AFR diet (RAFR-L). (2) MIA injection into the knee joint and fed a high-fat diet containing 0.69% rice + 0.053% AFR diet (RAFR-H). (3) MIA injection into the knee joint and fed a high-fat diet containing 0.053% cellulose (OA-control). (4) saline injection into the knee joint and fed a high-fat diet containing 0.053% cellulose (non-OA control). Sham rats had the same diet as a control and received a saline injection (normal-control). At the beginning of the eighth week, an articular injection of monoiodoacetate (MIA) into the right knee was performed in all OVX groups except the non-OA control and normal-control groups. Two weeks after the MIA injection, oral glucose tolerance tests were performed with 2 g glucose per kg body weight after 16 h of fasting. Serum glucose (A) was measured, and the area under the glucose curve (B) was calculated. The dots or bars and error bars represent the mean+SD (n = 10). a,b Values of the bars with different superscripts were significantly different among groups, as per the Tukey test at p < 0.05.
Figure 3
Figure 3
Bone mineral density (BMD) and the lean mass of the femur and knee with the intra-articular injection of monoiodoacetate (MIA) at days 0 and 21 after MIA-injection Ovariectomized (OVX) rats were divided into four groups: (1) MIA injection into the knee joint and fed a high-fat diet containing 0.23% rice + 0.018% AFR diet (RAFR-L). (2) MIA injection into the knee joint and fed a high-fat diet containing 0.69% rice + 0.053% AFR diet (RAFR-H). (3) MIA injection into the knee joint and fed a high-fat diet containing 0.053% cellulose (OA-control). (4) saline injection into the knee joint and fed a high-fat diet containing 0.053% cellulose (non-OA control). Sham rats had the same diet as the control and received a saline injection (normal-control). At the beginning of the eighth week, an articular injection of monoiodoacetate into the right knee was performed in all OVX groups, except the normal-control group, and the assigned diets were provided for an additional three weeks. The BMD (A) and lean body mass (B) of the hips and right legs, as well as the mass of the fat in the abdomens and right legs (C), were measured via DEXA. Each bar and error bar represents the mean ± SD (n = 10). a,b,c,d Values of the bars with different superscripts were significantly different among groups as per the Tukey test at p < 0.05.
Figure 3
Figure 3
Bone mineral density (BMD) and the lean mass of the femur and knee with the intra-articular injection of monoiodoacetate (MIA) at days 0 and 21 after MIA-injection Ovariectomized (OVX) rats were divided into four groups: (1) MIA injection into the knee joint and fed a high-fat diet containing 0.23% rice + 0.018% AFR diet (RAFR-L). (2) MIA injection into the knee joint and fed a high-fat diet containing 0.69% rice + 0.053% AFR diet (RAFR-H). (3) MIA injection into the knee joint and fed a high-fat diet containing 0.053% cellulose (OA-control). (4) saline injection into the knee joint and fed a high-fat diet containing 0.053% cellulose (non-OA control). Sham rats had the same diet as the control and received a saline injection (normal-control). At the beginning of the eighth week, an articular injection of monoiodoacetate into the right knee was performed in all OVX groups, except the normal-control group, and the assigned diets were provided for an additional three weeks. The BMD (A) and lean body mass (B) of the hips and right legs, as well as the mass of the fat in the abdomens and right legs (C), were measured via DEXA. Each bar and error bar represents the mean ± SD (n = 10). a,b,c,d Values of the bars with different superscripts were significantly different among groups as per the Tukey test at p < 0.05.
Figure 4
Figure 4
Gross observations of osteoarthritis symptoms and pain-related behaviors at 3, 7, 14, and 21 days after monoiodoacetate (MIA)-injection Ovariectomized (OVX) rats were divided into four groups: (1) MIA injection into the knee joint and fed a high-fat diet containing 0.23% rice + 0.018% AFR diet (RAFR-L). (2) MIA injection into the knee joint and fed a high-fat diet containing 0.69% rice + 0.053% AFR diet (RAFR-H). (3) MIA injection into the knee joint and fed a high-fat diet containing 0.053% cellulose (OA-control). (4) Saline injection into the knee joint and fed a high-fat diet containing 0.053% cellulose (non-OA control). Sham rats had the same diet as the control and received a saline injection (normal-control). At the beginning of the eighth week, an articular injection of monoiodoacetate (MIA) into the right knee was performed in all OVX groups except the normal-control group. The assigned diets were provided for an additional three weeks. During the gross observations of osteoarthritis symptoms, the swelling (A) and limping (B) scores in the right knee were measured. Differences in the weight distribution of the right hind paws (C) were measured via an incapacitance tester and the maximum running velocity on a treadmill (D) as indicators of knee pain. Each data point and error bar represent the mean ± SD (n = 10). * Significant treatment effect by repeated measures of a two-way ANOVA test at p < 0.05. Significant time effect by repeated measures of a two-way ANOVA test at p < 0.05. a,b,c,d Values of the bars with different superscripts were significantly different among groups as per the Tukey test at p < 0.05.
Figure 4
Figure 4
Gross observations of osteoarthritis symptoms and pain-related behaviors at 3, 7, 14, and 21 days after monoiodoacetate (MIA)-injection Ovariectomized (OVX) rats were divided into four groups: (1) MIA injection into the knee joint and fed a high-fat diet containing 0.23% rice + 0.018% AFR diet (RAFR-L). (2) MIA injection into the knee joint and fed a high-fat diet containing 0.69% rice + 0.053% AFR diet (RAFR-H). (3) MIA injection into the knee joint and fed a high-fat diet containing 0.053% cellulose (OA-control). (4) Saline injection into the knee joint and fed a high-fat diet containing 0.053% cellulose (non-OA control). Sham rats had the same diet as the control and received a saline injection (normal-control). At the beginning of the eighth week, an articular injection of monoiodoacetate (MIA) into the right knee was performed in all OVX groups except the normal-control group. The assigned diets were provided for an additional three weeks. During the gross observations of osteoarthritis symptoms, the swelling (A) and limping (B) scores in the right knee were measured. Differences in the weight distribution of the right hind paws (C) were measured via an incapacitance tester and the maximum running velocity on a treadmill (D) as indicators of knee pain. Each data point and error bar represent the mean ± SD (n = 10). * Significant treatment effect by repeated measures of a two-way ANOVA test at p < 0.05. Significant time effect by repeated measures of a two-way ANOVA test at p < 0.05. a,b,c,d Values of the bars with different superscripts were significantly different among groups as per the Tukey test at p < 0.05.
Figure 5
Figure 5
The mRNA expression of matrix metalloproteinases and pro-inflammatory cytokines in the articular cartilage after 21 days of intra-articular injection of monoiodoacetate (MIA) Ovariectomized (OVX) rats were divided into four groups: (1) MIA injection into the knee joint and fed a high-fat diet containing 0.23% rice + 0.018% AFR diet (RAFR-L). (2) MIA injection into the knee joint and fed a high-fat diet containing 0.69% rice + 0.053% AFR diet (RAFR-H), (3) MIA injection into the knee joint and fed a high-fat diet containing 0.053% cellulose (OA-control). (4) saline injection into the knee joint and fed a high-fat diet containing 0.053% cellulose (non-OA control). Sham rats had the same diet as the control and received a saline injection (normal-control). At the beginning of the eighth week, an articular injection of monoiodoacetate into the right knee was performed in all OVX groups except the normal-control group, and the assigned diets were provided for an additional three weeks. The mRNA expression of MMP-13 and MMP-13 involved in collagen degradation (A) and the cytokines (TNF-α, IL-1β, and IL-6) that result in inflammation (B) were measured via real-time PCR. Serum proinflammatory cytokines (TNF-α and IL-6) were measured by ELISA (C). Each bar and error bar represents the mean ± SD (n = 6). a,b,c,d,e Different letters indicate significant differences in the treatment groups of OVX rats at each time point identified by Tukey’s test at p < 0.05.
Figure 5
Figure 5
The mRNA expression of matrix metalloproteinases and pro-inflammatory cytokines in the articular cartilage after 21 days of intra-articular injection of monoiodoacetate (MIA) Ovariectomized (OVX) rats were divided into four groups: (1) MIA injection into the knee joint and fed a high-fat diet containing 0.23% rice + 0.018% AFR diet (RAFR-L). (2) MIA injection into the knee joint and fed a high-fat diet containing 0.69% rice + 0.053% AFR diet (RAFR-H), (3) MIA injection into the knee joint and fed a high-fat diet containing 0.053% cellulose (OA-control). (4) saline injection into the knee joint and fed a high-fat diet containing 0.053% cellulose (non-OA control). Sham rats had the same diet as the control and received a saline injection (normal-control). At the beginning of the eighth week, an articular injection of monoiodoacetate into the right knee was performed in all OVX groups except the normal-control group, and the assigned diets were provided for an additional three weeks. The mRNA expression of MMP-13 and MMP-13 involved in collagen degradation (A) and the cytokines (TNF-α, IL-1β, and IL-6) that result in inflammation (B) were measured via real-time PCR. Serum proinflammatory cytokines (TNF-α and IL-6) were measured by ELISA (C). Each bar and error bar represents the mean ± SD (n = 6). a,b,c,d,e Different letters indicate significant differences in the treatment groups of OVX rats at each time point identified by Tukey’s test at p < 0.05.
Figure 6
Figure 6
The histopathological features of osteoarthritic lesions in the knee joints of rats after 21 days of intra-articular injection of monoiodoacetate (MIA) Ovariectomized (OVX) rats were divided into four groups: (1) MIA injection into the knee joint and fed a high-fat diet containing 0.23% rice + 0.018% AFR diet (RAFR-L). (2) MIA injection into the knee joint and fed a high-fat diet containing 0.69% rice + 0.053% AFR diet (RAFR-H). (3) MIA injection into the knee joint and fed a high-fat diet added 0.053% cellulose (OA-control). (4) saline injection into the knee joint and fed a high-fat diet containing 0.053% cellulose (non-OA control). Sham rats had the same diet as the control and received a saline injection (normal-control). At the beginning of the eighth week, an articular injection of monoiodoacetate into the right knee was performed in all OVX groups except the normal-control group, and the assigned diets were provided for an additional three weeks. The depth and extent of cartilage damage and the quantification of the damage were determined in hematoxylin-eosin stained (A), paraffin-embedded knee joint sections from MIA-injected rats (magnifying power ×10). The depth and extent of cartilage damage and quantification of the cartilage damage in the MIA-injected knees were evaluated in Safranin O–fast green–stained (B) knee joint sections from the osteoarthritic rats (magnifying power ×2.5). Scores of the knee joint damage (C) were calculated from the stained sections. Each bar and error bar represents the mean ± SD (n = 5). a,b,c,d Values of the bars with different superscripts were significantly different among groups as per the Tukey test at p < 0.05.
Figure 6
Figure 6
The histopathological features of osteoarthritic lesions in the knee joints of rats after 21 days of intra-articular injection of monoiodoacetate (MIA) Ovariectomized (OVX) rats were divided into four groups: (1) MIA injection into the knee joint and fed a high-fat diet containing 0.23% rice + 0.018% AFR diet (RAFR-L). (2) MIA injection into the knee joint and fed a high-fat diet containing 0.69% rice + 0.053% AFR diet (RAFR-H). (3) MIA injection into the knee joint and fed a high-fat diet added 0.053% cellulose (OA-control). (4) saline injection into the knee joint and fed a high-fat diet containing 0.053% cellulose (non-OA control). Sham rats had the same diet as the control and received a saline injection (normal-control). At the beginning of the eighth week, an articular injection of monoiodoacetate into the right knee was performed in all OVX groups except the normal-control group, and the assigned diets were provided for an additional three weeks. The depth and extent of cartilage damage and the quantification of the damage were determined in hematoxylin-eosin stained (A), paraffin-embedded knee joint sections from MIA-injected rats (magnifying power ×10). The depth and extent of cartilage damage and quantification of the cartilage damage in the MIA-injected knees were evaluated in Safranin O–fast green–stained (B) knee joint sections from the osteoarthritic rats (magnifying power ×2.5). Scores of the knee joint damage (C) were calculated from the stained sections. Each bar and error bar represents the mean ± SD (n = 5). a,b,c,d Values of the bars with different superscripts were significantly different among groups as per the Tukey test at p < 0.05.

References

    1. Xia B., Di C., Zhang J., Hu S., Jin H., Tong P. Osteoarthritis pathogenesis: A review of molecular mechanisms. Calcif. Tissue Int. 2014;95:495–505. doi: 10.1007/s00223-014-9917-9. - DOI - PMC - PubMed
    1. Cross M., Smith E., Hoy D., Nolte S., Ackerman I., Fransen M., Bridgett L., Williams S., Guillemin F., Hill C.L., et al. The global burden of hip and knee osteoarthritis: Estimates from the global burden of disease 2010 study. Ann. Rheum. Dis. 2014;73:1323–1330. doi: 10.1136/annrheumdis-2013-204763. - DOI - PubMed
    1. Park J.H., Hong J.Y., Han K., Suh S.W., Park S.Y., Yang J.H., Han S.W. Prevalence of symptomatic hip, knee, and spine osteoarthritis nationwide health survey analysis of an elderly Korean population. Medicine. 2017;96:e6372. doi: 10.1097/MD.0000000000006372. - DOI - PMC - PubMed
    1. Tang X., Wang S., Zhan S., Niu J., Tao K., Zhang Y., Lin J. The Prevalence of Symptomatic Knee Osteoarthritis in China: Results from the China Health and Retirement Longitudinal Study. Arthritis Rheumatol. 2016;68:648–653. doi: 10.1002/art.39465. - DOI - PubMed
    1. O’Neill T.W., McCabe P.S., McBeth J. Update on the epidemiology, risk factors and disease outcomes of osteoarthritis. Best Pract. Res. Clin. Rheumatol. 2018;32:312–326. doi: 10.1016/j.berh.2018.10.007. - DOI - PubMed

MeSH terms