. 2019 Jul:45:303-313.
doi: 10.1016/j.ebiom.2019.06.008. Epub 2019 Jun 29.

Biosynthetic homeostasis and resilience of the complement system in health and infectious disease

Affiliations

Biosynthetic homeostasis and resilience of the complement system in health and infectious disease

Esther Willems et al. EBioMedicine. 2019 Jul.

Abstract

Background: The complement system is a central component of the innate immune system. Constitutive biosynthesis of complement proteins is essential for homeostasis. Dysregulation as a consequence of genetic or environmental cues can lead to inflammatory syndromes or increased susceptibility to infection. However, very little is known about steady state levels in children or its kinetics during infection.

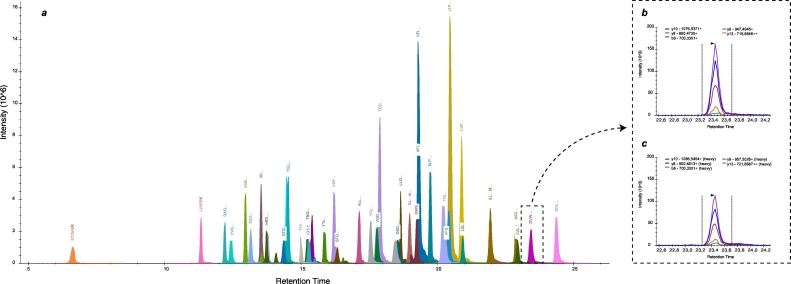
Methods: With a newly developed multiplex mass spectrometry-based method we analyzed the levels of 32 complement proteins in healthy individuals and in a group of pediatric patients infected with bacterial or viral pathogens.

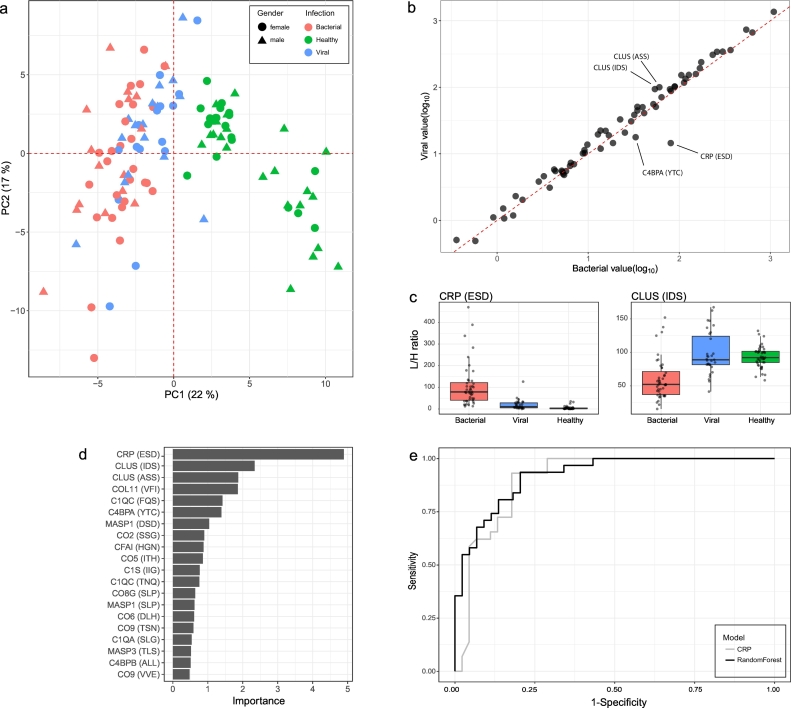
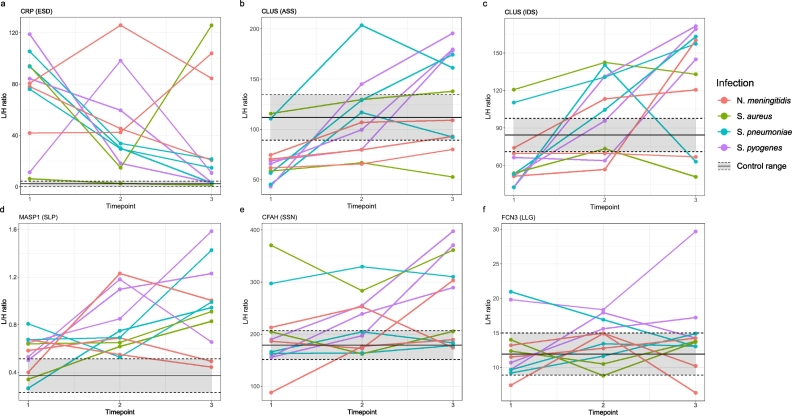
Findings: In plasma from young infants we found reduced levels of C4BP, ficolin-3, factor B, classical pathway components C1QA, C1QB, C1QC, C1R, and terminal pathway components C5, C8, C9, as compared to healthy adults; whereas the majority of complement regulating (inhibitory) proteins reach adult levels at very young age. Both viral and bacterial infections in children generally lead to a slight overall increase in complement levels, with some exceptions. The kinetics of complement levels during invasive bacterial infections only showed minor changes, except for a significant increase and decrease of CRP and clusterin, respectively.

Interpretation: The combination of lower levels of activating and higher levels of regulating complement proteins, would potentially raise the threshold of activation, which might lead to suppressed complement activation in the first phase of life. There is hardly any measurable complement consumption during bacterial or viral infection. Altogether, expression of the complement proteins appears surprisingly stable, which suggests that the system is continuously replenished. FUND: European Union's Horizon 2020, project PERFORM, grant agreement No. 668303.

Keywords: C-reactive protein (CRP); Clusterin; Complement system; Infectious disease; Multiple reaction monitoring (MRM); Targeted mass spectrometry.


Conflict of interest statement

Dr. Alkema reports grants from European Commission, during the conduct of the study; Dr. van der Flier reports grants from CSL Behring, grants from Shire, outside the submitted work; Dr. Emonts reports grants from EU FP7, grants from European Union's Horizon 2020 research and innovation programme, during the conduct of the study; personal fees from Newcastle upon Tyne Hospitals NHS Foundation Trust, personal fees from Newcastle University, outside the submitted work; Dr. Irene Rivero-Calle reports other from Ablynx, other from Jansen, other from GSK, other from Medimmune and other from Sanofi Pasteur; personal fees and other from Pfizer, personal fees and other from MSD; all outside the submitted work.

Figures

Unlabelled Image
Graphical abstract
Fig. 1
Fig. 1
Schematic representation of the complement system, showing approximately 50 directly involved soluble and membrane-bound complement proteins. The complement system is activated through three different pathways: the classical, lectin, and alternative pathway. Activation of each of these proteolytic cascades leads to the cleavage of the central component complements C3 and C5. Complement factors are also active in extrinsic pathways. The multiplex MRM Complement assay targets proteins from the three main pathways, as indicated in green. Proteins indicated in orange are those that were excluded from the assay because of low abundance. Proteins indicated in red were not detectable with this method. Proteins in gray are not in the assay as they are mostly membrane bound or complexes. (For interpretation of the references to colour in this figure legend, the reader is referred to the web version of this article.)
Fig. 2
Fig. 2
Overview of all peptide targets in the multiplex MRM Complement assay. (a) Combined chromatogram of all 64 MRM targets. (b-c) Representative fragmentation spectrum of (b) endogenous peptide DVWGIEGPIDAAFTR (protein vitronectin), m/z 823·9123 (2+), fragments y13, y10, y9, y8, b6; (c) The corresponding C-term 13C15N-heavy isotope labeled internal standard DVWGIEGPIDAAFTR, m/z 828.9164 (2+), fragments y13, y10, y9, y8, b6. The peptide fragments y10 and y9 were selected for further analysis based on best characteristics such as: signal intensity, low interfering background signal, linearity and reproducibility.
Fig. 3
Fig. 3
Correlation plot for the measurement of CRP by the highly standardized clinical assay and by the MRM assay, targeting peptide ESDTSYVSLK. Patients with a bacterial infection are indicated with red dots and patients with a viral infection are indicated with blue dots. A correlation coefficient of 1 is depicted by the dashed diagonal line. The Pearson r correlation of the targeted method and the clinical CRP standard is 0·798. (For interpretation of the references to colour in this figure legend, the reader is referred to the web version of this article.)
Fig. 4
Fig. 4
Age-dependent complement levels, with (a) correlation plot for all 64 peptides, each indicated by a black circle, comparing a group of 20 adults to a group of 23 pediatric controls showing a Pearson r correlation of 0.992). A correlation coefficient of 1 is depicted by the dashed diagonal line. (b) Correlation plot for all 64 peptides comparing the adult controls to the infant controls (≤1 year). (c-e) The pediatric control group was divided into four separate age classes: 0–0·5 years, 0·5–1 years, 1–2 years, 2–18 years, 18–50 years old, where each marker represents one individual, including the mean and standard deviations per group. All groups were compared to the adult (18–50 years) class using ANOVA with Bonferroni's Multiple Comparison test and significant trends were depicted in gray boxes (*p < 0·05; **p < 0·01; ***p < 0·001; ns, not significant). Different patterns of development to adult levels could be distinguished, showing representative figures for proteins reaching adult levels (c) within 1 year for peptide FB (YGL), (d) at 2 years (C9 (TSN)), or (e) after 2 years (C1QA (SLG)). (f) Gender differences were not observed for any of the peptides, as depicted by one representative plot with the gender groups for both the control and patient group for peptide FB (YGL).Graphs of all other peptides, comparing age and gender, can be found in the supplementary material.
Fig. 5
Fig. 5
Comparing the complement peptides in health and disease. (a) Correlation matrix of all 64 peptides for all healthy controls. (b) Correlation matrix of all 64 peptides for all patients.
Fig. 6
Fig. 6
Comparing healthy individuals (green) and pediatric patients with a bacterial (red) or viral (blue) infection. (a) Principle component analysis on log2 transformed data shows that PC1, describing mainly the variation between healthy controls and both patient groups, contains 22% of the variation and PC2 17%. (b) Correlation plot to determine differences in complement levels between patients with viral and bacterial infections, based on the average value of all patients, where each dot represents one peptide. (c) Comparison of CRP and Clusterin levels between healthy controls and patients with viral or bacterial infections. Each dot represents one individual; with a boxplot showing the first quartile, median and third quartile. The lower and upper whisker represent the smallest and largest value within 1·5 times interquartile range below the first quartile or above the third quartile, respectively. (d) Multivariate random forest analysis to identify the top discriminators. (e) A ROC curve showing the performance of the random forest model (black line), with an AUC of 0·9216, as compared to the clinical CRP (gray line) with an AUC of 0·9046. (For interpretation of the references to colour in this figure legend, the reader is referred to the web version of this article.)
Fig. 7
Fig. 7
Kinetics of complement protein levels during bacterial infection with either N. meningitidis (n = 3 individuals), S. aureus (n = 2), S. pneumoniae (n = 3) or S. pyogenes (n = 3), with T1 (hospital admission), T2 (48h post-admission) and T3 (recovery), compared to average child control values (± std.dev. indicated by gray area), depicted for the peptides (a) CRP (ESD), (b) clusterin (ASS), (c) clusterin (IDS), (d) MASP1 (SLP), (e) factor H (SSN), (f) ficolin3 (LLG). A heat map overview of all peptides is included in Fig. S5.

References

    1. Nonaka M., Kimura A. Genomic view of the evolution of the complement system. Immunogenetics. 2006;58(9):701–713. - PMC - PubMed
    1. Ricklin D., Hajishengallis G., Yang K., Lambris J.D. Complement: a key system for immune surveillance and homeostasis. Nat Immunol. 2010;11(9):785–797. - PMC - PubMed
    1. Merle N.S., Church S.E., Fremeaux-Bacchi V., Roumenina L.T. Complement system part I–molecular mechanisms of activation and regulation. Front Immunol. 2015;6 - PMC - PubMed
    1. Merle N.S., Noe R., Halbwachs-Mecarelli L., Fremeaux-Bacchi V., Roumenina L.T. Complement system part II: role in immunity. Front Immunol. 2015;6 - PMC - PubMed
    1. Skattum L., van Deuren M., van der Poll T., Truedsson L. Complement deficiency states and associated infections. Mol Immunol. 2011;48(14):1643–1655. - PubMed

MeSH terms