. 2019 Aug;18(8):1396-1404.
doi: 10.1158/1535-7163.MCT-18-0727. Epub 2019 Jul 1.

Differences in Signaling Patterns on PI3K Inhibition Reveal Context Specificity in KRAS-Mutant Cancers

Affiliations

Differences in Signaling Patterns on PI3K Inhibition Reveal Context Specificity in KRAS-Mutant Cancers

Adam Stewart et al. Mol Cancer Ther. 2019 Aug.

Abstract

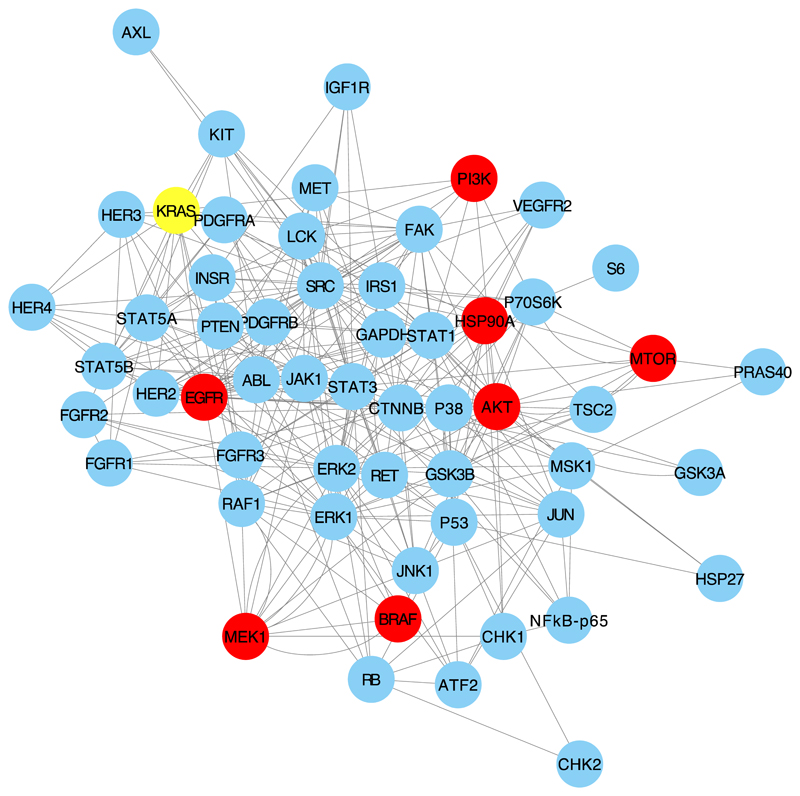
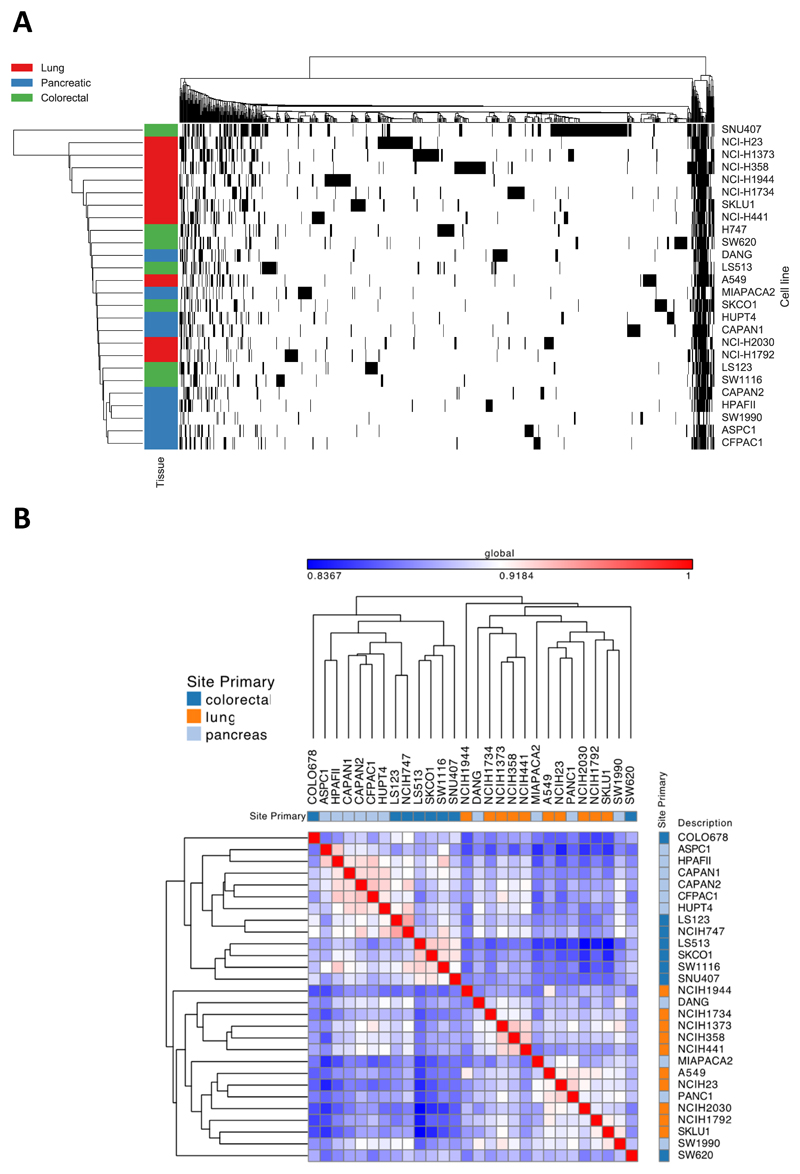
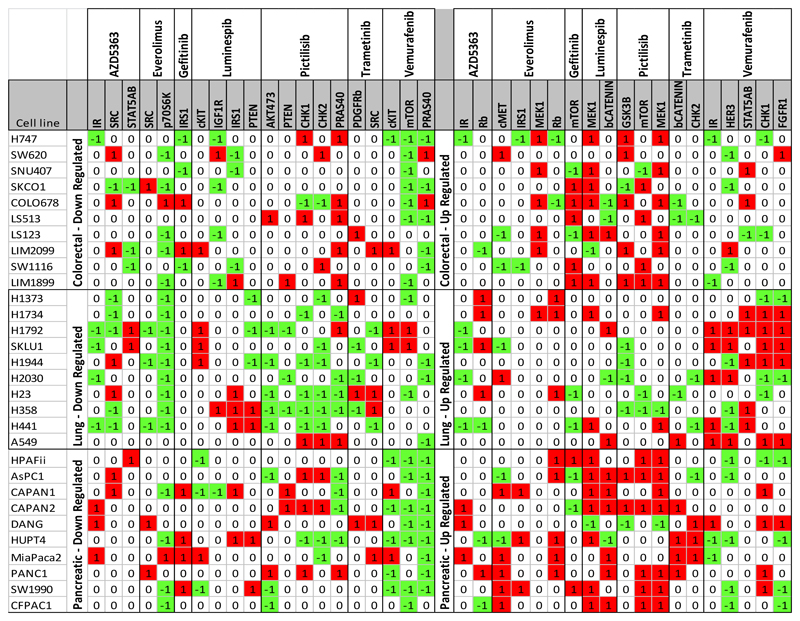
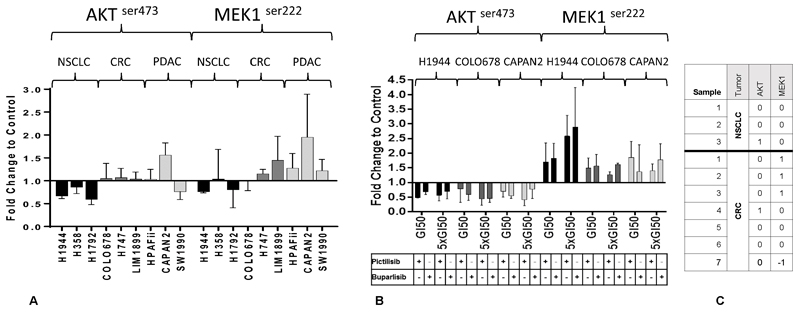
It is increasingly appreciated that drug response to different cancers driven by the same oncogene is different and may relate to differences in rewiring of signal transduction. We aimed to study differences in dynamic signaling changes within mutant KRAS (KRAS MT), non-small cell lung cancer (NSCLC), colorectal cancer, and pancreatic ductal adenocarcinoma (PDAC) cells. We used an antibody-based phosphoproteomic platform to study changes in 50 phosphoproteins caused by seven targeted anticancer drugs in a panel of 30 KRAS MT cell lines and cancer cells isolated from 10 patients with KRAS MT cancers. We report for the first time significant differences in dynamic signaling between colorectal cancer and NSCLC cell lines exposed to clinically relevant equimolar concentrations of the pan-PI3K inhibitor pictilisib including a lack of reduction of p-AKTser473 in colorectal cancer cell lines (P = 0.037) and lack of compensatory increase in p-MEK in NSCLC cell lines (P = 0.036). Differences in rewiring of signal transduction between tumor types driven by KRAS MT cancers exist and influence response to combination therapy using targeted agents.


Figures

Figure 1
Figure 1
The figure shows the network of interactions between the phosphoproteins studied in this project and the targets of the drugs used and KRAS. Targets of the drugs are shown as red nodes.
Figure 2
Figure 2
Baseline characteristics of cell line panel A) Heat map of mutations in the cell line panel, using agglomerative average linkage clustering with hamming distance. Black = a mutated gene. Cell lines are labelled on the left with their tissue type. B) GENE-E clustered heat map of global Pearson correlations between basal mRNA, with tissue type annotation. The minimal global Pearson correlation between cell lines is 0.8347, reflecting similarities in expression of the majority of the 16,381 genes analyzed, for example, due to house-keeping gene expression. Pearson correlations are indicated by a blue-white-red color scale normalized to this minimum correlation of 0.8347 and maximized to a perfect correlation of 1. Overall, the three tissue types are mixed throughout the correlation matrix: the cell lines do not cluster together with other cell lines of the same tissue in the dendrogram. The highest correlations between mRNA profiles (denoted by a pink-red color in the heat map) are seen between the following cell lines: ASPC1, HPAFII, CAPAN1, CAPAN2, CFPAC1 and HUPT4, all of which are pancreatic. However, the remaining pancreatic cell lines are scattered throughout the dendrogram and have a comparatively low correlation with this cluster of cell lines.
Figure 3
Figure 3
Results of phosphoproteomic screen Changes in phosphorylation in cell lines exposed to targeted anticancer drugs. For each analyte, phosphorylation changes had to be first separated out into ‘up regulated vs not’ and ‘down-regulated vs not’ giving binary ‘1/0’ categories. Logistic regression compared the number of ‘1s’ in one tumor type to the ‘1s’ in the other two tumor types combined, repeated for each tumor/drug/analyte configuration and was corrected for multiple testing. The color green and symbol -1 denotes that the levels of the phosphoprotein were 2 standard deviations below the control; the color red and symbol 1 denote levels of phosphoprotein that were 2 standard deviations above control and cells with no color and symbol 0 denote values between 2 standard deviations above and below control. Only changes that were significantly different between any of the three tumor types by logistic regression have been depicted.
Figure 4
Figure 4
Validation of findings in phosphoproteomic screen A) Changes in phosphorylation caused by the pan-PI3K inhibitor, pictilisib. Nine cell lines were exposed to pictilisib in 3 separate experiments and the phosphorylation of p-MEK and p-AKT was measured to confirm findings in the initial screen. B) Changes in phosphorylation caused by equitoxic concentrations of PI3K inhibitors pictilisib and buparlisib for 1 hr at GI50 and x 5 GI50 concentration for 1 hr. The phosphoprotein changes caused by both inhibitors are concordant. C) Changes in phosphorylation in 10 samples of cancer cells isolated from patients with KRASMT cancers exposed to pictilisib. 1, -1 indicate changes more than 2 standard deviations above or below control, respectively and 0 indicates changes between 2 standard deviations above or below the control. None of the NSCLC samples showed a significant increase in p-MEK while 3/7 CRC samples did. Significant reductions in p-AKT levels were not seen in NSCLC or CRC samples. The concentrations of drugs used for the cell lines are detailed in the Supplementary Data. The patient-derived cell lines were exposed to a concentration of pictilisib of 96.3 nM. The histograms in A and B represent means and the error bars represent standard deviation.

References

    1. Drilon A, Siena S, Ou SI, Patel M, Ahn MJ, Lee J, et al. Safety and Antitumor Activity of the Multitargeted Pan-TRK, ROS1, and ALK Inhibitor Entrectinib: Combined Results from Two Phase I Trials (ALKA-372-001 and STARTRK-1) Cancer Discov. 2017;7:400–9. - PMC - PubMed
    1. Chapman PB, Hauschild A, Robert C, Haanen JB, Ascierto P, Larkin J, et al. Improved survival with vemurafenib in melanoma with BRAF V600E mutation. N Engl J Med. 2011;364:2507–16. - PMC - PubMed
    1. Hyman DM, Puzanov I, Subbiah V, Faris JE, Chau I, Blay JY, et al. Vemurafenib in Multiple Nonmelanoma Cancers with BRAF V600 Mutations. N Engl J Med. 2015;373:726–36. - PMC - PubMed
    1. Prahallad A, Sun C, Huang S, Di Nicolantonio F, Salazar R, Zecchin D, et al. Unresponsiveness of colon cancer to BRAF(V600E) inhibition through feedback activation of EGFR. Nature. 2012;483:100–3. - PubMed
    1. Cox AD, Fesik SW, Kimmelman AC, Luo J, Der CJ. Drugging the undruggable RAS: Mission possible? Nat Rev Drug Discov. 2014;13:828–51. - PMC - PubMed

Publication types

MeSH terms