. 2019 Aug 29;134(9):765-775.
doi: 10.1182/blood.2018893594. Epub 2019 Jul 1.

Platelet hyaluronidase-2 regulates the early stages of inflammatory disease in colitis

Affiliations

Platelet hyaluronidase-2 regulates the early stages of inflammatory disease in colitis

Aaron C Petrey et al. Blood. .

Abstract

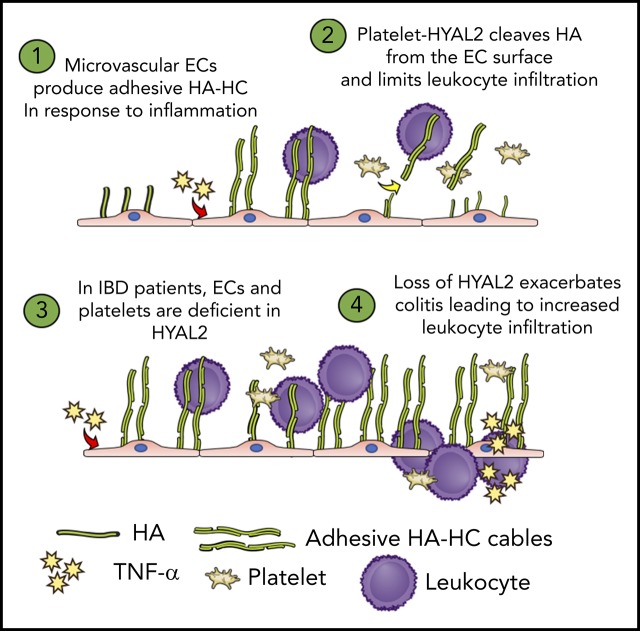
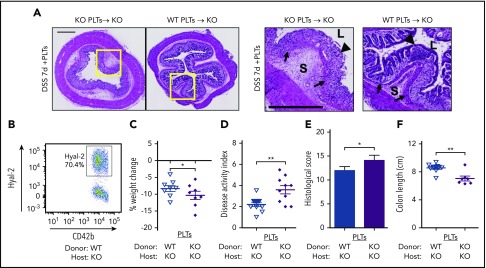
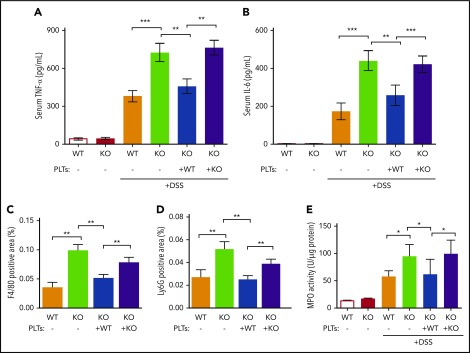
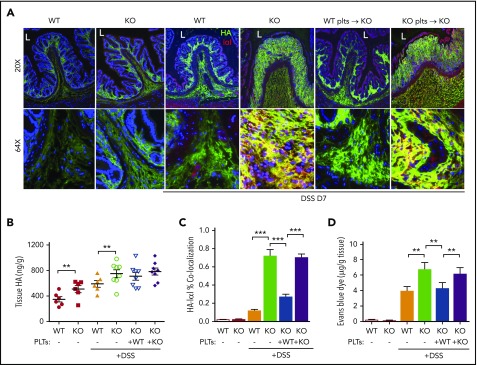
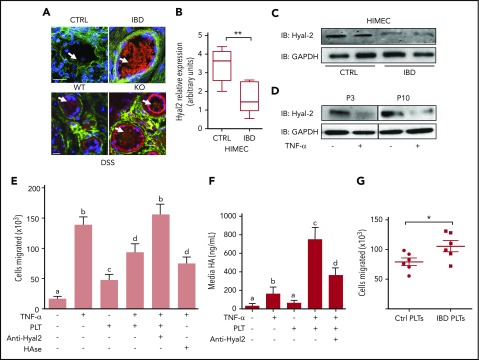
Platelets are specialized cells essential for hemostasis that also function as crucial effectors capable of mediating inflammatory and immune responses. These sentinels continually survey their environment and discriminate between homeostatic and danger signals such as modified components of the extracellular matrix. The glycosaminoglycan hyaluronan (HA) is a major extracellular matrix component that coats the vascular lumen and, under normal conditions, restricts access of inflammatory cells. In response to tissue damage, the endothelial HA matrix enhances leukocyte recruitment and regulates the early stages of the inflammatory response. We have shown that platelets can degrade HA from the surface of activated endothelial cells via the enzyme hyaluronidase-2 (HYAL2) and that HYAL2 is deficient in platelets isolated from patients with inflammatory bowel disease (IBD). Platelets are known to be involved in the pathogenesis of several chronic disease states, including IBD, but they have been largely overlooked in the context of intestinal inflammation. We therefore wanted to define the mechanism by which platelet HYAL2 regulates the inflammatory response during colitis. In this study, we provide evidence that HA catabolism is disrupted in human intestinal microvascular endothelial cells isolated from patients with IBD. Furthermore, mice deficient in HYAL2 are more susceptible to an acute model of colitis, and this increased susceptibility is abrogated by transfusion of HYAL2-competent platelets. Finally, we show that platelets, via HYAL2-dependent degradation of endothelial HA, regulate the early stages of inflammation in colitis by limiting leukocyte extravasation.


Conflict of interest statement

Conflict-of-interest disclosure: The authors declare no competing financial interests.

Figures

None
Graphical abstract
Figure 1.
Figure 1.
HYAL2 KO mice are more susceptible to DSS-induced colitis. (A) Cross-sections of distal colon collected from mice after 7 days of colitis induction with 2.5% DSS. Hematoxylin-eosin staining highlights the cellular and structural changes in the intestine, including inflammatory leukocyte infiltration. Boxed regions are enlarged in adjacent panels. Scale bars indicate 500 μm. L denotes the intestinal lumen, triangles indicate the epithelial layer, S denotes the submucosa, and arrows indicate the muscularis mucosae. (B) Body weight was measured on day 7 and compared with starting weight. (C) Mice were scored for outward signs of disease, including weight loss, hunched posture, ruffled fur, bloody stools, and rectal prolapse. (D) Distal colon sections from mice after 7 days of DSS were scored for pathologic changes, including erosion of the epithelial layer, leukocyte infiltration, submucosal swelling, muscularis mucosae hyperplasia, and increased vascularization. (E) Colons from mice euthanized after 7 days of DSS were measured for distance (centimeters) from the distal end of the cecum to the rectum. Symbols represent individual mice. Symbols indicate genotypes: (▲) WT mice and (●) HYAL2 KO mice. Data are reported as mean ± SEM; n = 10 mice per group. *P < .05.
Figure 2.
Figure 2.
Platelets from mice with DSS-induced colitis have reduced HYAL2 and hyaluronidase activity. Platelets were isolated from untreated control and DSS-treated mice after 7 days. (A) Platelet lysates corresponding to 10 μg of protein were probed for HYAL2 and actin. (B) Densitometry quantification shows that HYAL2 levels are reduced an average of 44% (*P < .05) in platelets from DSS-treated mice compared with control mice. (C) Platelet lysates were compared for their HA-degrading activities by incubation with 60 nM Förster resonance energy transfer–based HA nanoprobes at pH 4.5. Maximum activity was achieved by recombinant hyaluronidase. Platelets from DSS-treated mice exhibit a 60% reduction (*P < .05) in HA-degrading activity compared with platelets from untreated mice. (D) Changes in circulating platelet count before and after DSS-induced colitis (**P < .01). (E) Serum isolated from DSS-treated mice and control mice at 7 days was tested for HA levels (*P < .05).
Figure 3.
Figure 3.
Loss of HYAL2 in hematopoietic cells exacerbates DSS-induced colitis. Bone marrow transplant (BMT) chimeras were generated by using WT (HYAL2+/+) and KO (HYAL2−/−) mice as host and BM donor, respectively. (A) Cross-sections of distal colon collected from mice after 7 days of 2.5% DSS. Hematoxylin-eosin staining reveals the cellular and structural changes in the intestine, including inflammatory leukocyte infiltration. Boxed regions are enlarged in adjacent panels. Scale bars indicate 500 μm. L denotes the intestinal lumen, triangles indicate the epithelial layer, S denotes the submucosa, and arrows indicate the muscularis mucosae. (B) Body weight was measured on day 7 and compared with starting weight. (C) Mice were scored for outward signs of disease, including weight loss, hunched posture, ruffled fur, bloody stools, and rectal prolapse. (D) Distal colon sections from mice after 7 days of DSS were scored for pathologic changes, including erosion of the epithelial layer, leukocyte infiltration, submucosal swelling, muscularis mucosae hyperplasia, and increased vascularization. (E) Colons from mice euthanized after 7 days of DSS were measured for distance (centimeters) from the distal end of the cecum to the rectum. Symbols indicate genotypes and treatment: (▲) WT mice receiving WT BM, n = 8; and (○) WT mice receiving HYAL2 KO BM, n = 7. Data are reported as mean ± SEM. *P < .05.
Figure 4.
Figure 4.
Platelet HYAL2 mediates susceptibility to colitis. Mice received adoptive transfer of 8 × 10⁸ WT or KO platelets as indicated at the onset of DSS treatment. (A) Cross-sections of distal colon collected from mice after 7 days of 2.5% DSS. Hematoxylin-eosin staining reveals the cellular and structural changes in the intestine, including inflammatory leukocyte infiltration. Boxed regions are enlarged in adjacent panels. Scale bars indicate 500 μm. L denotes the intestinal lumen, triangles indicate the epithelial layer, S denotes the submucosa, and arrows indicate the muscularis mucosae. (B) The percentage of platelets expressing HYAL2 in KO mice receiving WT platelets assessed by using flow cytometry. (C) Body weight was measured on day 7 and compared with starting weight. (D) Mice were scored for outward signs of disease, including weight loss, hunched posture, ruffled fur, bloody stools, and rectal prolapse. (E) Distal colon sections from mice after 7 days of DSS were scored for pathologic changes, including erosion of the epithelial layer, leukocyte infiltration, submucosal swelling, muscularis mucosae hyperplasia, and increased vascularization. (F) Colons from mice euthanized after 7 days of DSS were measured for distance (centimeters) from the distal end of the cecum to the rectum. Symbols indicate genotypes and treatment: (∇) KO mice transfused with WT platelets, n = 8; and (♦) KO mice transfused with KO platelets, n = 8. Data are reported as mean ± SEM. *P < .05; **P < .01.
Figure 5.
Figure 5.
Platelet HYAL2 regulates serum inflammatory cytokines and inflammatory leukocyte infiltration in mice with DSS-induced colitis. Serum isolated from DSS-treated and control mice at 7 days was tested for (A) TNF-α and (B) IL-6 by using an enzyme-linked immunosorbent assay. (C) F4/80-positive area expressed as the percentage of total area. (D) Ly6G-positive area expressed as the percentage of total area. (E) MPO activity was measured in distal colon lysates of untreated and DSS-treated mice with or without platelet transfusion at 7 days. Data are reported as mean ± SEM; n = 10 mice per group. *P < .05; **P < .01; ***P < .001.
Figure 6.
Figure 6.
Microvascular permeability is increased in mice with DSS-induced colitis with HYAL2-deficient platelets. (A) Distal colon sections from mice treated with 2.5% DSS for 7 days with or without transfusion of platelets were evaluated for HA-HC by immunostaining for HA (green) and the HCs of IαI (red) and counterstained with 4′,6-diamidino-2-phenylindole for nuclei. L denotes the lumen. Lower panels show the submucosal regions at higher magnification. Images are representative of at least 8 mice. (B) Measurement of HA levels in colon tissue from control, DSS-treated mice, and DSS-treated mice receiving platelets. (C) Quantification of colocalization of HA with HCs of IαI as a measurement of HA-HC deposition. (D) Measurement of EB extracted from distal colon tissue of mice treated with or without 2.5% DSS. Data are reported as mean ± SEM; n = 10 mice per group. *P < .05; **P < .01; ***P < .001. Imaging, detection, and software details: TCS SP5 II confocal/multiphoton high-speed upright microscope, HCX PL APO 40X/1.25NA oil immersion objective, HyD system detector, and LAS AF software (all Leica Biosystems). Pearson’s correlation coefficients were obtained by analyzing individual images (layers) of the Z-stack with Image-Pro Plus software.
Figure 7.
Figure 7.
Platelet HYAL2 regulates trans-endothelial PBMC migration. (A) Representative microvessels present in colon tissues isolated from non-IBD control subjects, patients with IBD, and WT or HYAL2 KO mice subjected to DSS-induced colitis were evaluated for HA-HC by immunostaining for HA (green) and the HCs of IαI (red) and counterstained with 4′,6-diamidino-2-phenylindole for nuclei. Arrows indicate HA glycocalyx structures extending from the vessel surface. (B) Quantitative real-time polymerase chain reaction analysis of HYAL2 expression of HIMECs isolated from non-IBD and IBD patient surgical specimens (n = 8 each; **P < .01). (C) Representative immunoblots analyzing HYAL2 levels in HIMECs isolated from non-IBD and IBD patient surgical specimens (n = 8 each). Lysates were normalized to total protein (25 µg), and glyceraldehyde-3-phosphate dehydrogenase (GAPDH) was used as a loading control. (D) HIMECs were cultured with or without TNF‐α for 16 hours and evaluated for HYAL2 by using immunoblot over multiple passages. (E) HIMECs were seeded on permeable supports (3 μm pore size) placed into a 24-well plate, and grown to confluence. HIMECs were treated with or without TNF‐α for 16 hours at 37°C to promote leukocyte-adhesive HA-HC formation. Following activation, HIMECs were incubated in the presence or absence of nonactivated freshly isolated human platelets (100 × 106 per well) for 1 hour at 37°C. In some experiments, HIMECs were treated with Streptomyces hyaluronidase or with platelets preincubated with an HYAL2-blocking antibody as indicated. CCL5 (100 ng/mL) was added to the bottom well, and Calcein AM–labeled PBMCs (1 × 10⁶ per well) were added to the upper chamber. (F) HIMECs were cultured with or without TNF-α to induce HA-HC formation on the cell surface. Cultures were then washed and incubated in the presence or absence of platelets as indicated. HA released into the media was measured by using an enzyme-linked immunosorbent assay–like method, and the data represent 3 independent experiments. (G) TNF-α–stimulated HIMECs were pretreated with platelets isolated from IBD platelets or non-IBD control subjects before PBMC trans-endothelial migration. Data are reported as mean ± SEM; n = 4 independent experiments of at least 6 patients each. Values with different alphabetical superscripts are significantly different from each other (P < .05); *P < .05. Image, detection, and software details: TCS SP5 II confocal/multi-photon high-speed upright microscope, HCX PL APO ×40/1.25NA oil immersion objective, HyD system detector, and LAS AF software (all Leica Biosystems). Scale bar: 25 µm. Data acquisition details: Calcein AM–labeled PBMCs were detected in the lower wells with an automated Leica DM inverted microscope at 20× magnification set to well-scan mode. PBMCs were enumerated on the basis of fluorescence and size by using Image-Pro Plus acquisition software.

References

    1. de Souza HS, Fiocchi C. Immunopathogenesis of IBD: current state of the art. Nat Rev Gastroenterol Hepatol. 2016;13(1):13-27. - PubMed
    1. Lees CW, Barrett JC, Parkes M, Satsangi J. New IBD genetics: common pathways with other diseases. Gut. 2011;60(12):1739-1753. - PubMed
    1. Fiocchi C. Intestinal inflammation: a complex interplay of immune and nonimmune cell interactions. Am J Physiol. 1997;273(4):G769-G775. - PubMed
    1. Danese S, Motte Cd CL, Fiocchi C. Platelets in inflammatory bowel disease: clinical, pathogenic, and therapeutic implications. Am J Gastroenterol. 2004;99(5):938-945. - PubMed
    1. Ware J, Corken A, Khetpal R. Platelet function beyond hemostasis and thrombosis. Curr Opin Hematol. 2013;20(5):451-456. - PMC - PubMed

Publication types