. 2019 Jul 16;116(29):14734-14739.
doi: 10.1073/pnas.1906169116. Epub 2019 Jul 1.

Epistasis between antibiotic tolerance, persistence, and resistance mutations

Affiliations

Epistasis between antibiotic tolerance, persistence, and resistance mutations

Irit Levin-Reisman et al. Proc Natl Acad Sci U S A. .

Abstract

Understanding the evolution of microorganisms under antibiotic treatments is a burning issue. Typically, several resistance mutations can accumulate under antibiotic treatment, and the way in which resistance mutations interact, i.e., epistasis, has been extensively studied. We recently showed that the evolution of antibiotic resistance in Escherichia coli is facilitated by the early appearance of tolerance mutations. In contrast to resistance, which reduces the effectiveness of the drug concentration, tolerance increases resilience to antibiotic treatment duration in a nonspecific way, for example when bacteria transiently arrest their growth. Both result in increased survival under antibiotics, but the interaction between resistance and tolerance mutations has not been studied. Here, we extend our analysis to include the evolution of a different type of tolerance and a different antibiotic class and measure experimentally the epistasis between tolerance and resistance mutations. We derive the expected model for the effect of tolerance and resistance mutations on the dynamics of survival under antibiotic treatment. We find that the interaction between resistance and tolerance mutations is synergistic in strains evolved under intermittent antibiotic treatment. We extend our analysis to mutations that result in antibiotic persistence, i.e., to tolerance that is conferred only on a subpopulation of cells. We show that even when this population heterogeneity is included in our analysis, a synergistic interaction between antibiotic persistence and resistance mutations remains. We expect our general framework for the epistasis in killing conditions to be relevant for other systems as well, such as bacteria exposed to phages or cancer cells under treatment.

Keywords: antibiotic persistence; antimicrobials; evolution of resistance; killing assay; synergy.


Conflict of interest statement

Conflict of interest statement: N.Q.B. and B.R.L. are coauthors on a Consensus Statement [Nature Rev. Microbiol. 17, 441–448 (2019) doi: 10.1038/s41579-019-0196-3].

Figures
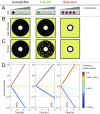
Fig. 1.
Fig. 1.
A schematic illustration of the differences between wt, tolerant, and resistant strains. (A) The minimum inhibitory concentration (MIC) measured in gradually increasing concentration of antibiotics, identifying the minimum concentration that prevents growth. The wt and tolerant strains have the same MIC, while the resistant strain has a higher MIC. (B) Illustration of the disk diffusion assay. The black circle is the inhibition zone, where bacteria cannot grow, and indicates the MIC. The wt and tolerant strains have the same MIC, whereas the resistant strain, which has a smaller inhibition zone, has a higher MIC. (C) Illustration of the tolerance detection test (TDtest) performed after the disk diffusion assay (46): Once the antibiotic has diffused away from the inhibition zone, growth of surviving bacteria can be seen by adding glucose to the now empty disks. Only the tolerant bacteria have survived this duration of antibiotic treatment and can now form new colonies. Note that this phenotype is distinct from heteroresistance, where colony growth in the inhibition zone would occur already in B (before adding glucose). (D) Schematic survival curves of the wt, tolerant, and resistant strains at different treatment concentrations. When the concentration is zero, all strains grow. When the treatment is at C = MICwt = MICTol, the wt and the tolerant strains neither grow nor die, but the resistant strain can grow. When the treatment is at C > MICres all strains are killed but at different rates. When the treatment is at C >> MICres the wt and the resistant strains are killed at similar rates, but the tolerant strain dies slower. The slower death rate at high concentrations is quantified by the MDK99 (3).
Fig. 2.
Fig. 2.
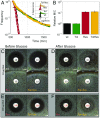
Phenotypic characterizations of the wt (KLY), single mutants, and double mutants for resistance and tolerance. (A) ScanLag analysis of the lag time distribution, presented as the fraction of colonies not yet detected when plated on antibiotic-free medium. The tolerant (green) and resistant + tolerant (yellow) strains have prolonged lag, relative to the wt (black) and resistant (red) strains. (Inset) The same data showed as appearance distributions with log(Time) x axis. Note that the tolerant mutants in this example have a bimodal distribution of lag time, leading to persistence. (B) The relative MIC, as measured with antibiotic serial dilution method. (C) Resistance visualization using the disk diffusion assay with 10-µg-ampicillin disks. (D) Tolerance visualization with the TDtest (46), see Fig. 1D. (E) Scaling of the resistance level with MIC. Same as C and D, but with a 10-fold higher amount of ampicillin. Note that the inhibition zone of the wt with 10 µg ampicillin is similar to that of the resistant mutant with 100 µg ampicillin. (F) After the TDtest: the tolerant + resistant strain can be distinguished by the higher survival in the inhibition zone, as in D.
Fig. 3.
Fig. 3.
Experimental results of the fitness of each mutation separately as well as the double mutants for two evolved strains. Bacteria were evolved by cyclic exposure at lag phase, resulting first in tolerance by lag and eventually in resistance. The bar graph shows the measured survival fraction (blue) of each of the two mutants—KLY E1 (A) and MGY E7 (B), and the expected survival (red) calculated with the product model or the Zhi model. The higher survival fraction in the experimental data shows that tolerance and resistance have mild positive epistatic interactions according to the product model. Error bars denote the SE. Tolerant, resistant, and tolerant + resistant mutants are denoted as Tol, Res, and TolRes, respectively. The expected survival from the product model and the Zhi model are denoted as Product and Zhi, respectively.
Fig. 4.
Fig. 4.
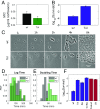
Characterization of tolerance-by-slow-growth mutant. (A) MIC of the tolerant mutant (MGCHT), no significant difference from that of the wt (P = 0.5, n = 4). (B) Higher survival of the tolerant mutant under norfloxacin (P = 0.03, n = 4). (C) Phase-contrast microscopy images of the ancestral and tolerant-by-slow-growth mutant (scale bar: 10 µm). (D and E) Data extracted from microscopy assay, using (monolayer) microcolony area as a proxy for biomass. Lag time is similar (P = 0.9, n = 60), while doubling time is significantly different (P = 5e-10, n = 60). (F) Epistasis between the tolerance and resistance mutations. The higher survival fraction in the experimental data shows that these tolerance-by-slow-growth and resistance mutations also have mild positive epistatic interactions, according to the product model (P = 0.05, n = 3). Tolerant, resistant, and tolerant + resistant mutants are denoted as Tol, Res, and TolRes, respectively. The expected survival from the product model and the Zhi model are denoted as Product and Zhi, respectively.
Fig. 5.
Fig. 5.
Effect of persistence on epistasis. (A) Killing curve assay of the KLY wt (black) and high antibiotic persistence (green) strains. Persistence level can be observed in both, but is 2 orders of magnitude higher in the mutant. (B) Survival of the double mutant as measured experimentally (blue) and calculated (red). The expected survival from the product model is calculated as in Fig. 3. The expected survival with evolved high persistence correction (persistence correction [mutant]) is significantly lower than the expected survival calculated by the product model with the same survival rates (P = 0.03, n = 6). In this case the synergistic interaction is even stronger. This strain also has low basal amount of persistence in the wt and the resistant. If we take into consideration that the wt and the resistant survival is slightly higher because of the persistence, we can subtract it and then calculate the expected survival of the double mutant with wt persistence correction (persistence correction [wt]).
Fig. 6.
Fig. 6.
Mutating from partial resistance to full resistance on a tolerant ancestral background. A schematic diagram of the evolved mutations. The black circle represents the wt strain, which acquired a tolerance mutation (MGY prsT) (green circle). This strain then acquired a partial resistance mutation (point mutation in ampC region) resulting in a twofold increase in MIC (red dot in the green circle). Partial resistance was then followed by full resistance by an additional mutation in the ampC promoter (green circle filled with red).

References

    1. Lewis K., Persister cells, dormancy and infectious disease. Nat. Rev. Microbiol. 5, 48–56 (2007). - PubMed
    1. Levin B. R., Rozen D. E., Non-inherited antibiotic resistance. Nat. Rev. Microbiol. 4, 556–562 (2006). - PubMed
    1. Brauner A., Fridman O., Gefen O., Balaban N. Q., Distinguishing between resistance, tolerance and persistence to antibiotic treatment. Nat. Rev. Microbiol. 14, 320–330 (2016). - PubMed
    1. Scholar E. M., Pratt W. B., The Antimicrobial Drugs (Oxford University Press, 2000).
    1. Andrews J. M., Determination of minimum inhibitory concentrations. J. Antimicrob. Chemother. 48 (suppl. 1), 5–16 (2001). Erratum in: J. Antimicrob. Chemother.49, 1049 (2002). - PubMed

Publication types

MeSH terms

Substances