. 2019 Jul 16;116(29):14606-14613.
doi: 10.1073/pnas.1903764116. Epub 2019 Jul 1.

Mapping the native organization of the yeast nuclear pore complex using nuclear radial intensity measurements

Affiliations

Mapping the native organization of the yeast nuclear pore complex using nuclear radial intensity measurements

Pascal Vallotton et al. Proc Natl Acad Sci U S A. .

Abstract

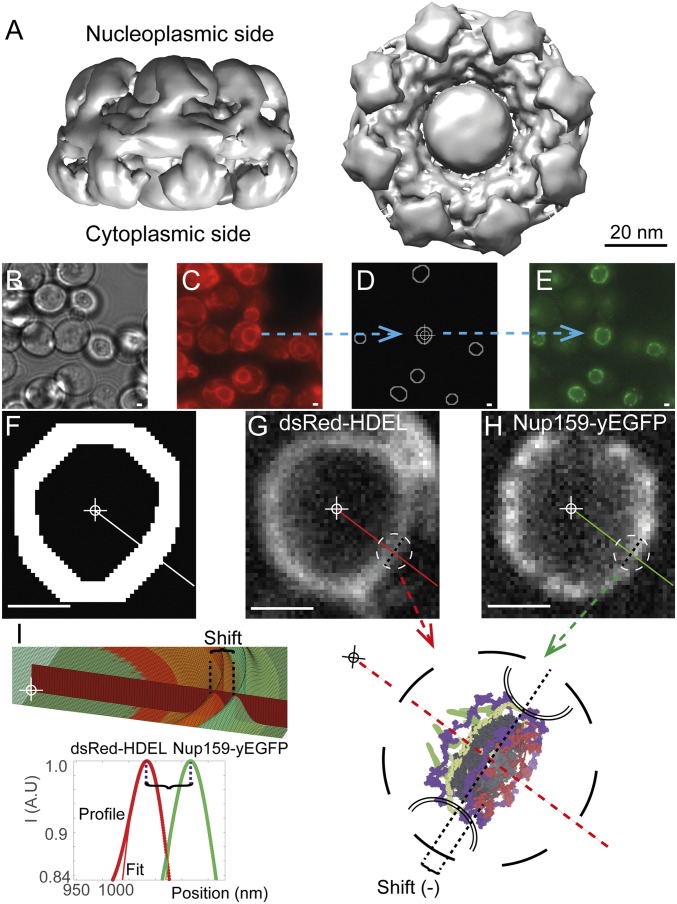
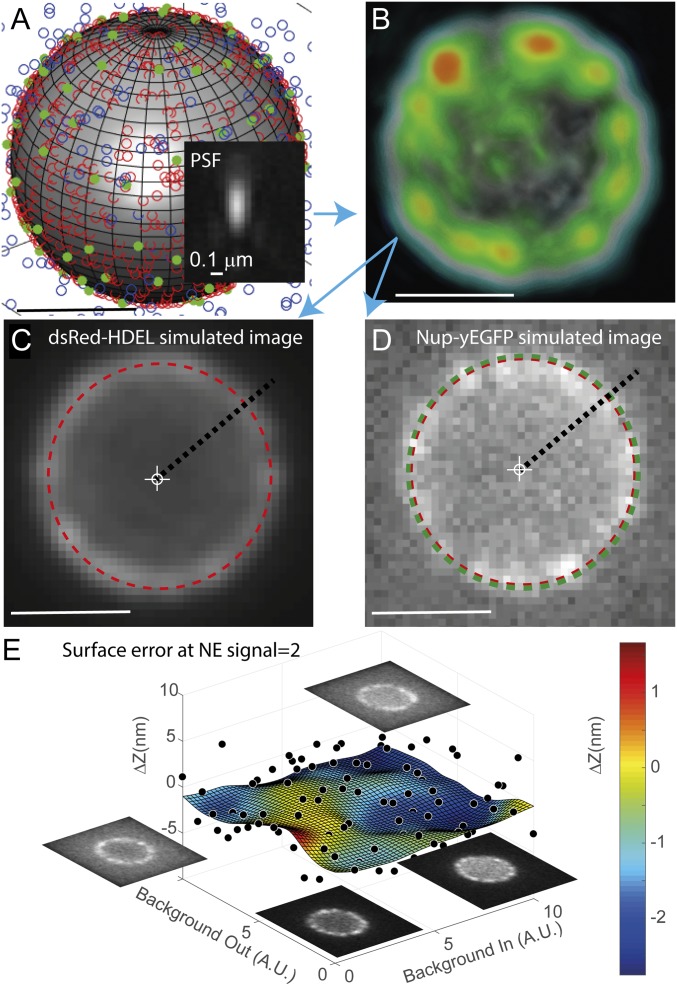
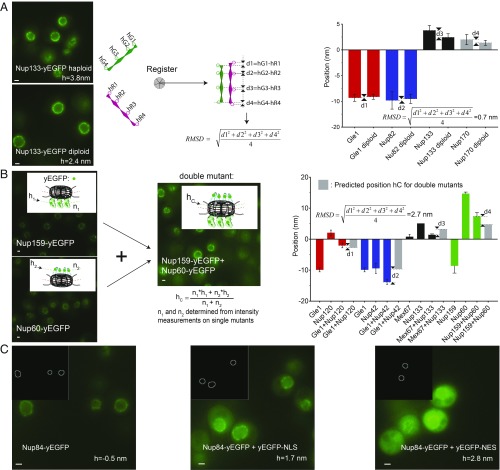
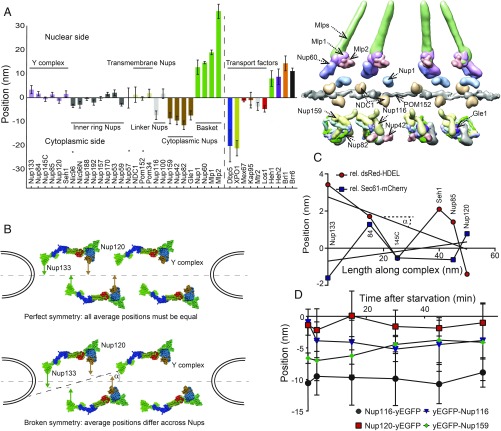
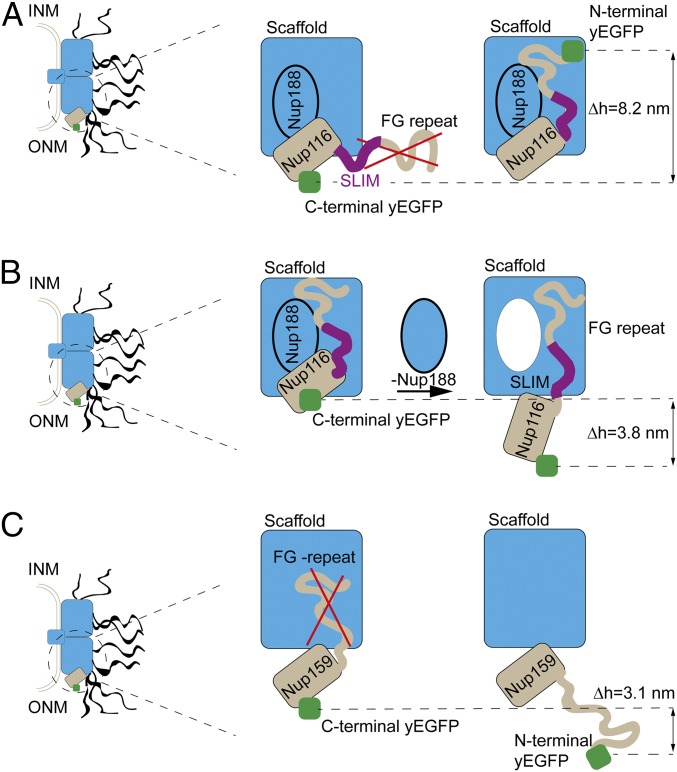
Selective transport across the nuclear envelope (NE) is mediated by the nuclear pore complex (NPC), a massive ∼100-MDa assembly composed of multiple copies of ∼30 nuclear pore proteins (Nups). Recent advances have shed light on the composition and structure of NPCs, but approaches that could map their organization in live cells are still lacking. Here, we introduce an in vivo method to perform nuclear radial intensity measurements (NuRIM) using fluorescence microscopy to determine the average position of NE-localized proteins along the nucleocytoplasmic transport axis. We apply NuRIM to study the organization of the NPC and the mobile transport machinery in budding yeast. This reveals a unique snapshot of the intact yeast NPC and identifies distinct steady-state localizations for various NE-associated proteins and nuclear transport factors. We find that the NPC architecture is robust against compositional changes and could also confirm that in contrast to Chlamydomonas reinhardtii, the scaffold Y complex is arranged symmetrically in the yeast NPC. Furthermore, NuRIM was applied to probe the orientation of intrinsically disordered FG-repeat segments, providing insight into their roles in selective NPC permeability and structure.

Keywords: FG repeats; nuclear pore complex; nucleoporins; quantitative fluorescence microscopy; superresolution.


Conflict of interest statement

The authors declare no conflict of interest.

Figures

Fig. 1.
Fig. 1.
Description of the NuRIM method. (A) State-of-the-art electron density map of the yeast NPC adapted from the work of Kim et al. (5) introduces salient features of the NPC including a central channel permeated by a central “transporter,” framed by the NPC core. UCSF Chimera software was used to display a density map at the recommended threshold of 0.015 (64). (B) Bright-field image of S. cerevisiae cells. (C) The luminal dsRed-HDEL reference is used for NE tracing. (D) Using automated image analysis, NEs are precisely outlined and their center is determined (cross-hair). (E) Nup-yEGFP channel allows quantifying Nup abundance and radial shift relative to the dsRed-HDEL reference channel. (F) Dilated NE traces restrict analysis to informative area only. (GI) Lines from the nuclear center intersect the NE. Intensity profiles along these lines are then fitted with Gaussian functions, allowing the measurement of the radial shift of a given Nup, for example, Nup159-yEGFP (green) against the dsRed-HDEL reference profile along the same ray (red). Averaging thousands of such differential measurements delivers structural information on NPC architecture with nanoscale accuracy (SI Appendix). (Scale bars, 1 μm.)
Fig. 2.
Fig. 2.
Testing NuRIM’s theoretical accuracy using simulated data. (A) Point-like NPCs (green solid dots) and reference fiduciary markers (red open dots) are distributed on the NE, itself modeled as a sphere. Variable levels of confounding fluorescence are introduced inside and outside the NE (blue open dots). (B) Convolution with a realistic point spread function (PSF) yields 3D diffraction-limited stacks (a 3D rendering of the NE is shown). (C and D) Single Z slices sampled from the simulated image volumes. Small transverse shifts in the distributions of NPCs away from the NE lead to measurable subpixel shifts in the simulated images (red and green dashed circles). (E) Over 10 million simulated images were generated under variable background conditions. The plot shows the error made by NuRIM when recovering the ground-truth shift for an NE signal level corresponding to nucleoporins. Black dots represent average shift error for batches of 64 simulated images. The fitting surface was obtained using neural network training, thus yielding estimates of bias error in any background conditions. These small bias errors are subsequently subtracted from experimental values to obtain adjusted positions (SI Appendix and SI Appendix, Fig. S1). (Scale bars, 1 μm.)
Fig. 3.
Fig. 3.
Testing the accuracy of NuRIM. (A) Haploid nuclei are smaller than diploid nuclei, but the recovered Nup positions in both cases were highly consistent (pairwise rmsd = 0.7 nm; error bars always represent the SEM except when stated). Schematics illustrates the general notion of the pairwise rmsd serving to assess the accuracy of structural methods. (B) Another strategy to test NuRIM accuracy was to compare the predicted average positions for double mutants with the positions actually measured (pairwise rmsd = 2.7 nm). (C) To test NuRIM’s robustness against variations in background fluorescence, soluble yEGFP-NES and yEGFP-NLS were overexpressed on top of Nup84-yEGFP (pairwise rmsd = 2.4 nm) (36). (Scale bars, 1 μm.)
Fig. 4.
Fig. 4.
NuRIM delivers structural information on native pores. (A) The average positions along the nucleocytoplasmic axis were determined for most Nups and transport factors. Strains that showed any evidence of tag interference are indicated by an asterisk. For comparison, selected Nup probability densities from the integrative NPC model of Kim et al. (5) are displayed using UCSF Chimera software (see also Table 2). (B) A fully symmetric arrangement of the Y complex across the NE plane must lead to equal average values for all Y-complex Nups (hypothetical arrangements are shown). (C) Successive NuRIM positions of the Nups along the long axis of the Y complex resulted in a linear regression angle α of only 3 ± 2°, thus providing little evidence for asymmetry. (D) Upon acute glucose starvation, no large-scale changes were observed for either Nup116-yEGFP or Nup120-yEGFP but yEGFP tags at the extremity of FG repeats appeared to converge. Error bars represent the SEM.
Fig. 5.
Fig. 5.
Characterizing FG repeats using NuRIM. (A) Comparing results from C-terminal versus N-terminal tagging of Nup116 revealed that the flexible region of Nup116 (including both its FG-repeat region and a short linear interaction motif [SLIM]) are directed on average toward the core scaffold Nup188 (Δh = 8.2 ± 3.1 nm). INM and ONM indicate the inner and outer nuclear membranes, respectively. (B) Repressing the scaffold Nup188 led to a partial release of Nup116 toward the cytoplasm (Δh = 3.8 ± 0.5 nm) (see also figure 4G in ref. 20). (C) Comparing the positions of C-terminally versus N-terminally tagged Nup159 confirms the view that cytoplasmic-facing FG Nups more typically protrude into the cytoplasm (Δh = 3.1 ± 2.2 nm).

References

    1. Beck M., Hurt E., The nuclear pore complex: Understanding its function through structural insight. Nat. Rev. Mol. Cell Biol. 18, 73–89 (2017). - PubMed
    1. Rout M. P., et al. , The yeast nuclear pore complex: Composition, architecture, and transport mechanism. J. Cell Biol. 148, 635–651 (2000). - PMC - PubMed
    1. Simon D. N., Rout M. P., Cancer and the nuclear pore complex. Adv. Exp. Med. Biol. 773, 285–307 (2014). - PubMed
    1. Sakuma S., D’Angelo M. A., The roles of the nuclear pore complex in cellular dysfunction, aging and disease. Semin. Cell Dev. Biol. 68, 72–84 (2017). - PMC - PubMed
    1. Kim S. J., et al. , Integrative structure and functional anatomy of a nuclear pore complex. Nature 555, 475–482 (2018). - PMC - PubMed

Publication types

MeSH terms

Substances

LinkOut - more resources