. 2019 Jun 13:10:727.
doi: 10.3389/fpls.2019.00727. eCollection 2019.

Meta-Analysis of the QTLome of Fusarium Head Blight Resistance in Bread Wheat: Refining the Current Puzzle

Affiliations

Meta-Analysis of the QTLome of Fusarium Head Blight Resistance in Bread Wheat: Refining the Current Puzzle

Eduardo Venske et al. Front Plant Sci. .

Abstract

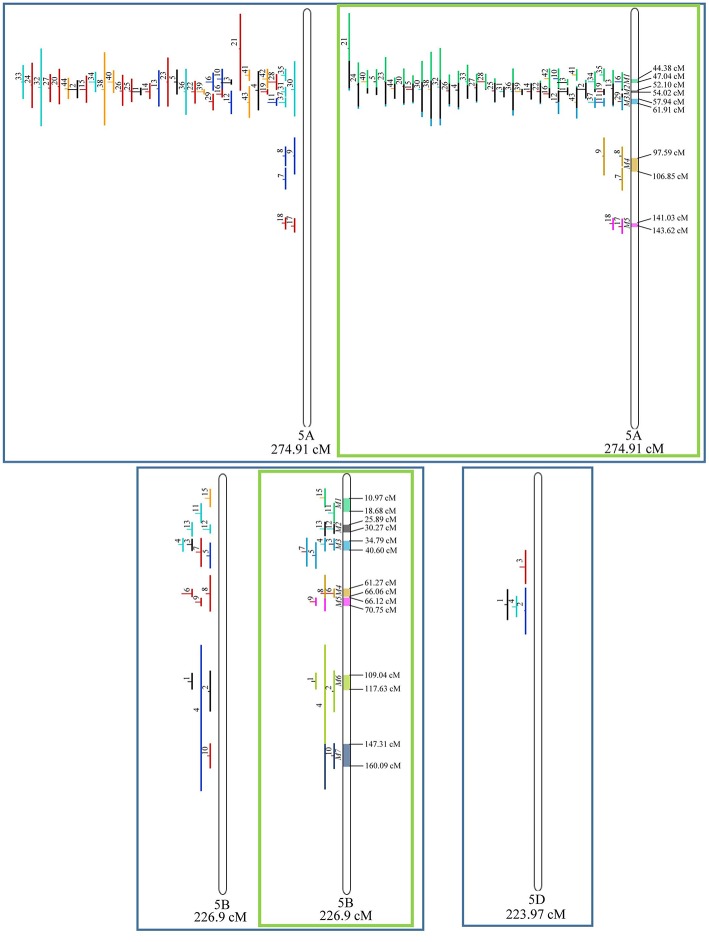
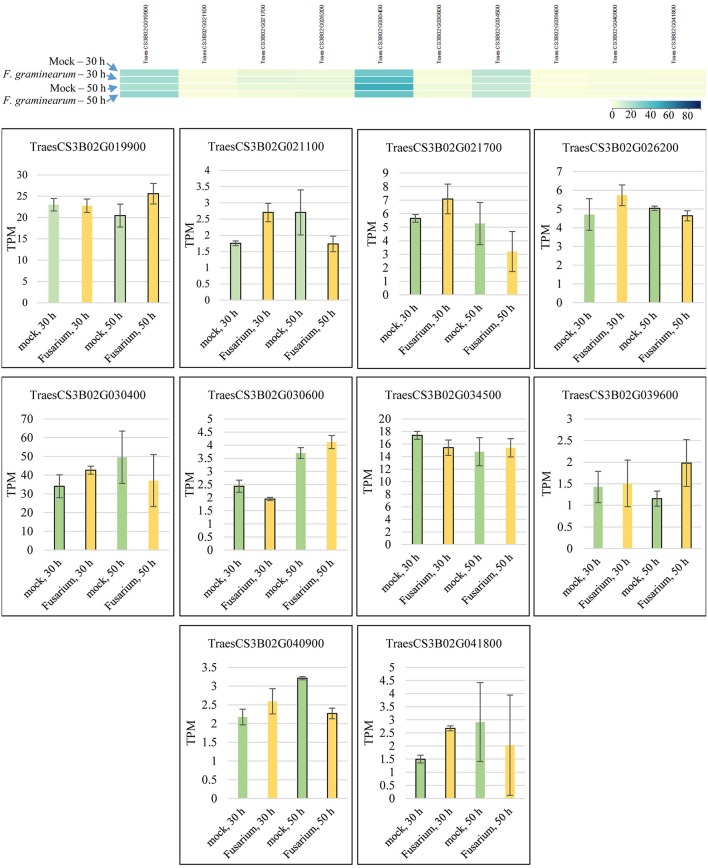
Background: Fusarium Head Blight (FHB) is a worldwide devastating disease of bread wheat (Triticum aestivum L.). Genetic resistance is the most effective way to control FHB and many QTL related to this trait have been mapped on the wheat genetic map. This information, however, must be refined to be more efficiently used in breeding programs and for the advance of the basic research. The objective of the present study was to in-depth analyze the QTLome of FHB resistance in bread wheat, further integrating genetic, genomic, and transcriptomic data, aiming to find candidate genes. Methods: An exhaustive bibliographic review on 76 scientific papers was carried out collecting information about QTL related to FHB resistance mapped on bread wheat. A dense genetic consensus map with 572,862 loci was generated for QTL projection. Meta-analysis could be performed on 323 QTL. Candidate gene mining was carried out within the most refined loci, containing genes that were cross-validated with publicly available transcriptional expression data of wheat under Fusarium infection. Most highlighted genes were investigated for protein evidence. Results: A total of 556 QTL were found in the literature, distributed on all sub-genomes and chromosomes of wheat. Meta-analysis generated 65 meta-QTL, and this refinement allows one to find markers more tightly linked to these regions. Candidate gene mining within the most refined meta-QTL, meta-QTL 1/chr. 3B, harvested 324 genes and transcriptional data cross-validated 10 of these genes, as responsive to FHB. One is of these genes encodes a Glycosiltransferase and the other encodes for a Cytochrome P450, and these such proteins have already been verified as being responsible for FHB resistance, but the remaining eight genes still have to be further studied, as promising loci for breeding. Conclusions: The QTLome of FHB resistance in wheat was successfully assembled and a refinement in terms of number and length of loci was obtained. The integration of the QTLome with genomic and transcriptomic data has allowed for the discovery of promising candidate genes for use in breeding programs.

Keywords: bioinformatics; genetic architecture; genetic maps; genome; meta-QTL; molecular markers; transcriptome.


Figures

Figure 1
Figure 1
Flow diagram of the systematic review and QTL meta-analysis applied in this study, which further incorporated genomic and transcriptomic publicly available data.
Figure 2
Figure 2
QTL related to FHB resistance in wheat published from 1999 to 2017, classified according the type of resistance they confer and the sub-genome and chromosome of occurrence.
Figure 3
Figure 3
Projection (left) and, with green borders meta-QTL of FHB resistance in wheat for chr. 1A, 1B, and 1D. In the projection, the colors of the QTL means: black, type I resistance; red, type II; blue, type I and II combined; green, type III; orange, type IV. In the meta-analysis, the colors both in the QTL and inside the linkage groups only mean the different meta-QTL generated and how each QTL contributed to the formation of it. Numbering of the meta-QTL is located to the left side of the linkage group and to the right side is indicated the genetic distance which comprise these loci. The molecular markers and their positions are omitted in the figures for better visualization. The line in the middle of each QTL represents the LOD score of it in the original work.
Figure 4
Figure 4
Projection (left) and, with green borders meta-QTL of FHB resistance in wheat for chr. 2A, 2B, and 2D. The color system and numbering follows the same as Figure 3.
Figure 5
Figure 5
Projection (left) and, with green borders meta-QTL of FHB resistance in wheat for chr. 3A, 3B, and 3D. The color system follows the same as Figure 3. The meta-QTL 1 in 3B was selected for gene mining.
Figure 6
Figure 6
Projection (left) and, with green borders meta-QTL of FHB resistance in wheat for chr. 4A, 4B, and 4D. The color system follows the same as Figure 3.
Figure 7
Figure 7
Projection (left) and, with green borders meta-QTL of FHB resistance in wheat for chr. 5A, 5B, and 5D. The color system follows the same as Figure 3.
Figure 8
Figure 8
Projection (left) and, with green borders meta-QTL of FHB resistance in wheat for chr. 6A, 6B, and 6D (only projection). The color system follows the same as Figure 3.
Figure 9
Figure 9
Projection (left) and, with green borders meta-QTL of FHB resistance in wheat for chr. 7A, and only projection for 7B and 7D. The color system follows the same as Figure 3.
Figure 10
Figure 10
Transcriptional expression of candidate genes mined within the meta-QTL 1/3B, using publically available transcriptional data of wheat spike tissues (Kugler et al., 2013), after Fusarium graminearum inoculation and control (mock) conditions in the resistant variety CM-82036. TPM, transcripts per million.

References

    1. Abate Z. A., Liu S., McKendry A. L. (2008). Quantitative trait loci associated with deoxynivalenol content and kernel quality in the soft red winter wheat ‘Ernie’. Crop Sci. 48, 1408–1418. 10.2135/cropsci2007.07.0411 - DOI
    1. Akbari M., Wenzl P., Caig V., Carling J., Xia L., Yang S., et al. . (2006). Diversity arrays technology (DArT) for high-throughput profiling of the hexaploid wheat genome. Theor. Appl. Genet. 113, 1409–1420. 10.1007/s00122-006-0365-4 - DOI - PubMed
    1. Anderson J. A., Stack R. W., Liu S., Waldron B. L., Fjeld A. D., Coyne C., et al. (2001). DNA markers for Fusarium head blight resistance QTL in two wheat populations. Theor. Appl. Genet. 102, 1164–1168. 10.1007/s001220000509 - DOI
    1. Arcade A., Labourdette A., Falque M., Mangin B., Chardon F., Charcosset A., et al. . (2004). BioMercator: integrating genetic maps and QTL towards discovery of candidate genes. Bioinformatics 20, 2324–2326. 10.1093/bioinformatics/bth230 - DOI - PubMed
    1. Arruda M. P., Brown P., Brown-Guedira G., Krill A. M., Thurber C., Merrill K. R., et al. . (2016). Genome-wide association mapping of Fusarium head blight resistance in wheat using genotyping-by-sequencing. Plant Genome 9, 1–14. 10.3835/plantgenome2015.04.0028 - DOI - PubMed

Publication types

LinkOut - more resources