. 2019 Jun 26:7:18.
doi: 10.1038/s41413-019-0056-9. eCollection 2019.

Extracellular vesicles from human urine-derived stem cells prevent osteoporosis by transferring CTHRC1 and OPG

Affiliations

Extracellular vesicles from human urine-derived stem cells prevent osteoporosis by transferring CTHRC1 and OPG

Chun-Yuan Chen et al. Bone Res. .

Abstract

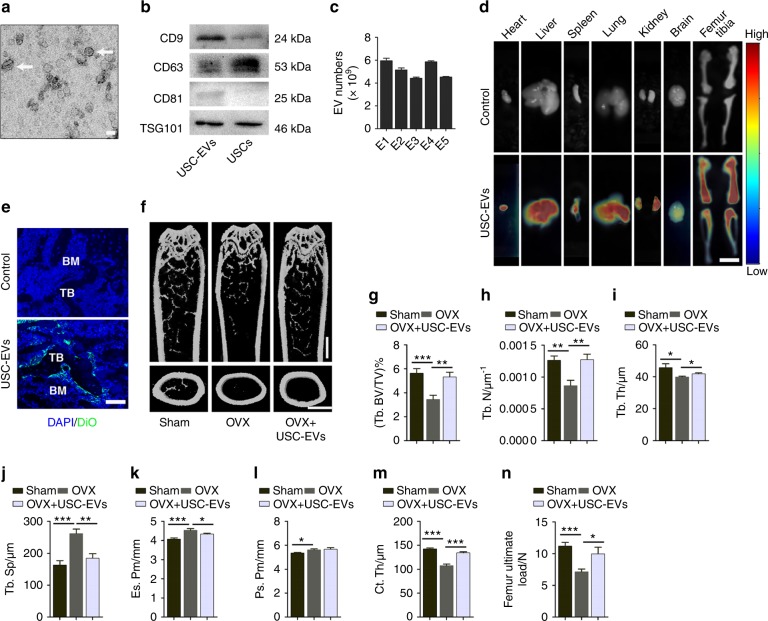
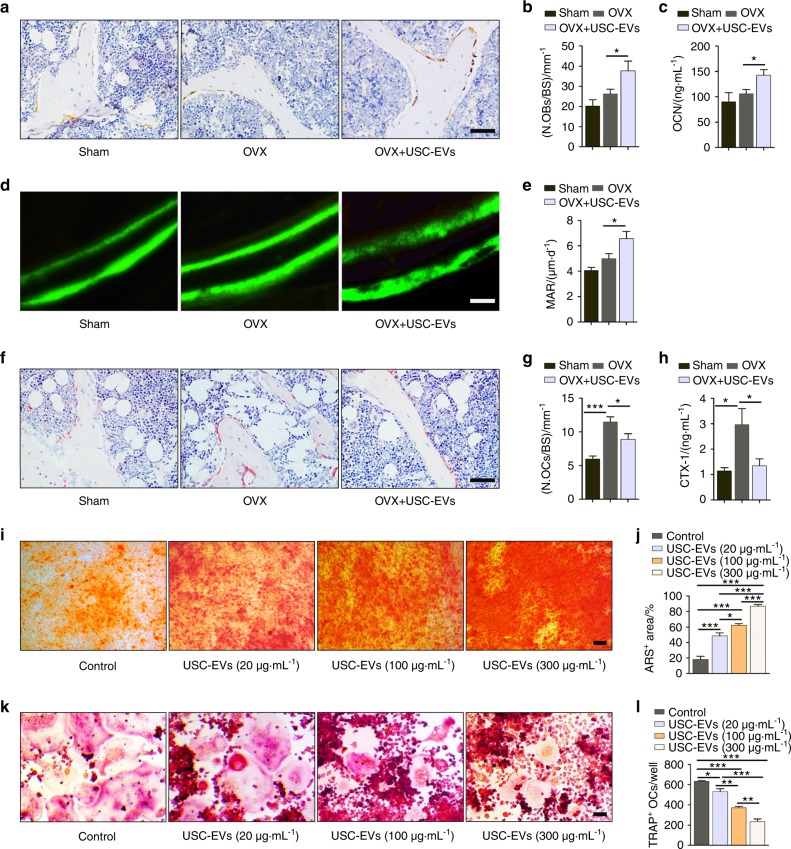
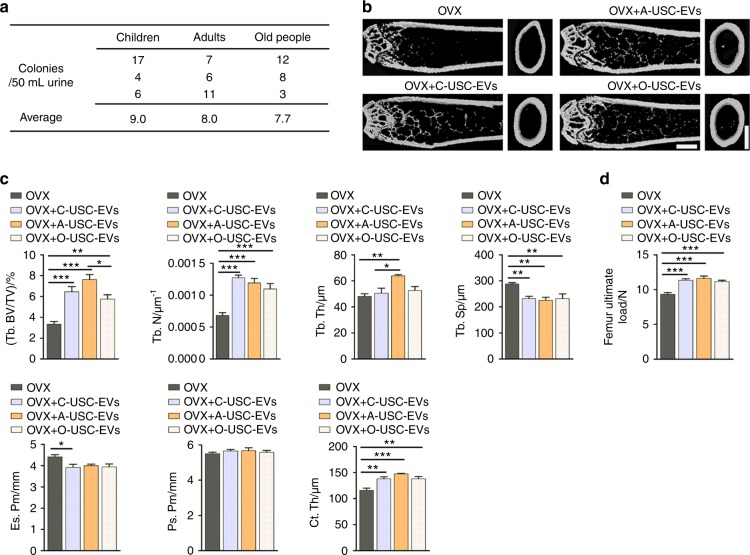
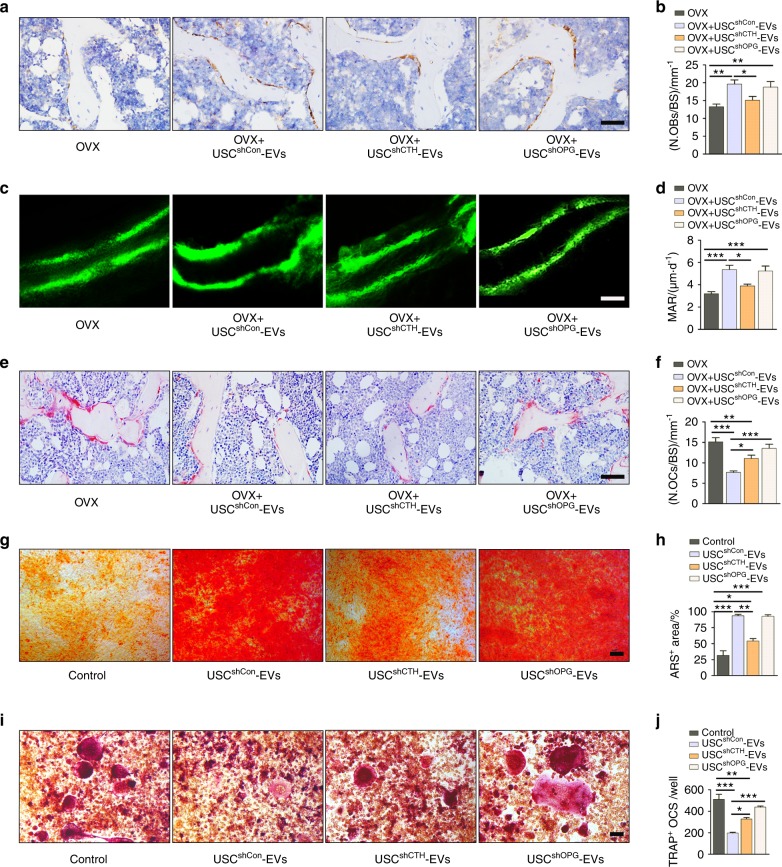
Osteoporosis is a debilitating bone disease affecting millions of people. Here, we used human urine-derived stem cells (USCs), which were noninvasively harvested from unlimited and easily available urine, as a "factory" to obtain extracellular vesicles (USC-EVs) and demonstrated that the systemic injection of USC-EVs effectively alleviates bone loss and maintains bone strength in osteoporotic mice by enhancing osteoblastic bone formation and suppressing osteoclastic bone resorption. More importantly, the anti-osteoporotic properties of USC-EVs are not notably disrupted by the age, gender, or health condition (with or without osteoporosis) of the USC donor. Mechanistic studies determined that collagen triple-helix repeat containing 1 (CTHRC1) and osteoprotegerin (OPG) proteins are enriched in USC-EVs and required for USC-EV-induced pro-osteogenic and anti-osteoclastic effects. Our results suggest that autologous USC-EVs represent a promising novel therapeutic agent for osteoporosis by promoting osteogenesis and inhibiting osteoclastogenesis by transferring CTHRC1 and OPG.

Keywords: Osteoporosis.


Conflict of interest statement

Competing interestsThe authors declare no competing interests.

Figures

Fig. 1
Fig. 1
USC-EVs are transported to the bone to enhance bone mass and strength in OVX-induced osteoporotic mice. a Morphology of USC-EVs under transmission electron microscopy. Scale bar: 50 nm. b Western blot analysis of exosomal markers in USC-EVs and USCs. c EV numbers of 100 μg USC-EVs from five different batches (E1, E2, E3, E4, and E5) were assessed by an EXOCET Exosome Quantitation kit. d Ex vivo fluorescent imaging of heart, liver, spleen, lungs, kidneys, brain, femurs, and tibias from vehicle-treated control OVX mice and OVX mice intravenously injected with the DiR-labeled USC-EVs for 3 h. Scale bar: 6 mm. e Fluorescence microscopy analysis of femur tissue sections from vehicle-treated OVX mice and OVX mice intravenously injected with the DiO-labeled USC-EVs for 3 h. TB: trabecular bone; BM: bone marrow. Scale bar: 50 µm. f Representative μCT images of femora. Scale bars: 1 mm. gm Quantitative μCT analysis of the trabecular bone volume fraction (Tb. BV/TV; g), trabecular number (Tb. N; h), trabecular thickness (Tb. Th; i), trabecular separation (Tb. Sp; j), endosteal perimeter (Es. Pm; k), periosteal perimeter (Ps. Pm; l), and cortical thickness (Ct. Th; m). n = 10 per group. n Three-point bending measurement of femur ultimate load. n = 5 per group. The data are shown as the mean ± SD. *P < 0.05, **P < 0.01, ***P < 0.001
Fig. 2
Fig. 2
USC-EVs promote osteogenesis and inhibit osteoclast formation. a, b Representative OCN immunohistochemical staining images (a) with quantification of the number of osteoblasts (N. OBs; b) on trabecular bone surface (BS) of femoral metaphysis. Scale bar: 50 μm. n = 3 per group. c ELISA of the serum concentration of OCN. n = 5 per group. d, e Representative images of calcein double labeling of trabecular bone (d) with quantification of mineral apposition rate (MAR; e). Scale bar: 25 μm. n= 3 per group. f, g Representative TRAP staining images (f) and quantitative analysis of the number of osteoclasts (N. OCs; g). Scale bar: 50 μm. n = 3 per group. h ELISA of the serum concentration of CTX-I. n = 5 per group. i, j Alizarin red S (ARS) staining of mineralized nodules of MSCs receiving different treatments under osteogenic inductive conditions (i). The percentages of ARS positively stained areas were measured (j). Scale bar: 100 μm. n = 3 per group. k, l Osteoclast differentiation of RAW264.7 cells visualized by TRAP staining (k). The numbers of TRAP+ multinucleated (> 3 nuclei) osteoclasts in each well of a 48-well plate were counted (l). Scale bar: 50 μm. n = 3 per group. The data are shown as the mean ± SD. *P < 0.05, **P < 0.01, ***P < 0.001
Fig. 3
Fig. 3
Multiple donor-derived USC-EVs are able to exert anti-osteoporotic effects on OVX mice. a The numbers of USC colonies obtained from three healthy children, three healthy adults and three old people (one healthy man and two postmenopausal osteoporotic women). b, c Representative μCT images (b) and quantitative μCT analysis of trabecular and cortical bone microarchitecture (c) in femora from Sham, OVX, OVX + Y-USC-EVs, OVX + A-USC-EVs, and OVX + O-USC-EVs mice. C: children; A: adults; O: old people. Scale bars: 1 mm. n = 7–10 per group. d Three-point bending measurement of femur ultimate load. n = 7–10 per group. The data are shown as the mean ± SD. *P < 0.05, **P < 0.01, ***P < 0.001
Fig. 4
Fig. 4
Multiple donor-derived USC-EVs are able to promote osteogenesis and inhibit osteoclast formation. a, b Representative images of OCN immunostaining (a) with quantification of the number of OBs (b). Scale bar: 50 μm. n = 3 per group. c, d Representative TRAP staining images (c) and quantitative analysis of the number of OCs (d). Scale bar: 50 μm. n = 3 per group. e The percentages of ARS positively stained areas in MSCs receiving different treatments under osteogenic inductive conditions. n = 3 per group. f Quantification of osteoclast formation in RAW264.7 cells receiving different treatments under osteoclastic induction. n = 3 per group. The data are shown as the mean ± SD. *P < 0.05, **P < 0.01, ***P < 0.001
Fig. 5
Fig. 5
Enrichment of pro-osteogenic and anti-osteoclastic proteins in USC-EVs. a When compared with USCs, USC-EVs were highly enriched in the proteins that are involved in the regulation of multiple biological processes related to bone formation and growth. C: USCs; E: USC-EVs. n = 3 per group. b The ratio of expression of a class of pro-osteogenic or/and anti-osteoclastic proteins in USC-EVs compared with that in USCs. n = 3 per group. c The upregulation of CTHRC1, OPG, and SFRP1 in USC-EVs relative to USCs was verified by western blotting. d Western blot analysis of the protein levels of CTHRC1 and OPG in USC-EVs and USCs from different donors
Fig. 6
Fig. 6
CTHRC1 and OPG contribute to USC-EV-induced increases in bone mass and strength. a The inhibitory efficiency of shRNAs targeting CTHRC1 and OPG was verified by qRT-PCR analysis. shCTH: shCTHRC1. b The deficiency of CTHRC1 and OPG in USC-EVs was verified by western blotting. c, d Representative μCT images (c) and quantitative μCT analysis of trabecular and cortical bone microarchitecture (d) in femora. USCshCTH-EVs: USCshCTHRC1 #4-EVs; USCshOPG-EVs: USCshOPG #4-EVs. Scale bars: 1 mm. n = 6–8 per group. e Three-point bending measurement of the femur ultimate load. n = 6–8 per group. The data are shown as the mean ± SD. *P < 0.05, **P < 0.01, ***P < 0.001
Fig. 7
Fig. 7
CTHRC1 and OPG contribute to the pro-osteogenic and anti-osteoclastic effects of USC-EVs. a, b Representative images of OCN immunostaining (a) with quantification of the number of OBs (b). Scale bar: 50 μm. n = 3 per group. c, d Representative images of calcein double labeling of trabecular bone (c) with quantification of MAR (d). Scale bar: 25 μm. n = 3 per group. e, f Representative TRAP staining images (e) and quantitative analysis of the number of OCs (f). Scale bar: 50 μm. n = 3 per group. g, h ARS staining of mineralized nodules of MSCs receiving different treatments (g). Scale bar: 100 μm. The percentages of ARS positively stained areas were measured (h). n = 3 per group. i, j Osteoclast differentiation of RAW264.7 cells visualized by TRAP staining (i). Scale bar: 50 μm. The numbers of TRAP+ osteoclasts per well were counted (j). n = 3 per group. The data are shown as the mean ± SD. *P < 0.05, **P < 0.01, ***P < 0.001

References

    1. Yu B, et al. Wnt4 signaling prevents skeletal aging and inflammation by inhibiting nuclear factor-kappaB. Nat. Med. 2014;20:1009–1017. doi: 10.1038/nm.3586. - DOI - PMC - PubMed
    1. Rao SS, et al. Omentin-1 prevents inflammation-induced osteoporosis by downregulating the pro-inflammatory cytokines. Bone Res. 2018;6:9. doi: 10.1038/s41413-018-0012-0. - DOI - PMC - PubMed
    1. Liu S, et al. MSC transplantation improves osteopenia via epigenetic regulation of Notch signaling in lupus. Cell Metab. 2015;22:606–618. doi: 10.1016/j.cmet.2015.08.018. - DOI - PMC - PubMed
    1. Lavasani M, et al. Muscle-derived stem/progenitor cell dysfunction limits healthspan and lifespan in a murine progeria model. Nat. Commun. 2012;3:608. doi: 10.1038/ncomms1611. - DOI - PMC - PubMed
    1. Kanada M, et al. Differential fates of biomolecules delivered to target cells via extracellular vesicles. Proc. Natl Acad. Sci. USA. 2015;112:E1433–E1442. - PMC - PubMed