. 2019 Jun 17:9:504.
doi: 10.3389/fonc.2019.00504. eCollection 2019.

Cooperation Between the Inflammation and Coagulation Systems Promotes the Survival of Circulating Tumor Cells in Renal Cell Carcinoma Patients

Affiliations

Cooperation Between the Inflammation and Coagulation Systems Promotes the Survival of Circulating Tumor Cells in Renal Cell Carcinoma Patients

Li Wen et al. Front Oncol. .

Abstract

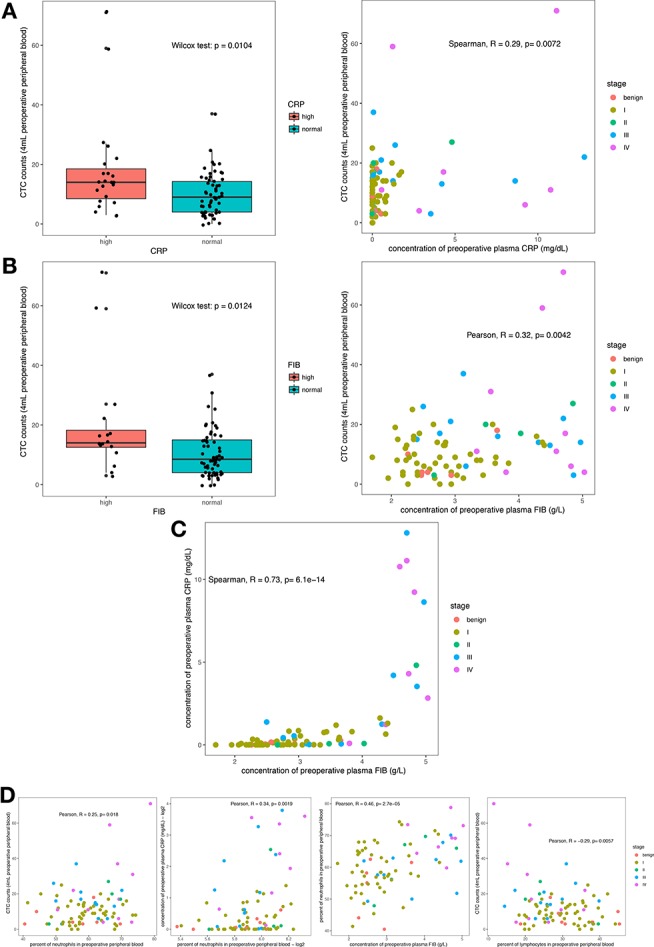
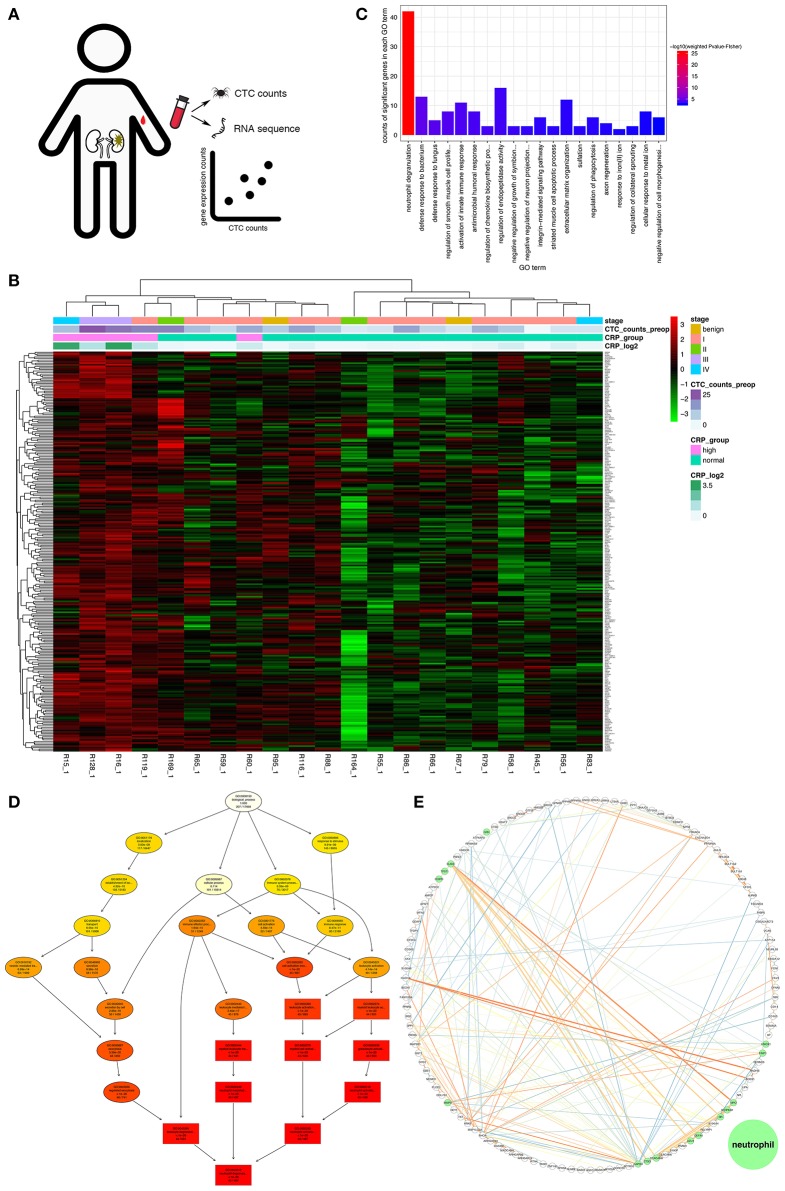
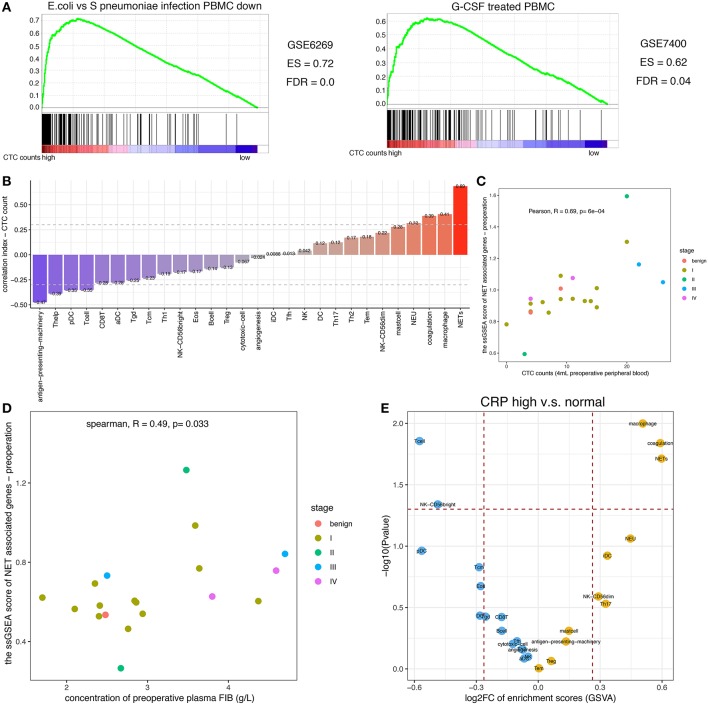
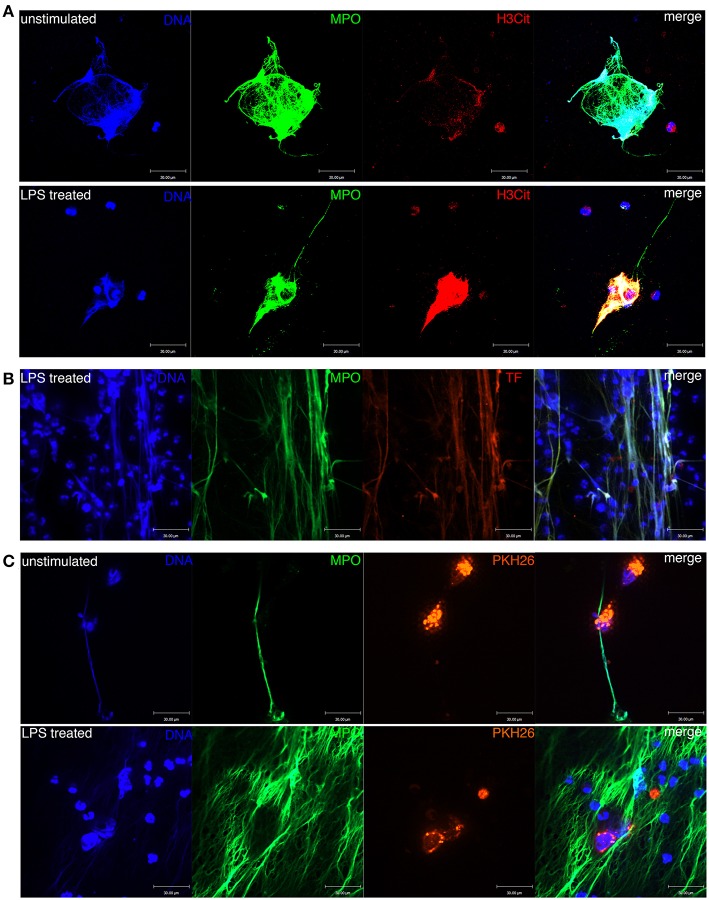
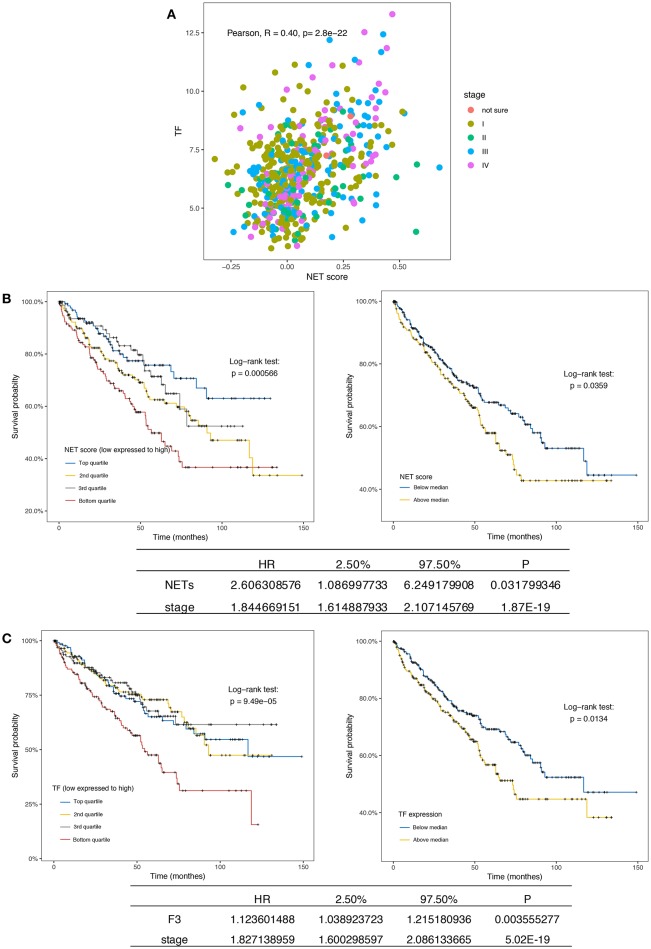
Most renal cell carcinoma (RCC) patients die from metastasis or recurrence after the spread of cancer to another organ, but the mechanisms underlying the intravascular survival of circulating tumor cells (CTCs) have not been completely deciphered. Additionally, although elevated plasma C-reactive protein (CRP) levels and thrombocytosis are strongly correlated and both indicate a poor prognosis for RCC patients, the bridge connecting inflammation and coagulation remains poorly understood. To explore the complicated relationship among inflammation, the coagulation system and CTC survival, we obtained viable CTC counts and clinical information from 106 treatment-naïve patients. In addition, we performed RNA sequencing on peripheral blood leukocytes from 21 of these patients. Patients with elevated CRP and fibrinogen (FIB) levels had higher CTC counts than patients with normal levels of these indexes. Each pair of the three variables (CTC count, CRP level and FIB level) was positively correlated. According to transcriptomic analysis of blood leukocytes, the functions of the 257 genes identified as being positively correlated with the CTC count indicated neutrophil extracellular trap (NET) formation. Indeed, gene set enrichment analysis (GSEA) suggested that NET formation or increased levels of NET markers would promote CTC viability. Additionally, the calculated NET score was positively correlated with the plasma FIB concentration, and both of these values were increased in patients with elevated CRP levels. Moreover, immunofluorescence staining showed that NETs were entangled with viable renal cancer cells and that the NET frameworks were decorated with NET-derived tissue factor (TF). Finally, analysis of 533 RCC samples from The Cancer Genome Atlas (TCGA) indicated that the NET score and TF value are independent prognostic factors for RCC patients. Collectively, NETs formed by intravascular neutrophils further activate the coagulation system. Both the DNA scaffold sprouted and fibrin net triggered by NETs anchor and shield CTCs from attack. Thus, degrading this framework maybe could destroy the double shelter of CTCs, the pioneers of metastasis.

Keywords: C-reactive protein; circulating tumor cells; hypercoagulability; neutrophil extracellular trap; renal cell carcinoma.


Figures

Figure 1
Figure 1
Correlation of hematological parameters (CRP and FIB) with the viable CTC count. CTC counts were increased in the group with elevated circulating CRP levels (A) and the group with elevated circulating FIB levels (B), and both had a positive correlation. The plasma CRP and FIB levels showed a strong positive relationship (C). The circulating neutrophil count was positively correlated with the CTC count and with the plasma CRP and FIB levels. However, the circulating lymphocyte count was negatively correlated with the CTC count (D).
Figure 2
Figure 2
Gene profiles positively correlated with the CTC count. (A) Schematic of the discovery pipeline for genes of interest. (B) Heat map of the genes of interest. The heat map displays the log2 transformed TPM values of the 257 genes of interest. The x-axis shows the samples ordered by hierarchical clustering with Ward's linkage. The top bar on the x-axis represents the clinical stage of the patients, the second bar indicates the measured viable CTC count in 4 mL of preoperative peripheral blood, the third bar indicates the group stratified by the CRP concentration (cutoff of 0.6 mg/dL), and the fourth bar indicates the log2 transformed CRP concentration. (C) The 20 most significant GO terms enriched in the genes of interest. The vertical axis shows the number of positively correlated significantly enriched genes for each term. The horizontal axis displays the names of the GO terms ordered by the degree of significance. The color indicates the–log10 value (weighted Fisher's p-value). (D) Hierarchy chart of the 10 most significantly enriched GO biological process terms. The nodes are displayed in a circle or box shape and include information on the GO ID, GO name, weighted Fisher's p-values, and counts of genes of interest/total count of genes in the term. The box represents the 10 most significantly enriched terms. The colors of the box indicate the significance and range from dark red (most significant) to light yellow (least significant). The black arrows indicate is-a relationships. (E) The maximal subnetwork constructed with the genes of interest. The green nodes represent the nearest neighbors of ELANE. The thickness and color of the edges indicate the coexpression values; lower values have lower thicknesses and darker colors.
Figure 3
Figure 3
Relationship among the NET score, FIB level, and CTC count. (A) GSEA of the peripheral blood leukocyte RNAseq dataset. GSEA was performed with continuous-label CTC counts. The GSEA mountain plots exhibited the 2 most divergent signatures (with a minimum enrichment score of 0.6 and a false discovery rate (FDR) cutoff of 0.05). The gene set names were refined to fit the figure. (B) Relationship between the CTC count and the immunophenoscore as assessed by ssGSEA for immune cell subgroups and selected physiological processes. The vertical axis displays the correlation coefficients of the CTC counts and each subgroup of immune cells. In addition, the colors of the bars correspond to the correlation coefficient. (C) Relationship between the CTC count and the NET score. (D) Relationship between the NET score and the FIB concentration. (E) Plot of the enriched (yellow) and depleted (blue) immune phenotypes between the group with elevated CRP levels and the group with normal CRP levels based on the immunophenoscore (GSVA).
Figure 4
Figure 4
Formation of NETs in the peripheral blood of patients with ccRCC. (A) DNA, MPO, and H3Cit were colocalized with NETs formed in unstimulated and LPS-treated blood. (B) DNA, MPO, and TF were colocalized with NETs formed in LPS-treated blood. Neutrophil-derived TF was produced during NET formation. (C) NETs were entangled with ACHN cells in the blood of ccRCC patients.
Figure 5
Figure 5
NETs and F3 in tissues are independent prognostic factors in ccRCC patients. (A) Kaplan-Meier plots of the overall survival of ccRCC patients (n = 533) from the TCGA database stratified by the NET score quartile (left, p = 0.000566) and median NET score (right, p = 0.0359). The bottom list shows the adjusted HR for NETs by clinical stage (HR = 16.18). (B) Kaplan-Meier plots of the overall survival of ccRCC patients (n = 533) from the TCGA database stratified by the TF expression quartile (left, p = 0.49 × 10⁻⁵) and median TF expression value (right, p = 0.0134). The bottom list shows the adjusted HR for TF expression by clinical stage (HR = 1.12). (C) The NET score and TF expression value were positively correlated.

References

    1. Bray F, Ferlay J, Soerjomataram I, Siegel RL, Torre LA, Jemal A. Global cancer statistics 2018: GLOBOCAN estimates of incidence and mortality worldwide for 36 cancers in 185 countries. CA Cancer J Clin. (2018) 68:394–424. 10.3322/caac.21492 - DOI - PubMed
    1. Choueiri TK, Motzer RJ. Systemic therapy for metastatic renal-cell carcinoma. N Engl J Med. (2017) 376:354–66. 10.1056/NEJMra1601333 - DOI - PubMed
    1. Robert J, Motzer MD, Thomas E, Hutson DO, Pharm D, Piotr Tomczak MD, et al. Sunitinib versus interferon alfa in metastatic renal-cell carcinoma. N. Engl. J. Med. (2007) 356:115–24. 10.1056/NEJMoa065044 - DOI - PubMed
    1. Massagué J, Obenauf AC. Metastatic colonization by circulating tumour cells. Nature. (2016) 529:298–306. 10.1038/nature17038 - DOI - PMC - PubMed
    1. Steinert G, Schölch S, Niemietz T, Iwata N, García SA, Behrens B, et al. . Immune escape and survival mechanisms in circulating tumor cells of colorectal cancer. Cancer Res. (2014) 74:1694–704. 10.1158/0008-5472.CAN-13-1885 - DOI - PubMed