. 2019 Jun 24:2:240.
doi: 10.1038/s42003-019-0433-3. eCollection 2019.

Dual Ca2+-dependent gates in human Bestrophin1 underlie disease-causing mechanisms of gain-of-function mutations

Affiliations

Dual Ca2+-dependent gates in human Bestrophin1 underlie disease-causing mechanisms of gain-of-function mutations

Changyi Ji et al. Commun Biol. .

Abstract

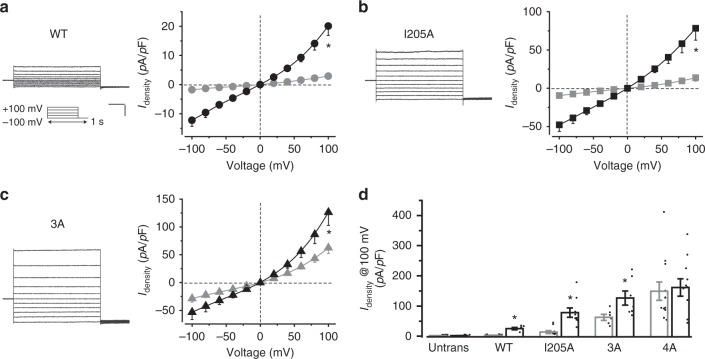
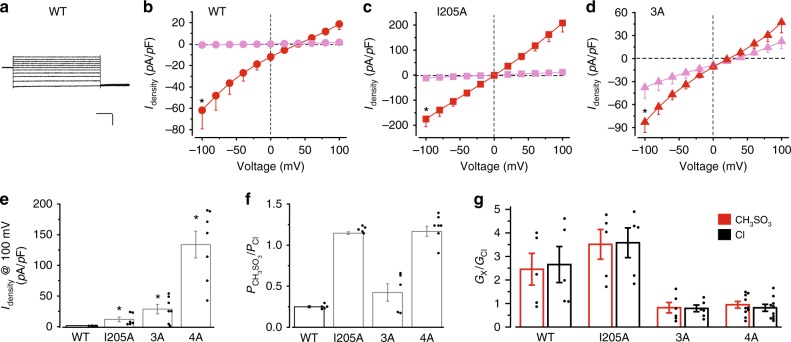
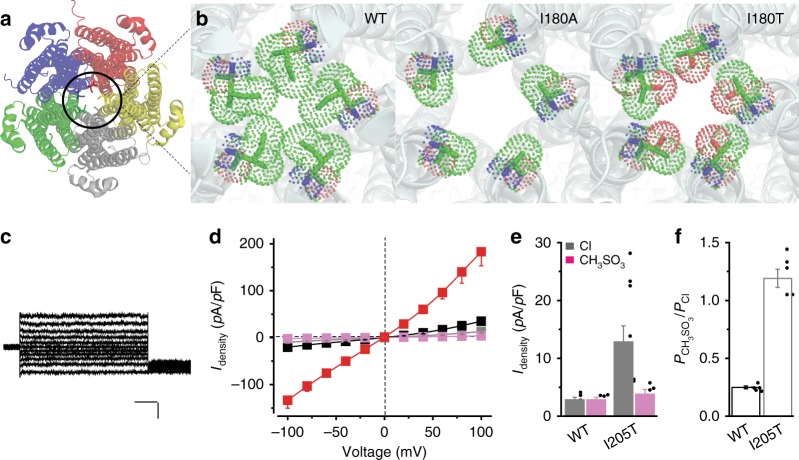
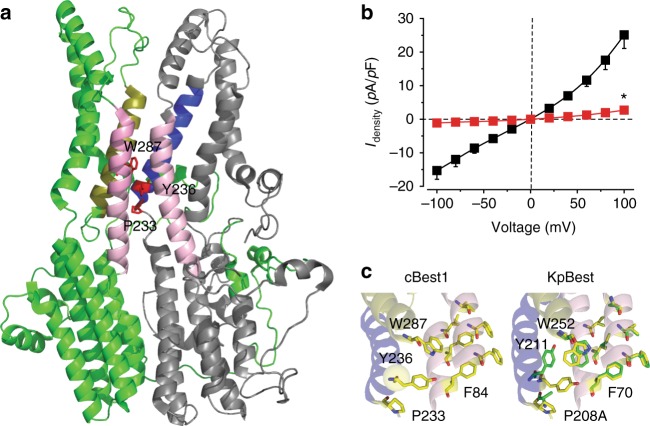
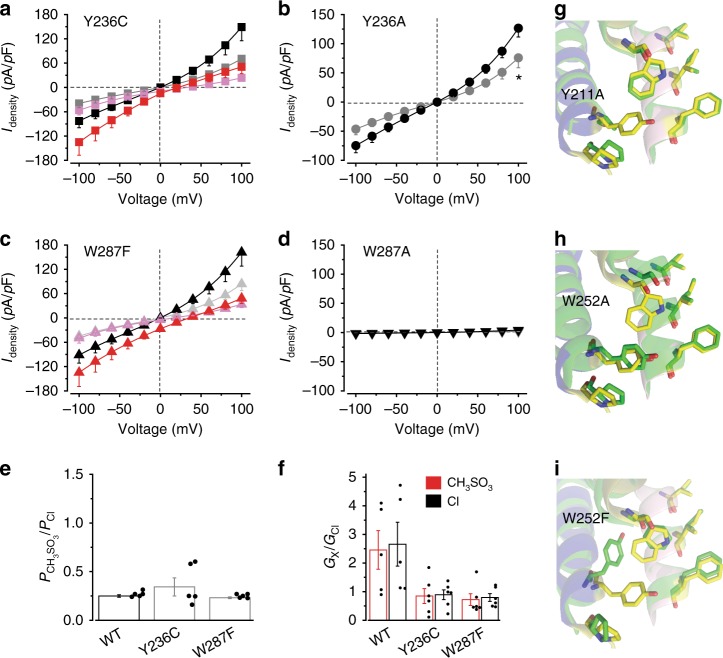
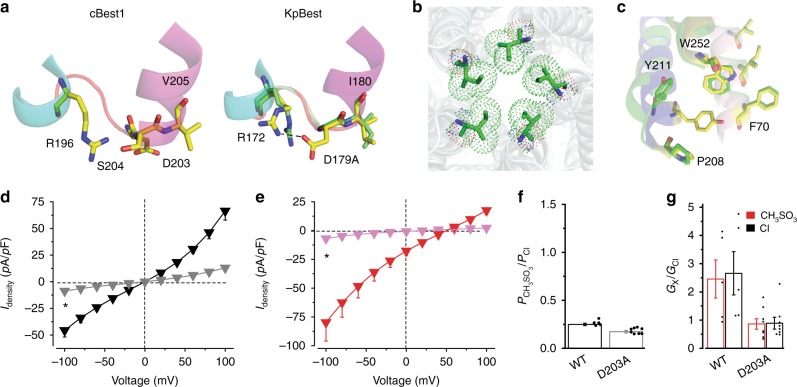
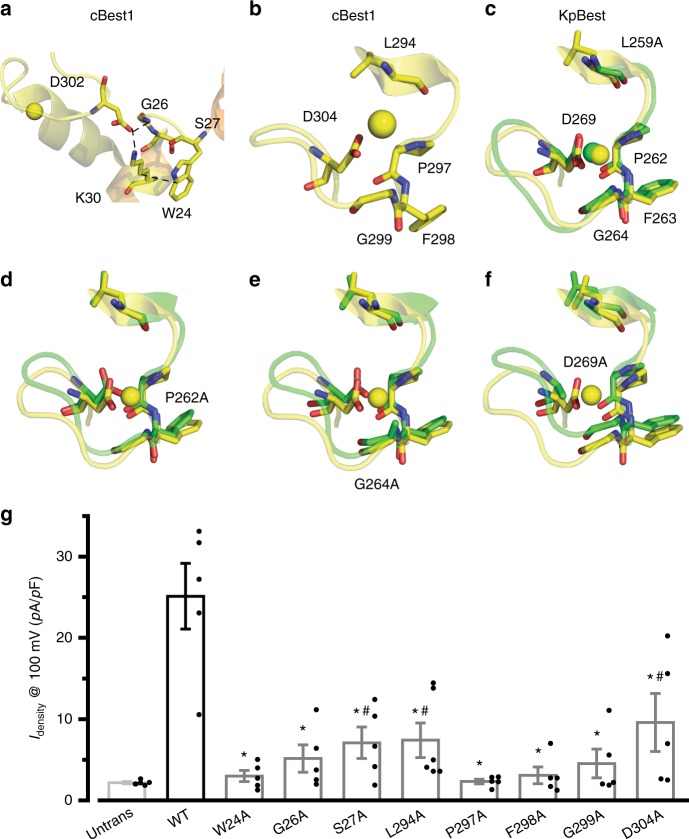
Mutations of human BEST1, encoding a Ca2+-activated Cl- channel (hBest1), cause macular degenerative disorders. Best1 homolog structures reveal an evolutionarily conserved channel architecture highlighted by two landmark restrictions (named the "neck" and "aperture", respectively) in the ion conducting pathway, suggesting a unique dual-switch gating mechanism, which, however, has not been characterized well. Using patch clamp and crystallography, we demonstrate that both the neck and aperture in hBest1 are Ca2+-dependent gates essential for preventing channel leakage resulting from Ca2+-independent, spontaneous gate opening. Importantly, three patient-derived mutations (D203A, I205T and Y236C) lead to Ca2+-independent leakage and elevated Ca2+-dependent anion currents due to enhanced opening of the gates. Moreover, we identify a network of residues critically involved in gate operation. Together, our results suggest an indispensable role of the neck and aperture of hBest1 for channel gating, and uncover disease-causing mechanisms of hBest1 gain-of-function mutations.

Keywords: Chloride channels; Hereditary eye disease; Patch clamp; Permeation and transport; X-ray crystallography.


Conflict of interest statement

Competing interestsThe authors declare no competing interests.

Figures

Fig. 1
Fig. 1
Ca2+-dependent Cl currents in human bestrophin1 (hBest1) gate mutants. ac Representative current traces in the presence of 1.2 μM Ca2+, and population steady-state current density–voltage relationships in HEK293 cells individually expressing hBest1 wild-type (WT) (a), I205A (b), or 3A (c), with Cl in the external solution, in the absence (gray) or presence (black) of 1.2 μM Ca2+, n = 5–10 for each point. Insert, voltage protocol used to elicit currents. Scale bar, 300 pA, 150 ms. *P < 0.05 compared to cells in the absence of Ca2+, using two-tailed unpaired Student’s t test. d Bar chart showing the steady-state Cl current densities at 100 mV in the absence (gray) or presence (black) of Ca2+, n = 5–11 for each bar. *P < 0.05 compared to cells in the absence of Ca2+, using two-tailed unpaired Student’s t test. All error bars in this figure represent s.e.m.
Fig. 2
Fig. 2
Ca2+-dependent CH3SO3 currents in human bestrophin1 (hBest1) gate mutants. a Representative wild-type (WT) current traces in the presence of 1.2 μM Ca2+, with CH3SO3 in the external solution. Scale bar, 200 pA, 150 ms. bd Population steady-state current density–voltage relationships in HEK293 cells expressing hBest1 WT (b), I205A (c), or 3A (d), with CH3SO3 in the external solution, in the absence (magenta) or presence (red) of 1.2 μM Ca2+, n = 5–6 for each point. *P < 0.05 compared to cells in the absence of Ca2+, using two-tailed unpaired Student’s t test. e Bar chart showing the steady-state CH3SO3 current densities at 100 mV in the absence of Ca2+, n = 5–7 for each bar. *P < 0.05 compared to currents conducted by WT hBest1, using two-tailed unpaired Student’s t test. f Relative ion permeability ratios (PCH3SO3/PCl) calculated from the Goldman–Hodgkin–Katz equation, n = 5–7 for each bar. g Relative ion conductance ratios (GX/GCl) measured as slope conductance at the reversal potential plus 50 mV (CH3SO3/Cl, red) or minus 50 mV (Cl/Cl, black), n = 5–10 for each bar. All error bars in this figure represent s.e.m.
Fig. 3
Fig. 3
Structural and functional analyses of two aperture mutants. a KpBest pentamer viewed from the cytoplasmic side and vertical to the ion-conducting pathway. b Apertures of KpBest wild-type (WT), I180A, and I180T as viewed from the same direction as in a. Figures were made from actual crystal structures, and critical residues on the apertures are colored by element. c Representative human bestrophin1 (hBest1) I205T current traces in the absence of Ca2+, with Cl in the external solution. Scale bar, 100 pA, 150 ms. d Population steady-state current density–voltage relationships in HEK293 cells expressing hBest1 I205T, with Cl in the external solution in the absence (gray) or presence (black) of 1.2 μM Ca2+ or with CH3SO3 in the external solution in the absence (magenta) or presence (red) of 1.2 μM Ca2+, n = 10–11 for each point. e Bar chart showing the steady-state Cl and CH3SO3 current densities of hBest1 WT and I205T at 100 mV in the absence of Ca2+, n = 5–10 for each bar. f Relative ion permeability ratio (PCH3SO3/PCl) in hBest1 WT and I205T, n = 5–10 for each bar. All error bars in this figure represent s.e.m.
Fig. 4
Fig. 4
Structural and functional analyses of human bestrophin1 (hBest1) P233A/KpBest P208A. a Ribbon diagram of two adjacent (72°) protomers of a cBest1 pentamer with the extracellular side on the top. The side chains of P233, Y236, and W287 are shown in red. Helices surrounding the critical residues (F84, P233, Y236, and W287) are labeled in the same colors as those in c for comparison. b Population steady-state current density–voltage relationships in HEK293 cells expressing hBest1 WT (black) and P233A (red), with Cl in the external solution in the presence of 1.2 μM Ca2+, n = 5–6 for each point. *P < 0.05 compared to cells expressing WT hBest1, using two-tailed unpaired Student’s t test. c Visualization of the structural alteration. cBest1, Ca2+ labeled as yellow sphere; KpBest, showing critical residues on WT (yellow) and P208A (green). All error bars in this figure represent s.e.m.
Fig. 5
Fig. 5
Structural and functional analyses of human bestrophin1 (hBest1) Y236 and W287. a Population steady-state current density–voltage relationships in HEK293 cells expressing hBest1 Y236C with Cl in the external solution in the absence (gray) or presence (black) of 1.2 μM Ca2+ or with CH3SO3 in the external solution in the absence (magenta) or presence (red) of 1.2 μM Ca2+, n = 5–6 for each point. b Population steady-state current density–voltage relationships in HEK293 cells expressing hBest1 Y236A with Cl in the external solution in the absence (gray) or presence (black) of 1.2 μM Ca2+, n = 7–8 for each point. *P < 0.05 compared to cells in the presence of Ca2+, using two-tailed unpaired Student’s t test. c Results from hBest1 W287F in the same format as a, n = 8–11 for each point. d Results from W287A in same format as b, n = 5 for each point. e Relative ion permeability ratios (PCH3SO3/PCl) calculated from the Goldman–Hodgkin–Katz equation, n = 5 for each bar. f Relative ion conductance ratios (GX/GCl) measured as slope conductance at the reversal potential plus 50 mV (CH3SO3/Cl, red) or minus 50 mV (Cl/Cl, black), n = 5–6 for each bar. gi Visualization of the neck regions of KpBest Y211A (g), W252A (h), and W252F (i), showing critical residues on WT (yellow) and the mutants (green). Helices surrounding the critical residues (F70, P208, Y211, and W252) are labeled in the same colors as those in Fig. 4 for comparison. All error bars in this figure represent s.e.m.
Fig. 6
Fig. 6
Structural and functional analyses of human bestrophin1 (hBest1) D203A/KpBest D179A. a Visualization of the structural alteration, showing critical residues on wild-type (WT; yellow) and the mutant (green). The loop is labeled in red for WT and in green for the KpBest D179A mutant. b Aperture of KpBest D179A as viewed from the same direction as in Fig. 3a, b. Critical residues on the apertures are colored by element. c Visualization of the neck region of KpBest D179A, showing critical residues on WT (yellow) and the mutant (green). Helices surrounding the critical residues (F70, P208, Y211, and W252) are labeled in the same colors as those in Fig. 4 for comparison. d Population steady-state current density–voltage relationships in HEK293 cells expressing hBest1 D203A, with Cl in the external solution in the absence (gray) or presence (black) of 1.2 μM Ca2+, n = 12–14. *P < 0.05 compared to cells in the presence of Ca2+, using two-tailed unpaired Student’s t test. e Population steady-state current density–voltage relationships in HEK293 cells expressing hBest1 D203A, with CH3SO3 in the external solution in the absence (magenta) or presence (red) of 1.2 μM Ca2+, n = 8–9 for each point. *P < 0.05 compared to cells in the presence of Ca2+, using two-tailed unpaired Student’s t test. f Relative ion permeability ratios (PCH3SO3/PCl) calculated from the Goldman–Hodgkin–Katz equation, n = 5–8 for each bar. g Relative ion conductance ratios (GX/GCl) measured as slope conductance at the reversal potential plus 50 mV (CH3SO3/Cl, red) or minus 50 mV (Cl/Cl, black), n = 5–8 for each bar. All error bars in this figure represent s.e.m.
Fig. 7
Fig. 7
Structural and functional analyses of critical residues on the Ca2+ loops. a, b Visualization of the cBest1 Ca2+-binding site composed of an N-terminal loop (a) and a Ca2+ clasp (b). Critical residues are shown with their side chains. Helices surrounding the critical residues are labeled in the same colors as those in Supplementary Fig. 1 for comparison. Yellow sphere, Ca2+. c Visualization of the region corresponding to the Ca2+ clasp in KpBest, which is a Zn2+-binding site. Critical regions and residues are labeled yellow in wild-type (WT) and green in the L259A mutant. Zn2+ sphere is yellow in WT and green in the L259A mutant. df Visualization of the structural alterations in KpBest P262A (d), G264A (e), and D269A (f). Critical regions and residues are labeled yellow in WT and green in the mutants. Zn2+ sphere is yellow in WT. g Bar chart showing the population steady-state current densities at 100 mV in HEK293 cells expressing WT and the alanine substitution mutants, n = 5-6 for each point. *,#P < 0.05 compared to currents conducted by WT and untransfected cells, respectively, using two-tailed unpaired Student’s t test. All error bars in this figure represent s.e.m.

References

    1. Li, Y. et al. Patient-specific mutations impair BESTROPHIN1’s essential role in mediating Ca2+-dependent Cl− currents in human RPE. Elife6, e29914 (2017). - PMC - PubMed
    1. Milenkovic A, et al. Bestrophin 1 is indispensable for volume regulation in human retinal pigment epithelium cells. Proc. Natl. Acad. Sci. USA. 2015;112:E2630–E2639. doi: 10.1073/pnas.1418840112. - DOI - PMC - PubMed
    1. Moshfegh Y, et al. BESTROPHIN1 mutations cause defective chloride conductance in patient stem cell-derived RPE. Hum. Mol. Genet. 2016;25:2672–2680. - PMC - PubMed
    1. Allikmets R, et al. Evaluation of the Best disease gene in patients with age-related macular degeneration and other maculopathies. Hum. Genet. 1999;104:449–453. doi: 10.1007/s004390050986. - DOI - PubMed
    1. Burgess R, et al. Biallelic mutation of BEST1 causes a distinct retinopathy in humans. Am. J. Hum. Genet. 2008;82:19–31. doi: 10.1016/j.ajhg.2007.08.004. - DOI - PMC - PubMed

Publication types