. 2019 Jun 21;3(2):026105.
doi: 10.1063/1.5090986. eCollection 2019 Jun.

Scalable microphysiological system to model three-dimensional blood vessels

Affiliations

Scalable microphysiological system to model three-dimensional blood vessels

Mees N S de Graaf et al. APL Bioeng. .

Abstract

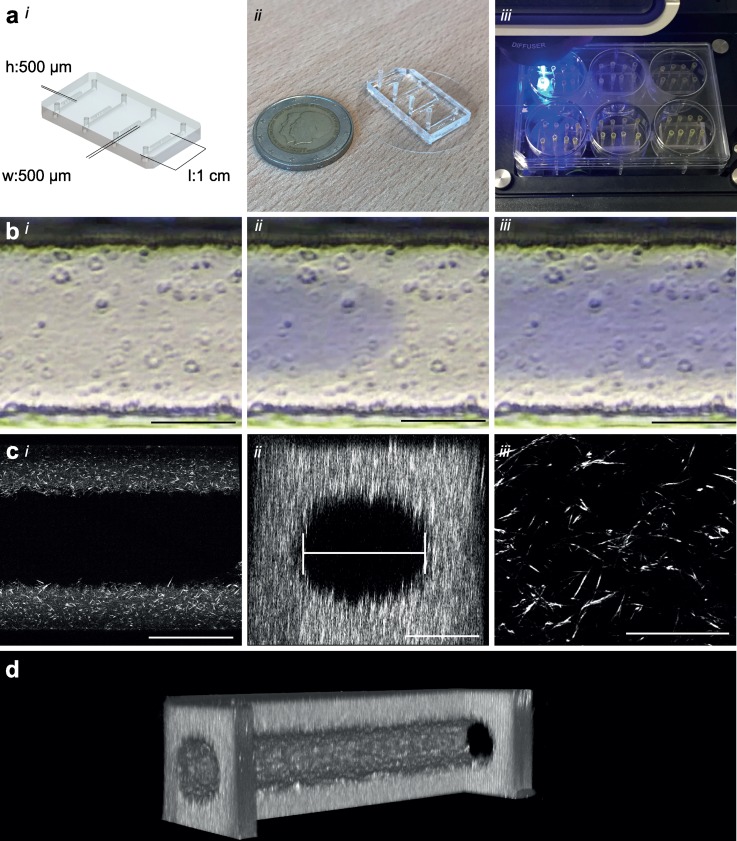
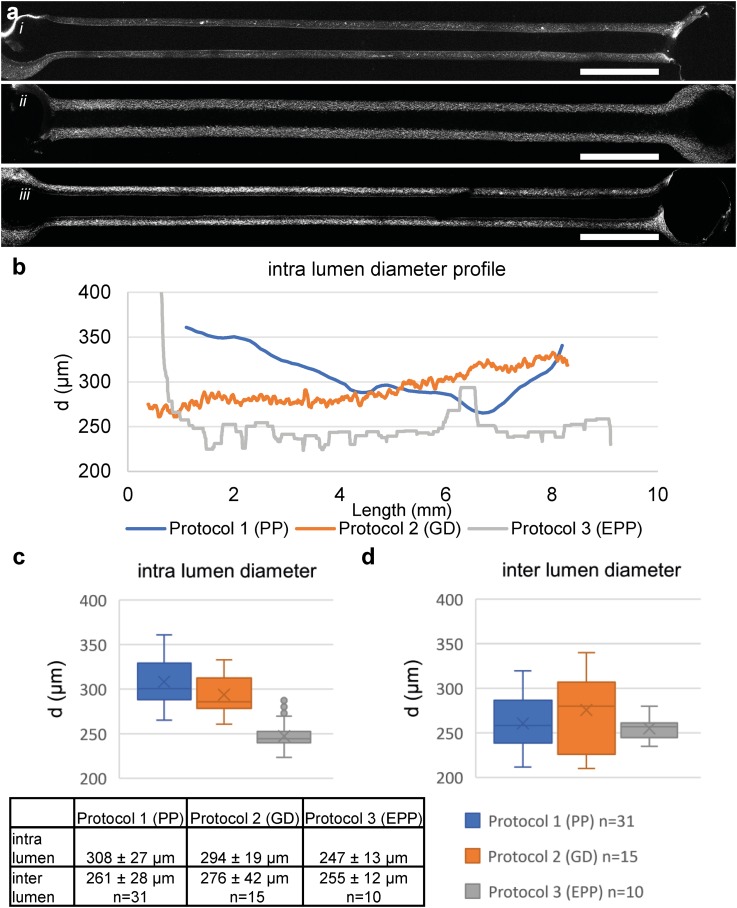
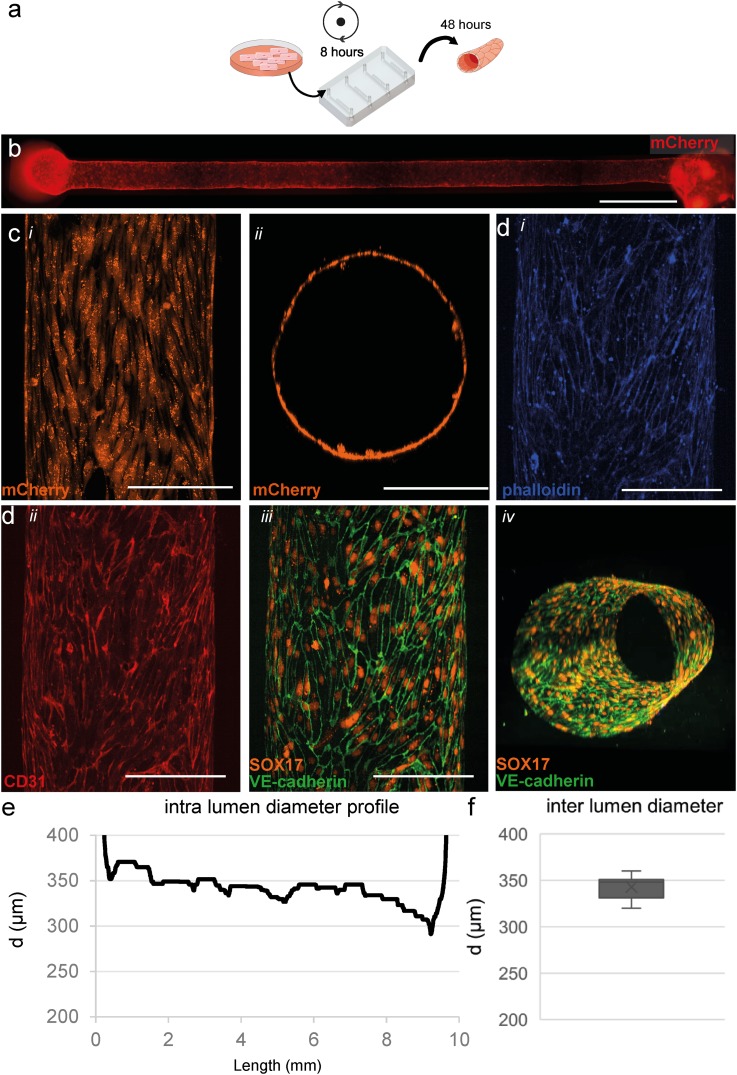
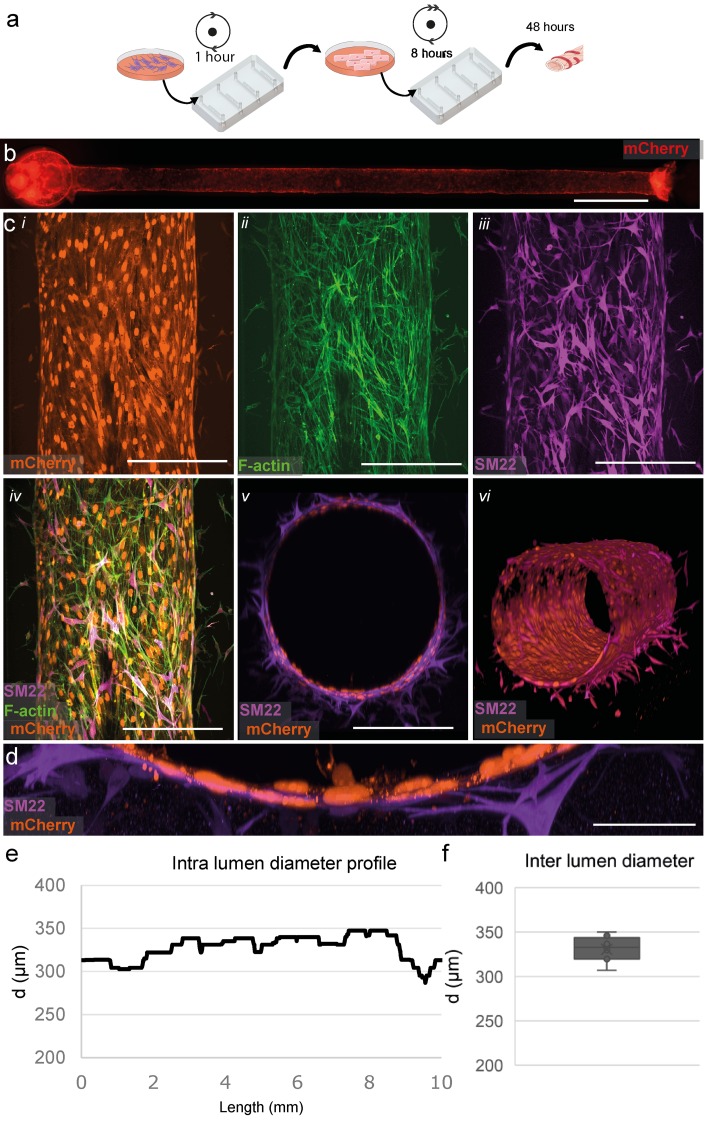
Blood vessel models are increasingly recognized to have value in understanding disease and drug discovery. However, continued improvements are required to more accurately reflect human vessel physiology. Realistic three-dimensional (3D) in vitro cultures of human vascular cells inside microfluidic chips, or vessels-on-chips (VoC), could contribute to this since they can recapitulate aspects of the in vivo microenvironment by including mechanical stimuli such as shear stress. Here, we used human induced pluripotent stem cells as a source of endothelial cells (hiPSC-ECs), in combination with a technique called viscous finger patterning (VFP) toward this goal. We optimized VFP to create hollow structures in collagen I extracellular-matrix inside microfluidic chips. The lumen formation success rate was over 90% and the resulting cellularized lumens had a consistent diameter over their full length, averaging 336 ± 15 μm. Importantly, hiPSC-ECs cultured in these 3D microphysiological systems formed stable and viable vascular structures within 48 h. Furthermore, this system could support coculture of hiPSC-ECs with primary human brain vascular pericytes, demonstrating their ability to accommodate biologically relevant combinations of multiple vascular cell types. Our protocol for VFP is more robust than previously published methods with respect to success rates and reproducibility of the diameter between- and within channels. This, in combination with the ease of preparation, makes hiPSC-EC based VoC a low-cost platform for future studies in personalized disease modeling.


Figures

FIG. 1.
FIG. 1.
Microfluidic design and patterning collagen scaffold. (a), (i) Schematic of the microfluidic chip showing dimensions and layout of the microfluidic platform, four straight channels on a single chip with designed parameters 500 μm × 500 μm × 1 cm (w × h × l), (ii) Photograph of the real microfluidic device showing four channels ready to be patterned, two-euro coin as size reference, and (iii) Photograph demonstrating ease of use and medium throughput capacity of this setup. The microfluidic device fits in 6-well plates allowing analyses medium throughput in a conventional biological workflow. Manual preparation of patterning of these 24 lumens is typically 10 min. (b) Time-lapse of Viscous finger patterning images showing PBS with blue food dye traveling through collagen solution in a 500 μm wide channel. (i) t = 0 collagen is injected, (ii) PBS finger travels through the channel, and (iii) PBS-finger has completely traversed the channel and displaced the center of the collagen. (c), (i) 20× magnification confocal slice of a patterned lumen with 5 mg/ml collagen I; note the absence of the fibril structure in the center where the “finger” displaced the collagen. (ii) XZ-reconstruction showing the flow field of the scaffold. The diameter is determined by the widest slice of a reconstructed image; (iii) 63× magnification showing a detailed view of the fibril structure of collagen I. (d) 3D cut-out reconstruction of a 2-photon second harmonic generation image showing the collagen scaffold. One side has been cut out to demonstrate the inside of the scaffold. Scale bars, (bi,bii,biii,ci,cii): 200 μm, (ciii): 50 μm.
FIG. 2.
FIG. 2.
Comparison of different VFP protocols. (a) 2-Photon image of the middle slice of a representative lumen patterned with (i) passive pumping, (ii) gravity driven, (iii) extended passive pumping. (b) Intradiameter analyses of the representative lumen, the lumen patterned with PP (blue) shows a significantly gradually narrowing of the lumen, lumens patterned with GD (orange) show a straight lumen in the first part of the lumen followed by a gradual widening of the lumen. Lumens patterned with EPP (gray) show a uniform diameter of the lumen over the complete length, with a small oscillating trend. (c) Boxplot of the intradiameter of the represented lumen shows the large range and standard deviation in the PP patterned lumen. (d) Boxplot of interdiameter analysis of patterned lumen based on center 1.5 mm; PP (n = 31), GD (n = 15), EPP (n = 10). Boxplot displaying Q2-Q3- whiskers display Q1 and Q4, Dots: outliers, x: mean value. The Levene's test shows nonequal homogeneity of variance (p = 0.007); one-way ANOVA analysis shows no significant difference in means (p = 0.654). Scale bars: 1000 μm.
FIG. 3.
FIG. 3.
Three-dimensional cell culture of hiPSC-ECs. (a) Schematic overview of cell seeding procedure and culture in microfluidic devices. hiPSC-ECs were seeded and cultured for 48 h in static conditions. (b) Widefield image shows an even and consistent mCherry signal demonstrating uniform coverage of hiPSC-ECs along the whole lumen in a collagen scaffold. (c), (i) Top-down view of live cell confocal image, (ii) XY-reconstruction of the live cell confocal microscopy confirms complete coverage around the perimeter of the lumen. (d) Top-down reconstruction of the lumen visualized using the following markers. (i) F-actin (phalloidin, visualized in blue), (ii) CD31 (visualized in red), and (iii) VE-Cadherin (visualized in green) at the periphery of the hiPSC-ECs costained with SOX17 (visualized in orange) localized at the nuclei of endothelial cells showing alignment with the longitudinal axis of the lumen, and (iv) 3D reconstruction of the engineered vessel showing VE-cadherin and SOX17 around the complete periphery of the lumen and a more detailed reconstruction is presented in video S1. (e) Analyses of the full-length channel show a uniform diameter with small tapering near the outlet. (f) Diameter analysis of cellularised lumens (n = 8), on average 343 ± 12 μm. Scale bars, (b): 1000 μm, (c) and (d): 200 μm.
FIG. 4.
FIG. 4.
Three-dimensional coculture of hiPSC-ECs and HBVPs. (a) Schematic overview of the protocol for cell seeding and culture in microfluidic devices. (b) Widefield image shows an even and consistent mCherry signal demonstrating uniform coverage of hiPSC-ECs along the whole lumen in collagen gel, similar to that of the monoculture. (c) Top-down view of immunofluorescent staining showing close interaction of EC and pericytes. (i) mCherry expressing ECs (visualized in orange). (ii) f-actin (visualized in green). (iii) SM22 staining HBVPs (visualized in magenta) and (iv) merged image of EC- and mural cell-specific markers. (v) XZ-view demonstrating lumen lined with mCherry labeled ECs (orange) surrounded by HBVPs (magenta). (vi) 3D reconstruction of the vascular tube, a complete reconstruction is presented in video S2. (d) High magnification of cross section, demonstrating close interaction between the inner EC-layer and surrounding HBVP supporting cells. (e) Diameter analyses of a full-length channel show a uniform channel similar to monoculture. (f) Diameter analysis of the cellularized channel, on average 331 ± 13 μm (n = 8). Scale bars, (b) 1000 μm, (c) 200 μm, and (d) 50 μm.
FIG. 5.
FIG. 5.
Analysis of the flow profile. (a) Widefield image of the perfused lumen. Boxes are showing the predetermined regions of interest (ROI) at 2.5 mm, 5 mm, and 7.5 mm from the inlet. The average diameter of ROI 1: 320 μm, ROI 2: 290 μm, and ROI 3: 300 μm. A full impression of the perfused lumen is presented in video S3. (b) Velocity profile reconstructed of 30 frames per ROI showing maximum velocity in the center of the lumen. Some interaction of the beads with the cell wall can be observed. Using maximum velocity and assuming laminar flow the volumetric flow rate is determined to be, respectively, 19 μm/min, 18 μm/min, and 18 μm/min. (c) Calculated shear stress per ROI using the determined flow rates and measure diameters. ROI 1: 0.24 Pa, ROI 2: 0.30 Pa, and ROI 0.28 Pa. Scale bar: 1000 μm.

References

    1. Zhao Z., Nelson A. R., Betsholtz C., and Zlokovic B. V., “ Establishment and dysfunction of the blood-brain barrier,” Cell 163, 1064–1078 (2015).10.1016/j.cell.2015.10.067 - DOI - PMC - PubMed
    1. Sweeney M. D., Kisler K., Montagne A., Toga A. W., and Zlokovic B. V., “ The role of brain vasculature in neurodegenerative disorders,” Nat. Neurosci. 21, 1318–1331 (2018).10.1038/s41593-018-0234-x - DOI - PMC - PubMed
    1. Storkebaum E., Quaegebeur A., Vikkula M., and Carmeliet P., “ Cerebrovascular disorders: Molecular insights and therapeutic opportunities,” Nat. Neurosci. 14, 1390–1397 (2011).10.1038/nn.2947 - DOI - PubMed
    1. Daneman R., Zhou L., Kebede A. A., and Barres B. A., “ Pericytes are required for blood-brain barrier integrity during embryogenesis,” Nature 468, 562–566 (2010).10.1038/nature09513 - DOI - PMC - PubMed
    1. Stratman A. N. et al., “ Interactions between mural cells and endothelial cells stabilize the developing zebrafish dorsal aorta,” Development 144, 115–127 (2017).10.1242/dev.143131 - DOI - PMC - PubMed