. 2020 Jan;62(1):74-86.
doi: 10.1165/rcmb.2019-0061OC.

High CO2 Downregulates Skeletal Muscle Protein Anabolism via AMP-activated Protein Kinase α2-mediated Depressed Ribosomal Biogenesis

Affiliations

High CO2 Downregulates Skeletal Muscle Protein Anabolism via AMP-activated Protein Kinase α2-mediated Depressed Ribosomal Biogenesis

Tanner C Korponay et al. Am J Respir Cell Mol Biol. 2020 Jan.

Abstract

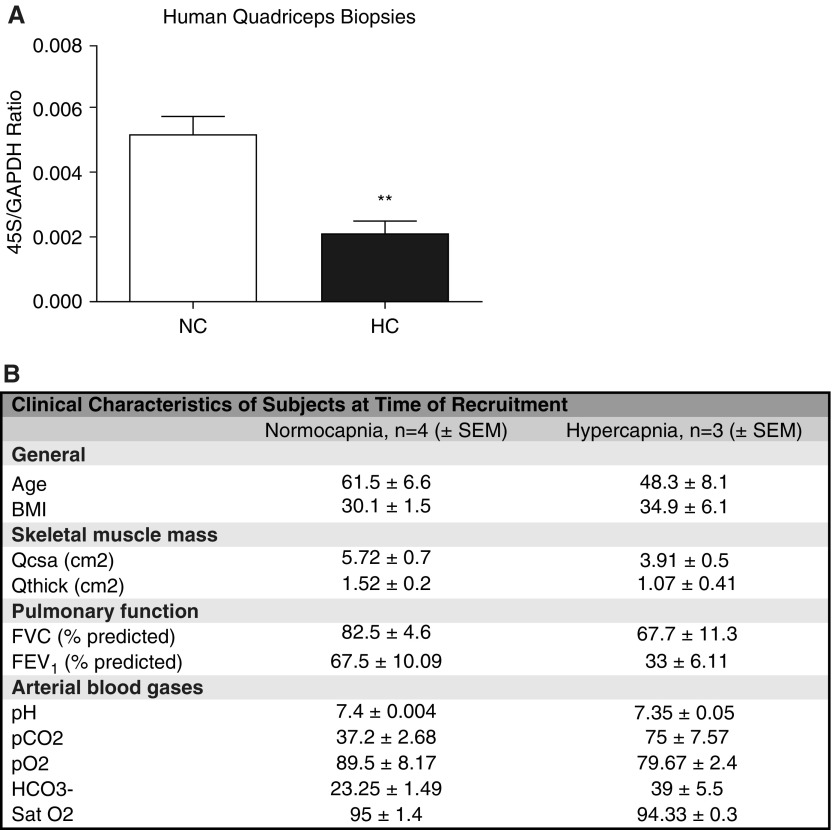
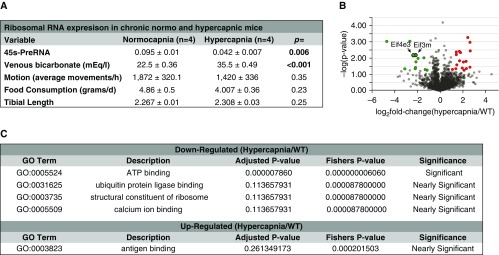
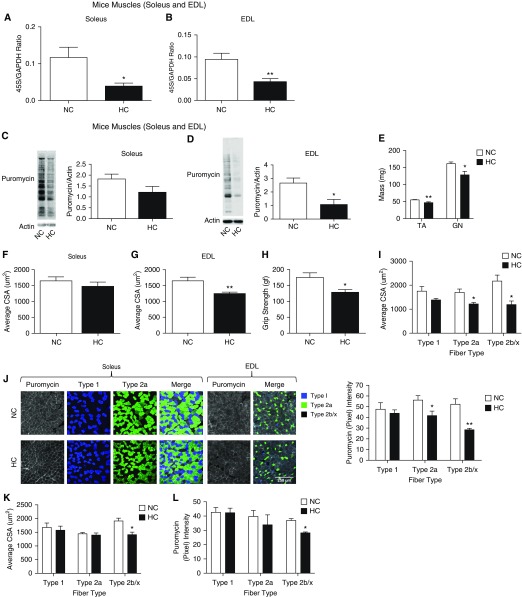
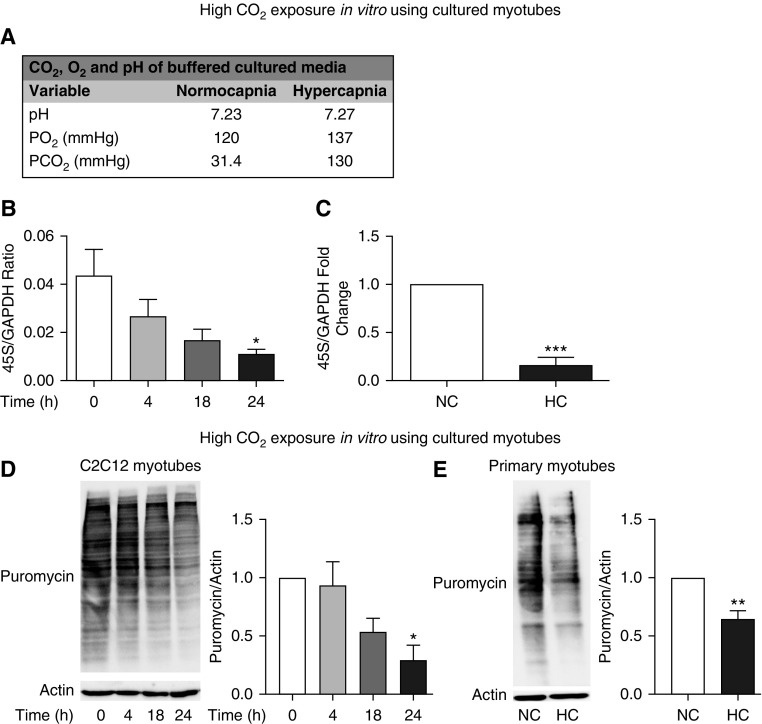
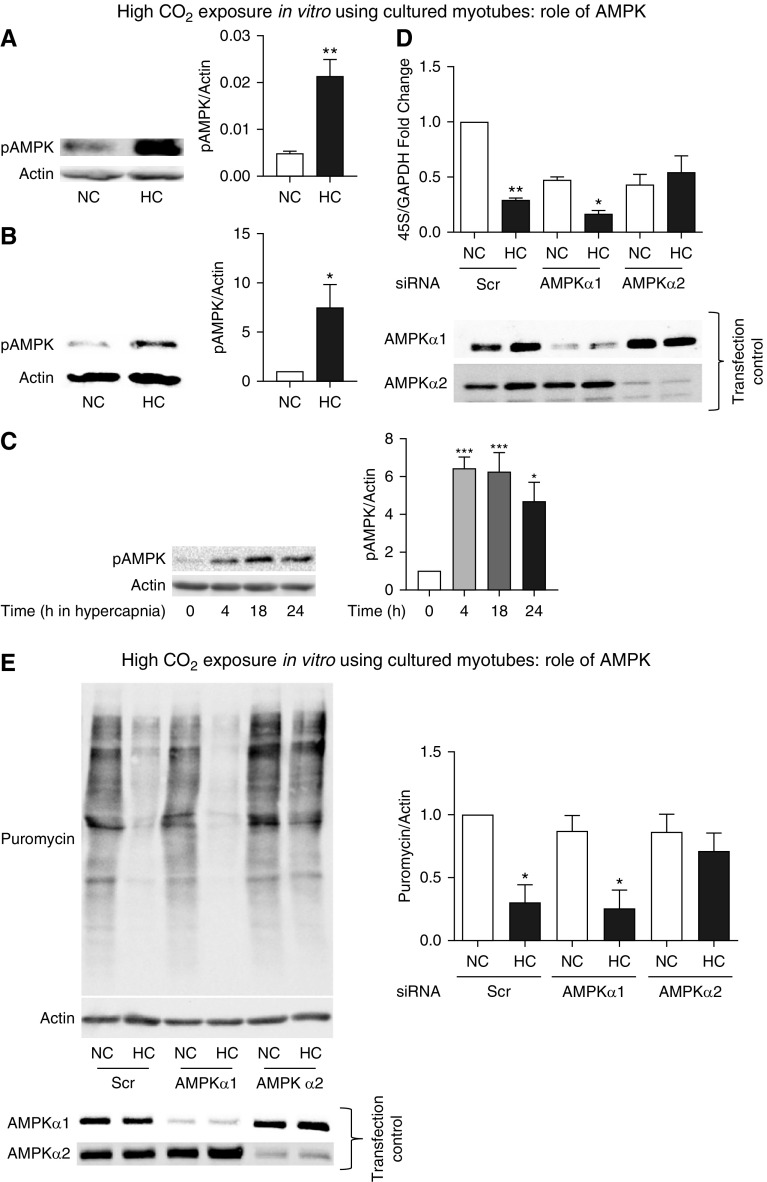
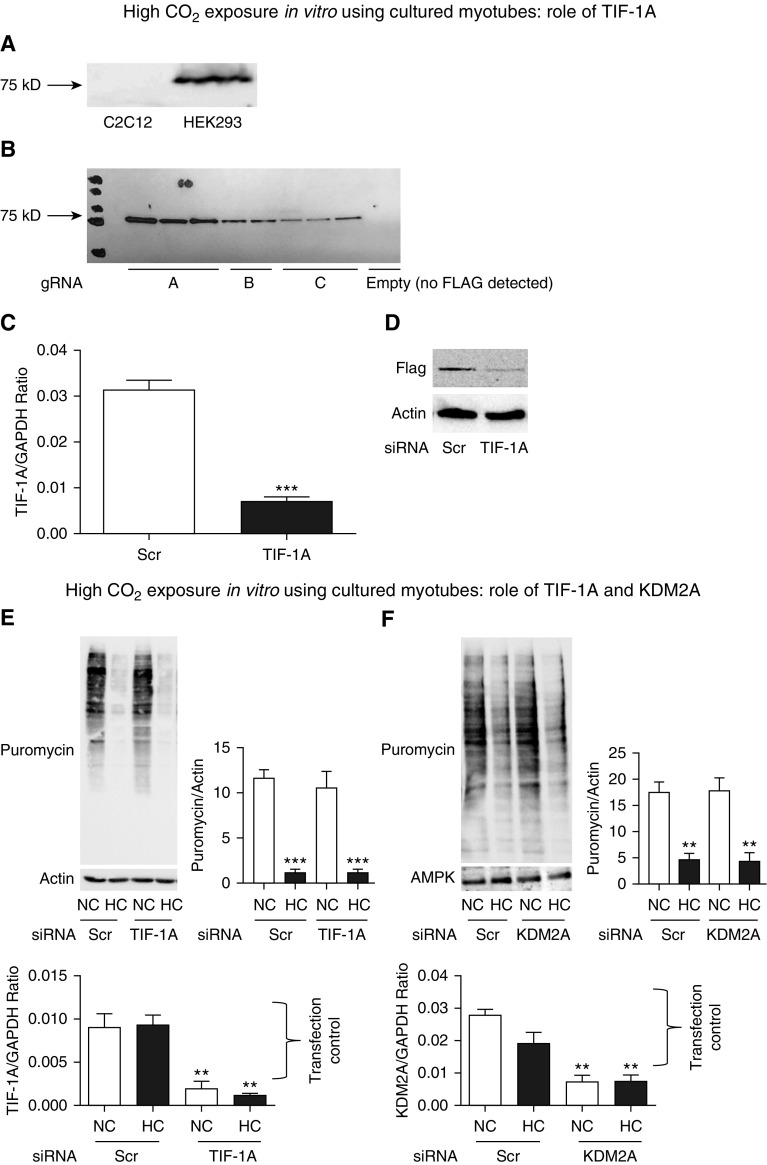
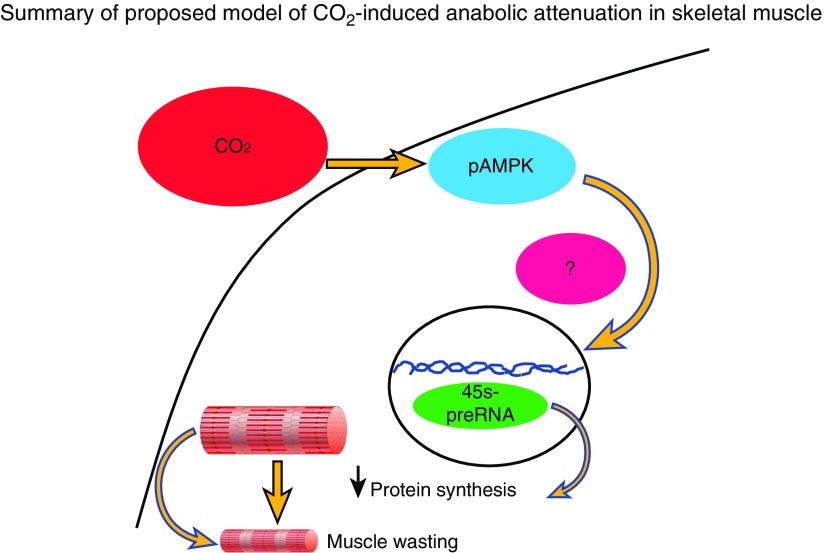
High CO2 retention, or hypercapnia, is associated with worse outcomes in patients with chronic pulmonary diseases. Skeletal muscle wasting is also an independent predictor of poor outcomes in patients with acute and chronic pulmonary diseases. Although previous evidence indicates that high CO2 accelerates skeletal muscle catabolism via AMPK (AMP-activated protein kinase)-FoxO3a-MuRF1 (E3-ubiquitin ligase muscle RING finger protein 1), little is known about the role of high CO2 in regulating skeletal muscle anabolism. In the present study, we investigated the potential role of high CO2 in attenuating skeletal muscle protein synthesis. We found that locomotor muscles from patients with chronic CO2 retention demonstrated depressed ribosomal gene expression in comparison with locomotor muscles from non-CO2-retaining individuals, and analysis of the muscle proteome of normo- and hypercapnic mice indicates reduction of important components of ribosomal structure and function. Indeed, mice chronically kept under a high-CO2 environment show evidence of skeletal muscle downregulation of ribosomal biogenesis and decreased protein synthesis as measured by the incorporation of puromycin into skeletal muscle. Hypercapnia did not regulate the mTOR pathway, and rapamycin-induced deactivation of mTOR did not cause a decrease in ribosomal gene expression. Loss-of-function studies in cultured myotubes showed that AMPKα2 regulates CO2-mediated reductions in ribosomal gene expression and protein synthesis. Although previous evidence has implicated TIF1A (transcription initiation factor-1α) and KDM2A (lysine-specific demethylase 2A) in AMPK-driven regulation of ribosomal gene expression, we found that these mediators were not required in the high CO2-induced depressed protein anabolism. Our research supports future studies targeting ribosomal biogenesis and protein synthesis to alleviate the effects of high CO2 on skeletal muscle turnover.

Keywords: anabolism; hypercapnia; ribosomal biogenesis; skeletal muscle.


Figures

Figure 1.
Figure 1.
High CO2 associates with decrease of skeletal muscle ribosomal gene expression in humans. (A) Biopsies from quadriceps skeletal muscle of normocapnic (NC; n = 4) versus hypercapnic (HC; n = 3) patients were sampled, and quantitative PCR (qPCR) was performed to determine the expression level of 45S pre-RNA/GAPDH. **P < 0.01. (B) Different covariables present in both groups of patients. (No statistical analyses were performed to compare these variables, given the small number of patients in this pilot study.) BMI = body mass index; FEV1 = forced exporatory volume in 1 second; FVC = forced vital capacity; pCO2 = carbon dioxide tension; pO2 = oxygen tension; Qcsa = quadriceps cross-sectional area; Qthick = quadriceps muscle thickness; Sat O2 = arterial oxygen saturation.
Figure 2.
Figure 2.
Hypercapnia causes a proteomic signature suggesting depressed ribosomal function and structure. (A) Covariables chosen a priori were investigated to determine their possible confounding effect on ribosomal RNA expression and puromycin incorporation. Extensor digitorum longus muscles were sampled and submitted for a large-scale proteomic analysis. (B) Volcano plot highlighting proteins found to be downregulated (green circles) and upregulated (red circles). Eif4e3 and Eif3m are indicated by arrows and significantly downregulated (P < 0.001). (C) Ontological enrichment terms identified as significant or nearly significant in this study. n = 6 (3 normocapnia and 3 hypercapnia). Eif3m = eukaryotic translation initiation factor 3 subunit m; Eif4e3 = eukaryotic translation initiation factor 4E family member 3; GO = gene ontology; WT = wild type.
Figure 3.
Figure 3.
Hypercapnia causes a decrease in skeletal muscle anabolism and expression of ribosomal RNA. Age-matched male C57BL/6 mice were exposed to 10% CO2 (HC) for 60 days or maintained in room air (NC). RNA was isolated from these samples; qPCR was performed; and the amount of 45S pre-RNA/GAPDH ratio was determined in (A) soleus (n = 6) and (B) extensor digitorum longus (EDL) muscles (n = 6). After chronic high CO2 or room air exposures and 30 minutes before mice were killed, 0.040 μmol/g of puromycin was intraperitoneally injected. Then, soleus and EDL muscles were procured, samples were immunoblotted with antipuromycin antibody, and the intensity of the resultant smear was scored. (C) Soleus muscle puromycin incorporation (n = 3). (D) EDL muscle puromycin incorporation (n = 3). (E) Tibialis anterior (TA) and gastrocnemius (GN) muscles from NC and HC mice were procured and immediately weighed (n = 3). (F) Soleus muscle average fiber size in NC and HC (n = 3). (G) EDL muscle average fiber size in NC and HC (n = 3). (H) Grip strength determinations in NC and HC mice (n = 3). (I) Fiber-specific cross-sectional area (CSA) in NC and HC (n = 3). (J) Cryosectioned samples from soleus or EDL muscles were immunostained with antipuromycin antibody and specific antibodies to type I, IIa, or type IIb/x fibers. Then, the amount of fiber-incorporated puromycin in the specific fiber types of soleus and EDL muscles was scored by grayscale scoring of room air–maintained (NC) CO2 versus 10% CO2 for 60 days (HC). NC and HC mice underwent a regime of endurance exercise during 1 month. Scale bar: 250 μm. (K and L) Then, fiber-specific CSA (K) and puromycin incorporation (L) were determined and scored. *P < 0.05 and **P < 0.01.
Figure 4.
Figure 4.
Cultured myotubes demonstrate hypercapnia-driven decrease in protein synthesis and ribosomal gene expression. (A) Values of pH, pCO2, and pO2 as measured in buffered media under NC and high-CO2 (HC) conditions. (B and C) C2C12 myotubes exposed to 20% CO2 for 4, 18, and 24 hours as compared with cells maintained in 5% CO2 (0 h) were sampled, and 45S-preRNA/GAPDH expression was determined with qPCR (n = 3). (C) Primary myotubes exposed to 20% CO2 for 24 hours as compared with cells maintained in 5% CO2 (0 h) were sampled, and expression of 45S-preRNA/GAPDH expression was determined with qPCR (n = 3). (D) Representative immunoblot of C2C12 myotubes exposed to 20% CO2 for 4, 18, and 24 hours as compared with cells maintained in 5% CO2 (0 h). All cells were kept on a puromycin-containing medium, and then lysates were immunoblotted with antipuromycin antibody, and the intensity was interpreted as the index of puromycin incorporation over the analyzed period. Membranes were then stripped and probed with antiactin antibody, used as a lane loading control (n = 3). (E) Representative immunoblot of primary myotubes exposed to 20% CO2 for 24 hours as compared with cells maintained in 5% CO2 (0 h). Cells were kept on a puromycin-containing medium, and then lysates were probed with antipuromycin antibody, and the intensity was interpreted as the index of puromycin incorporation over the analyzed period. Membranes were then stripped and probed with antiactin antibody, used as a lane loading control (n = 3). *P < 0.05, **P < 0.01, and ***P < 0.001.
Figure 5.
Figure 5.
AMP-activated protein kinase (AMPK) regulates protein anabolism during exposure to high CO2 in cultured myotubes. (A) AMPK phosphorylation (pAMPK) in skeletal muscle from mice exposed to high CO2 (HC) versus room air (NC) for 60 days. Actin was used as a lane loading control (n = 3). (B) pAMPK in primary myotubes exposed to 40 mm Hg (NC) or 120 mm Hg (HC) CO2 for 24 hours. Actin was used as a lane loading control (n = 3). (C) pAMPK in C2C12 myotubes exposed to 40 mm Hg (NC) or 120 mm Hg (HC) CO2 for different durations. Actin was used as a lane loading control. (D) Myotubes were transfected with scrambled (Scr), AMPKα1, or AMPKα2 siRNA and then exposed to normal (NC) or high CO2 (HC). Representative figures depict results of qPCR with primers to amplify 45S pre-RNA/GAPDH. Cell samples were processed for Western blotting and probed with specific antibodies to indicate AMPKα1 or AMPKα2 siRNA expression as a control of transfection and silencing efficiency in each condition (n = 3). (E) Conditions similar to D with myotubes exposed to NC and HC for 24 hours in the presence of puromycin-containing medium. Samples were then lysed and immunoblotted with antipuromycin antibody, and the intensity of the smears was scored as shown. Membrane was then stripped and probed with actin as a lane loading control. Transfection control was carried out by Western blotting and probing with specific antibodies to indicate specific silencing of AMPKα1 or AMPKα2 siRNA (n = 3). *P < 0.05, **P < 0.01, and ***P < 0.001.
Figure 6.
Figure 6.
CO2-driven skeletal muscle anabolic attenuation is independent of TIF1A and KDM2A. (A) Example of commercially available anti–TIF1A antibody that does not detect an approximately 75 kD band in lysates of C2C12 cells, whereas it does in HEK293 cells. (B) Cas9-expressing C2C12 cells were transfected with a donor clone holding the sequence of 3×FLAG and with three different guide RNAs (gRNA; A, B, and C) or no guide RNA (last lane with no FLAG detection) to localize the donor clone to exon 18 of the TIF1A gene. Cells were then lysed and immunoblotted with anti-FLAG antibody, demonstrating a band of approximately 75 kD (expected weight of TIF1A). (C) C2C12 cells from (B) (clone A) were transfected with Scr or specific TIF1A siRNA and then sampled for qPCR using TIF1A-amplifying primers, which demonstrate a decrease in the gene product in the siRNA-transfected group. GAPDH was used as a housekeeping control (n = 3). (D) The same C2C12 cells as in (C) were processed for Western blotting and probed with anti-FLAG antibody, demonstrating a significant decrease in the FLAG band intensity in the silenced group. Actin was used as a lane loading control (n = 3). (E) Myotubes were transfected with Scr or TIF1A siRNA and then exposed to NC or HC for 24 hours in the presence of puromycin-containing medium. Samples were then lysed and immunoblotted with antipuromycin antibody, and the intensity of the smears was interpreted as the amount of protein synthesis occurring in 24 hours. Actin was used as a lane loading control. Representative graphs depict results of qPCR with primers to amplify TIF1A and GAPDH used as a housekeeping control, demonstrating the siRNA transfection and silencing efficiency (n = 3). (F) Myotubes were transfected with Scr or KDM2A siRNA and then exposed to NC or HC for 24 hours in the presence of puromycin-containing medium. Samples were then lysed and immunoblotted with antipuromycin antibody, and the intensity of the smears was interpreted as the amount of protein synthesis occurring in 24 hours. Representative graphs depict the results of qPCR with primers to amplify KDM2A and GAPDH as a housekeeping control, demonstrating the siRNA transfection and silencing efficiency (n = 3). **P < 0.01 and ***P < 0.001. C2C12 = immortalized mouse myoblast cell line; Cas9 = CRISPR associated protein 9; FLAG = octapeptide sequence added to the TIF1A gene is DYKDDDDK; HEK293 = human embryonic kidney 293; KDM2A = lysine demethylase 2A; T1F1A = transcription intermediary factor 1-α.
Figure 7.
Figure 7.
A proposed schematic model showing that hypercapnia triggers skeletal muscle anabolic attenuation though a pathway that involves the activation of AMPKα2, downregulation of ribosomal RNA expression, and protein synthesis. We were unable to identify the mechanism that links AMPKα2 with ribosomal gene expression in this setting.

Comment in

References

    1. Jaitovich A, Barreiro E. Skeletal muscle dysfunction in chronic obstructive pulmonary disease: what we know and can do for our patients. Am J Respir Crit Care Med. 2018;198:175–186. - PMC - PubMed
    1. Jaitovich A, Khan MMHS, Itty R, Chieng HC, Dumas CL, Nadendla P, et al. ICU admission muscle and fat mass, survival, and disability at discharge: a prospective cohort study. Chest. 2019;155:322–330. - PMC - PubMed
    1. Sharma R, Florea VG, Bolger AP, Doehner W, Florea ND, Coats AJ, et al. Wasting as an independent predictor of mortality in patients with cystic fibrosis. Thorax. 2001;56:746–750. - PMC - PubMed
    1. Marquis K, Debigaré R, Lacasse Y, LeBlanc P, Jobin J, Carrier G, et al. Midthigh muscle cross-sectional area is a better predictor of mortality than body mass index in patients with chronic obstructive pulmonary disease. Am J Respir Crit Care Med. 2002;166:809–813. - PubMed
    1. Shrikrishna D, Patel M, Tanner RJ, Seymour JM, Connolly BA, Puthucheary ZA, et al. Quadriceps wasting and physical inactivity in patients with COPD. Eur Respir J. 2012;40:1115–1122. - PubMed

Publication types

MeSH terms