. 2019 Oct 1;160(10):2367-2387.
doi: 10.1210/en.2019-00194.

Sex Difference in Corticosterone-Induced Insulin Resistance in Mice

Affiliations

Sex Difference in Corticosterone-Induced Insulin Resistance in Mice

Kasiphak Kaikaew et al. Endocrinology. .

Abstract

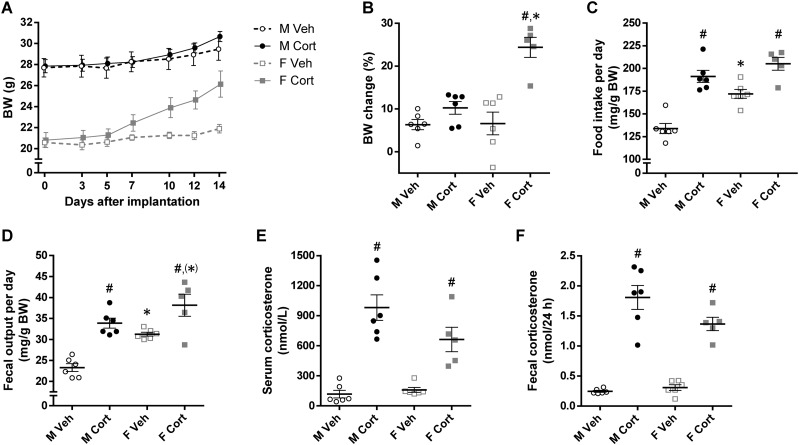
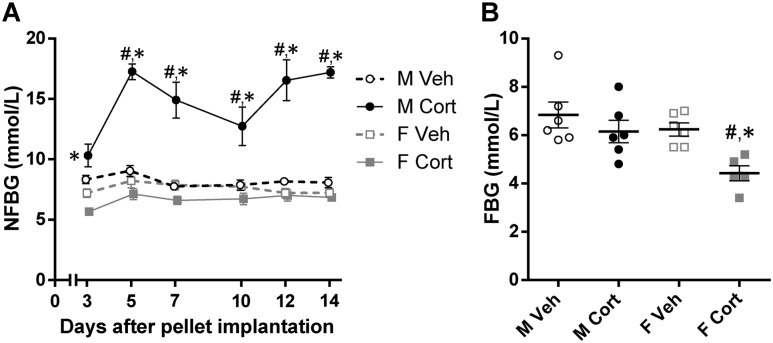
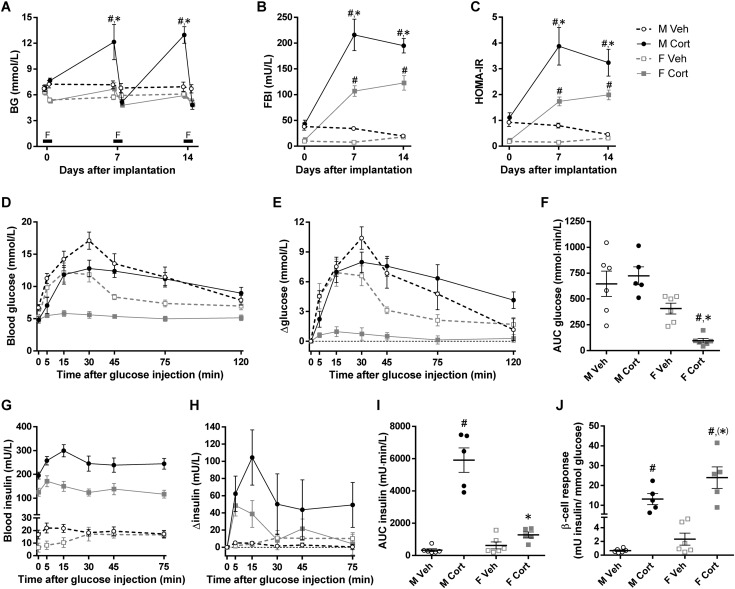
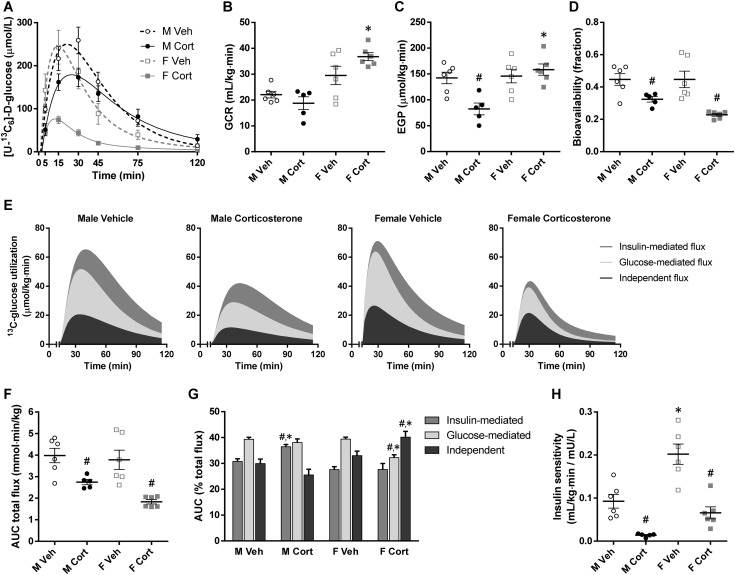
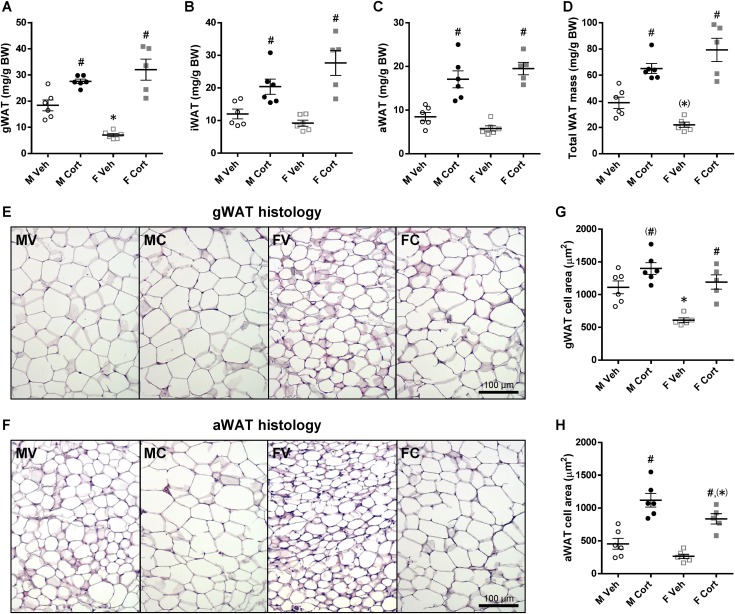
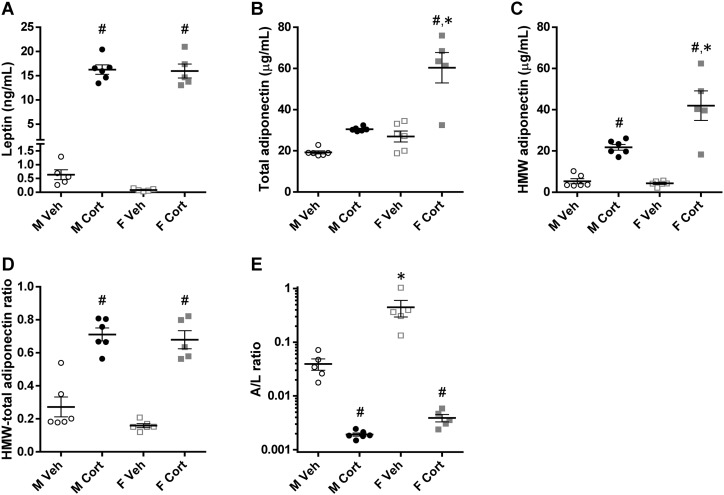
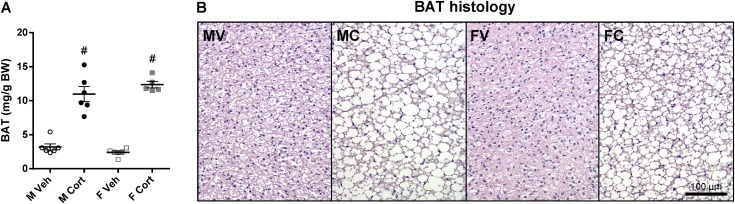
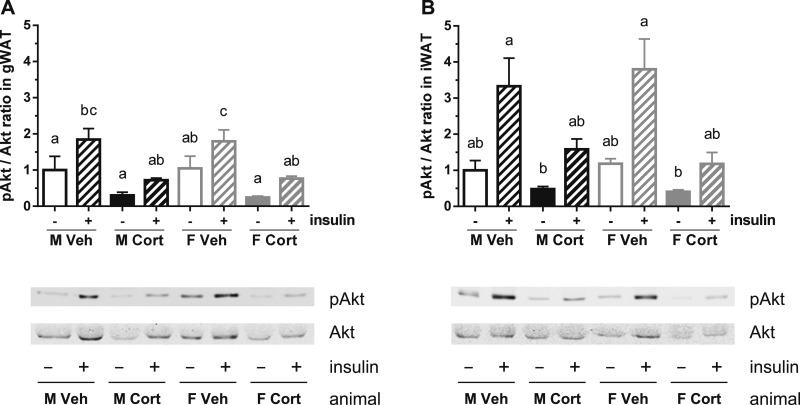
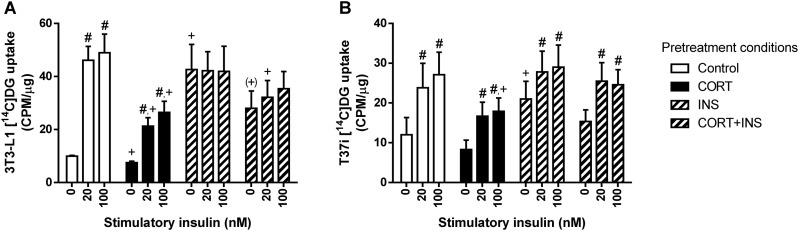
Prolonged exposure to glucocorticoids (GCs) causes various metabolic derangements. These include obesity and insulin resistance, as inhibiting glucose utilization in adipose tissues is a major function of GCs. Although adipose tissue distribution and glucose homeostasis are sex-dependently regulated, it has not been evaluated whether GCs affect glucose metabolism and adipose tissue functions in a sex-dependent manner. In this study, high-dose corticosterone (rodent GC) treatment in C57BL/6J mice resulted in nonfasting hyperglycemia in male mice only, whereas both sexes displayed hyperinsulinemia with normal fasting glucose levels, indicative of insulin resistance. Metabolic testing using stable isotope-labeled glucose techniques revealed a sex-specific corticosterone-driven glucose intolerance. Corticosterone treatment increased adipose tissue mass in both sexes, which was reflected by elevated serum leptin levels. However, female mice showed more metabolically protective adaptations of adipose tissues than did male mice, demonstrated by higher serum total and high-molecular-weight adiponectin levels, more hyperplastic morphological changes, and a stronger increase in mRNA expression of adipogenic differentiation markers. Subsequently, in vitro studies in 3T3-L1 (white) and T37i (brown) adipocytes suggest that the increased leptin and adiponectin levels were mainly driven by the elevated insulin levels. In summary, this study demonstrates that GC-induced insulin resistance is more severe in male mice than in female mice, which can be partially explained by a sex-dependent adaptation of adipose tissues.


Conflict of interest statement

Disclosure Summary: The authors have nothing to disclose.

The datasets generated during and/or analyzed during the current study are not publicly available but are available from the corresponding author on reasonable request.

Figures

Figure 1.
Figure 1.
Compartmental model and formulas used for calculating blood glucose kinetics. (A) Kinetic model used to calculate the kinetic parameters of glucose metabolism upon an IPGTT in mice. Upon injection into the IP compartment, the injected glucose passes the liver to contribute to the accessible plasma glucose pool (Qp) and to the inaccessible “tissue” glucose pool (Qt). Additionally, glucose produced/released by tissues such as the intestine and liver also contribute to Qp. As such, two rates of appearances can be distinguished, namely that of exogenous injected glucose (Raexo) and of endogenous glucose (Raendo). The Qp is in equilibrium with Qt via two rate constants (k1 and k2). Disposal of glucose (U) from the Qp can be divided in insulin-independent glucose-dependent disposal (Uiig) and insulin-independent constant disposal (Uiic). Disposal from the Qt is the sum of insulin-dependent constant disposal (Uidc) and insulin-dependent disposal (Uidi). As with glucose, this model also presumes two compartments for insulin, namely the accessible plasma insulin pool (Ip) and the inaccessible tissue insulin pool (It). (B) Formulas for assessing glucose metabolism indexes and kinetic parameters. HOMA-IR, an acceptable surrogate index for insulin resistance when applying a mouse-specific constant (26, 27), was calculated relative to a median of the vehicle-treated male mice. β-Cell response was estimated as changes in plasma insulin levels relative to changes in glucose levels (28). Subscript b refers to a basal level, subscript 0 refers to an estimated value at time point 0, and Vg indicates the volume of the accessible pool.
Figure 2.
Figure 2.
Effects of corticosterone treatment on BW and energy balance of mice. (A) BW of ad libitum-fed mice before (day 0) and after (days 3 to 14) pellet implantation (repeated three-way ANOVA: PS < 0.001, PC = 0.11, PT < 0.001, PS×C = 0.29, PS×T = 0.02, PC×T < 0.001, PS×C×T < 0.001). (B) BW changes after 2-wk treatment relative to BW before pellet implantation (PS = 0.002, PC < 0.001, PS×C = 0.002). (C) Daily food intake and (D) fecal production relative to BW, determined during days 12 and 14 of treatment (food intake, PS < 0.001, PC < 0.001, PS×C = 0.06; fecal output, PS < 0.001, PC < 0.001, PS×C = 0.20). (E) Serum corticosterone levels (level at time of euthanization: PS = 0.14, PC < 0.001, PS×C = 0.06). (F) Fecal corticosterone levels (average level during days 12 to 14: PS = 0.13, PC < 0.001, PS×C = 0.05). Unless stated, statistical significance was determined by two-way ANOVA. *P < 0.05, (*)P < 0.10 (tendency to significance), for sex difference between mice with the same treatment; #P < 0.05, for effect of corticosterone treatment in mice of the same sex, by post hoc test.
Figure 3.
Figure 3.
Sex-dependent effects of corticosterone treatment on glucose homeostasis. (A) NFBG levels during days 3 to 14 of treatment (repeated three-way ANOVA: PS < 0.001, PC < 0.001, PT < 0.001, PS×C < 0.001, PS×T = 0.02, PC×T < 0.001, PS×C×T = 0.02; two-way ANOVA at each time point: PS < 0.05 every time point, PC = 0.69 for day 3, PC < 0.05 for days 5 to 14, PS×C < 0.05 every time point). (B) Fasting blood glucose levels determined on day 14 of treatment (PS = 0.01, PC = 0.008, PS×C = 0.19). Unless stated, statistical significance was determined by two-way ANOVA. *P < 0.05, for sex difference between mice with the same treatment; #P < 0.05, for effect of corticosterone treatment in mice of the same sex, by post hoc test.
Figure 4.
Figure 4.
Sex-dependent effects of corticosterone treatment on glucose clearance. (A) Nonfasting and 5-h FBG levels (NFBG day 7, PS = 0.003, PC = 0.008, PS×C = 0.06; FBG day 7, PS = 0.22, PC = 0.01, PS×C = 0.60; NFBG day 14, PS < 0.001, PC < 0.001, PS×C < 0.001; FBG day 14, PS = 0.08, PC = 0.009, PS×C = 0.07). F indicates the 5-h fasting period on days 0, 7, and 14. (B) Five-hour FBI levels and (C) HOMA-IR calculated from FBG and insulin levels before (day 0) and after (days 7 and 14) pellet implantation (FBI day 7, PS < 0.001, PC < 0.001, PS×C = 0.009; FBI day 14, PS = 0.001, PC < 0.001, PS×C = 0.002; HOMA-IR day 7, PS < 0.001, PC < 0.001, PS×C = 0.04; HOMA-IR day 14, PS = 0.01, PC < 0.001, PS×C = 0.04). (D) Blood glucose levels, (E) changes in blood glucose levels over individual baseline values, (F) baseline-corrected AUCs of glucose levels, (G) blood insulin levels, (H) changes in blood insulin levels over individual baseline values, and (I) baseline-corrected AUCs of insulin levels after IP glucose administration in the 2-wk vehicle- or corticosterone-treated mice are shown (AUC glucose levels, PS < 0.001, PC = 0.16, PS×C = 0.03; AUC insulin levels, PS < 0.001, PC < 0.001, PS×C < 0.001). (J) β-Cell response to the IPGTT (PS = 0.04, PC < 0.001, PS×C = 0.12). Statistical significance was determined by two-way ANOVA. *P < 0.05, (*)P < 0.10 (tendency to significance), for sex difference between mice with the same treatment; #P < 0.05, for effect of corticosterone treatment in mice of the same sex, by post hoc test.
Figure 5.
Figure 5.
Glucose kinetic parameters from stable isotope-labeled glucose analyses. (A) Blood [U-13C6]-d-glucose levels with model-fitted line plots after IP stable isotope-labeled glucose administration in the 2-wk vehicle- or corticosterone-treated mice. This plot was used for calculating following glucose kinetic parameters. (B) Glucose clearance rate and (C) endogenous glucose production at basal state (before glucose administration; GCR, PS < 0.001, PC = 0.42, PS×C = 0.04; EGP, PS = 0.003, PC = 0.06, PS×C = 0.006). (D) Bioavailability of the injected glucose in the accessible pool of the minimal mouse model (PS = 0.18, PC < 0.001, PS×C = 0.18). (E) Stacked area plots demonstrating utilization of the injected glucose, separated into independent, glucose-mediated, and insulin-mediated fluxes. (F) AUCs of total glucose utilization (AUC total flux, PS = 0.08, PC < 0.001, PS×C = 0.26). (G) Relative percentages of each glucose utilization flux (PS×C < 0.05 for all fluxes). (H) Insulin sensitivity reflecting the clearance of injected glucose by endogenous insulin secretion (PS < 0.001, PC < 0.001, PS×C = 0.10). Statistical significance was determined by two-way ANOVA. *P < 0.05, for sex difference between mice with the same treatment; #P < 0.05, for effect of corticosterone treatment in mice of the same sex, by post hoc test.
Figure 6.
Figure 6.
Sex differences in WAT mass and morphology upon corticosterone treatment. (A–D) gWAT, iWAT, aWAT, and total WAT mass relative to BW of the 2-wk vehicle- or corticosterone-treated mice (gWAT, PS = 0.12, PC < 0.001, PS×C = 0.001; iWAT, PS = 0.33, PC < 0.001, PS×C = 0.04; aWAT, PS = 0.93, PC < 0.001, PS×C = 0.07; total WAT mass, PS = 0.80, PC < 0.001, PS×C = 0.006). (E and F) Hematoxylin and eosin–stained gWAT and aWAT. Experimental group abbreviations: FC, female corticosterone; FV, female vehicle; MC, male corticosterone; MV, male vehicle. Scale bars, 100 µm. (G and H) gWAT and aWAT adipocyte sizes (gWAT, PS < 0.001, PC < 0.001, PS×C = 0.12; aWAT, PS = 0.008, PC < 0.001, PS×C = 0.58). Statistical significance was determined by two-way ANOVA. *P < 0.05, (*)P < 0.10 (tendency to significance), for sex difference between mice with the same treatment; #P < 0.05, for effect of corticosterone treatment in mice of the same sex, by post hoc test.
Figure 7.
Figure 7.
Serum adipokine levels. (A) Serum leptin levels and (B and C) serum total adiponectin and HMW isoform levels of the 2-wk vehicle- or corticosterone-treated mice (leptin, PS = 0.64, PC < 0.001, PS×C = 0.89; total adiponectin, PS < 0.001, PC < 0.001, PS×C = 0.005; HMW adiponectin, PS = 0.008, PC < 0.001, PS×C = 0.004). (D) Ratio of the HMW isoform to the total adiponectin levels (PS = 0.12, PC < 0.001, PS×C = 0.37). (E) Ratio of adiponectin to leptin levels, illustrated on a logarithmic scale (PS < 0.001, PC < 0.001, PS×C = 0.007). Statistical significance was determined by two-way ANOVA. *P < 0.05, for sex difference between mice with the same treatment; #P < 0.05, for effect of corticosterone treatment in mice of the same sex, by post hoc test.
Figure 8.
Figure 8.
BAT mass and morphology upon corticosterone treatment. (A) BAT mass relative to BW of the 2-wk vehicle- or corticosterone-treated mice (PS = 0.68, PC < 0.001, PS×C = 0.12). (B) Hematoxylin and eosin–stained BAT. Experimental group abbreviations: FC, female corticosterone; FV, female vehicle; MC, male corticosterone; MV, male vehicle. Scale bar, 100 µm. Statistical significance was determined by two-way ANOVA. #P < 0.05, for effect of corticosterone treatment in mice of the same sex, by post hoc test.
Figure 9.
Figure 9.
Insulin-stimulated Akt phosphorylation in WAT explants. (A and B) Akt phosphorylation level in (A) gWAT and (B) iWAT of the vehicle- or corticosterone-treated mice, ex vivo stimulated with insulin (gWAT, PS = 0.99, PC = 0.005, PI < 0.001, PS×C = 0.99, PS×I = 0.95, PC×I = 0.02, PS×C×I = 0.39; iWAT, PS = 0.91, PC = 0.004, PI < 0.001, PS×C = 0.45, PS×I = 0.97, PC×I = 0.02, PS×C×I = 0.57). Akt phosphorylation level was normalized to total Akt and expressed relative to the level of vehicle-treated male explants. A representative blot is shown of three biological samples per group. Statistical significance was determined by repeated three-way ANOVA with post hoc Tukey test: letters a, b, and c denote significant group differences (P < 0.05).
Figure 10.
Figure 10.
Insulin-stimulated radioactive glucose uptake in corticosterone- and/or insulin-treated 3T3-L1 and T37i adipocytes. (A) Differentiated 3T3-L1 white adipocytes and (B) differentiated T37i brown adipocytes pretreated with corticosterone (PC) and/or insulin (PI) for 24 h were stimulated with insulin (SI) at the indicated concentrations for 15 min, and subsequently 2-[1-14C]-deoxy-d-glucose was added to determine glucose uptake (3T3-L1, PPC = 0.03, PPI = 0.09, PSI < 0.001, PPC×PI = 0.60, PPC×SI = 0.08, PPI×SI < 0.001, PPC×PI×SI = 0.001; T37i, PPC = 0.22, PPI = 0.16, PSI < 0.001, PC×PI = 0.77, PPC×SI = 0.46, PPI×SI = 0.17, PPC×PI×SI = 0.15). Data from three independent experiment were plotted in counts per minute, relative to protein content (µg) of each sample. Pretreatment condition abbreviations: CORT, corticosterone; CORT+INS, cotreatment with corticosterone and insulin; INS, insulin. Statistical significance was determined by repeated three-way ANOVA. +P < 0.05, (+)P < 0.10 (tendency to significance), for difference from baseline uptake of control condition; #P < 0.05, for effect of the stimulatory insulin from its baseline uptake, by post hoc Dunnett test.

Similar articles

Cited by

References

    1. Kuo T, McQueen A, Chen TC, Wang JC. Regulation of glucose homeostasis by glucocorticoids. Adv Exp Med Biol. 2015;872:99–126. - PMC - PubMed
    1. Ramamoorthy S, Cidlowski JA. Corticosteroids: mechanisms of action in health and disease. Rheum Dis Clin North Am. 2016;42(1):15–31. - PMC - PubMed
    1. Juszczak A, Morris DG, Grossman AB, Nieman LK. Cushing’s syndrome. In: Jameson JL, De Groot LJ, de Kretser DM, Giudice LC, Grossman AB, Melmed S, Potts JT Jr, Weir GC, eds. Endocrinology: Adult and Pediatric. 7th ed Philadelphia, PA: Elsevier Saunders; 2016:227–255.e11.
    1. Magomedova L, Cummins CL. Glucocorticoids and metabolic control. Handb Exp Pharmacol. 2016;233:73–93. - PubMed
    1. Nieman LK. Cushing’s syndrome: update on signs, symptoms and biochemical screening. Eur J Endocrinol. 2015;173(4):M33–M38. - PMC - PubMed

MeSH terms