. 2019 Dec;87(12):1361-1377.
doi: 10.1002/prot.25767. Epub 2019 Jul 16.

Estimation of model accuracy in CASP13

Affiliations

Estimation of model accuracy in CASP13

Jianlin Cheng et al. Proteins. 2019 Dec.

Abstract

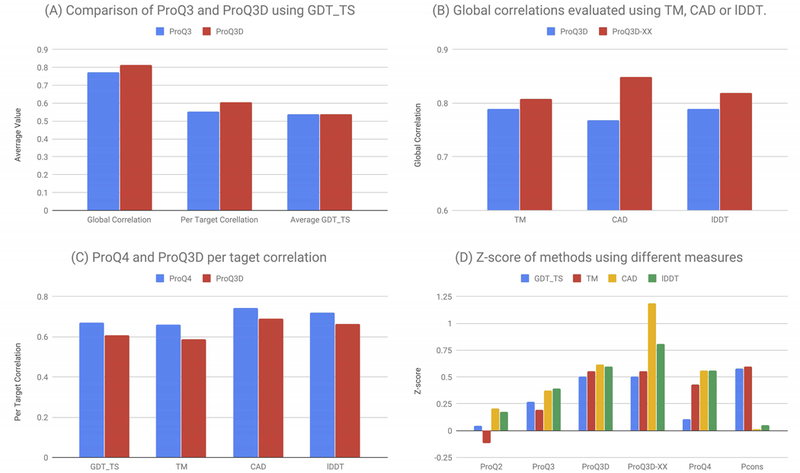
Methods to reliably estimate the accuracy of 3D models of proteins are both a fundamental part of most protein folding pipelines and important for reliable identification of the best models when multiple pipelines are used. Here, we describe the progress made from CASP12 to CASP13 in the field of estimation of model accuracy (EMA) as seen from the progress of the most successful methods in CASP13. We show small but clear progress, that is, several methods perform better than the best methods from CASP12 when tested on CASP13 EMA targets. Some progress is driven by applying deep learning and residue-residue contacts to model accuracy prediction. We show that the best EMA methods select better models than the best servers in CASP13, but that there exists a great potential to improve this further. Also, according to the evaluation criteria based on local similarities, such as lDDT and CAD, it is now clear that single model accuracy methods perform relatively better than consensus-based methods.


Figures

Figure 1:
Figure 1:
Flow of data and processes for the ModFOLD7 method variants. The inputs at the top are simply a single 3D model and the target sequence. The target sequence was pre-processed by a number of different methods to produce predicted secondary structures, contacts, disorder and reference models. These data were then fed into the 10 different scoring methods to produce local scores. The local scores were then used as inputs to neural networks, which were then trained using either the S-score or the lDDT score as the target function. The mean local scores for each model were then taken to produce global scores from each input method. Combinations of these global scores were used to generate ModFOLD7_rank, ModFOLD7_cor and ModFOLD7 global scores
Figure 2:
Figure 2:
(A) Comparison of average score of the first ranked model for each target in relationship to the score of the best model made by any server using different evaluation measures. In blue the best server and in red the model selected by the best EMA method. In darker colors easy targets (average GDT_TS > 0.5) and in lighter colors the harder targets. In (B) the number of EMA methods that are better than best server is shown. (C) Boxplot of per target loss for the top group methods based on the GDT-TS score. The rectangular box shows the median, 25% percentile, 75% percentile of the loss on 80 targets. Dots of different shapes/colors denote the loss of individual targets of different types (MultiDomain, SingleDomain, FM, FM/TBM, TBM-easy, TBM-hard). The mean of the loss is also listed next to the name of each method. (D) Boxplot of per target correlation for the top group methods based on the GDT-TS score.
Figure 3:
Figure 3:
Relative success of different EMA methods in predicting four reference-based evaluation scores. The relative success according to each of the four scores is expressed as the difference between the actual percentage and 25%. Positive values indicate relatively higher success, negative values indicate relatively lower success. For each method positive values balance out negative ones (their sum is zero). EMA methods are ordered by increasing disbalance, which is unrelated to the absolute performance. The methods that are not classified as single-model are indicated with the bold italic font.
Figure 4:
Figure 4:
(A) Average per target Pearson correlations between lDDT and the predicted accuracy scores of our EMA methods for top N models. (B) First ranked lDDT loss for top N models. Top N models are selected based on lDDT scores. For example, top 10 models are the 10 models that have the best lDDT scores. The methods in the legend are sorted according to Area Under the Curve (AUC) values.
Figure 5:
Figure 5:
(A) Comparison of MULTICOM_CLUSTER method with individual QA methods used in feature generation. Each box plot shows the loss of each QA method. Here the loss is measure at 1-point scale (i.e. the highest/perfect GDT-TS score = 1). The set of features include: 3 contact match scores, 3 clustering-based scores, and 17 single-model QA scores. (B) Comparison of different consensus strategies on individual QA features. The methods were evaluated according to average GDT-TS loss calculated from the 80 full-length targets. (C) Comparison of different consensus strategies on 42 template-based (TBM-easy and TBM-hard) targets, and 38 free-modeling targets (FM+FM/TBM), respectively. If any domain of each target is classified as FM or FM/TBM, the target is defined as free-modeling target, otherwise, template-based target. (D) Impact of contact prediction accuracy on protein model accuracy assessment in CASP13 datasets. The loss with/without each kind of contact features (i.e., top L/5 contacts of short-range, medium-range, long-range) is shown and compared. The loss was consistently reduced on the CASP13 dataset if the precision of contacts used with MULTICOM_CLUSTER is higher than 0.5, otherwise the impact of contacts is mixed. (E). Impact of contact prediction accuracy on protein model accuracy assessment in terms of correlation.
Figure 6:
Figure 6:
Here we compare the performance of different ProQ versions in CASP13. (A) Compares the difference in performance between ProQ3 and ProQ3D using GDT_TS as an evaluation criteria. Three measures are reported, global correlation, per target correlation and average GDT_TS score for the first ranked model. (B) Compares the performance of different versions of ProQ3D using the global correlation of all targets. Here evaluation is for different versions of ProQ3D trained on different target functions, with ProQ3D-XX is ProQ3 trained on the target function on which it is evaluated. ProQ3D is trained on S-score. (C) Compares ProQ3D and ProQ4 when it comes to per target correlation. (D) Plots the Z-score of performance for the different ProQ versions and Pcons for the global correlation.
Figure 7.
Figure 7.
Histograms summarising the improvements in ModFOLD7 variants versus ModFOLD6 variants on CASP11–13 datasets. Model data from QA stages 1 and 2 are combined with duplicate models removed. Left panels show the ranking/model selection performance measures by cumulative GDT_TS scores of the top selected models by each method. Middle panels show Pearson correlation coefficients of global predicted accuracy versus observed accuracy according to GDT-TS. Right panels show performance of local accuracy estimates as measured by the Area Under the Curve (AUC) scores from ROC analysis using the lDDT observed local scores.
Figure 8:
Figure 8:
(A) Histogram of VoroMQA losses in selecting best models. (B) Quantile-based grouping for global scores. (C) Quantile-based grouping for local scores (the box plots were drawn based on more than a million residue scores, outliers are not shown for clarity). Colored numbers under the horizontal axis are the empirical quantile values derived from the observed distributions of the different assessed scores.

Similar articles

Cited by

References

    1. Elofsson A et al. Methods for estimation of model accuracy in CASP12. Proteins 86 Suppl 1, 361–373 (2018). - PubMed
    1. Roche DB, Buenavista MT & McGuffin LJ Assessing the quality of modelled 3D protein structures using the ModFOLD server. Methods Mol. Biol. 1137, 83–103 (2014). - PubMed
    1. Wallner B & Elofsson A Can correct protein models be identified? Protein Sci. 12, 1073–1086 (2003). - PMC - PubMed
    1. Cao R, Bhattacharya D, Adhikari B, Li J & Cheng J Massive integration of diverse protein quality assessment methods to improve template based modeling in CASP11. Proteins 84 Suppl 1, 247–259 (2016). - PMC - PubMed
    1. Olechnovič K & Venclovas Č VoroMQA: Assessment of protein structure quality using interatomic contact areas. Proteins 85, 1131–1145 (2017). - PubMed

Publication types