. 2019 Sep;9(9):1288-1305.
doi: 10.1158/2159-8290.CD-19-0161. Epub 2019 Jul 2.

Innate αβ T Cells Mediate Antitumor Immunity by Orchestrating Immunogenic Macrophage Programming

Affiliations

Innate αβ T Cells Mediate Antitumor Immunity by Orchestrating Immunogenic Macrophage Programming

Mautin Hundeyin et al. Cancer Discov. 2019 Sep.

Abstract

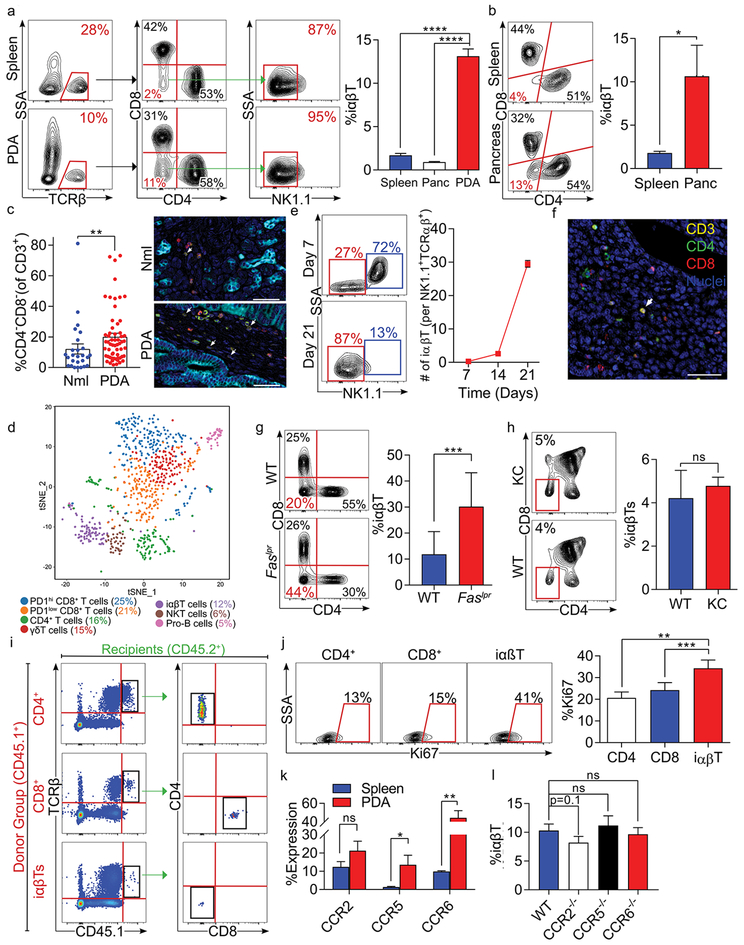
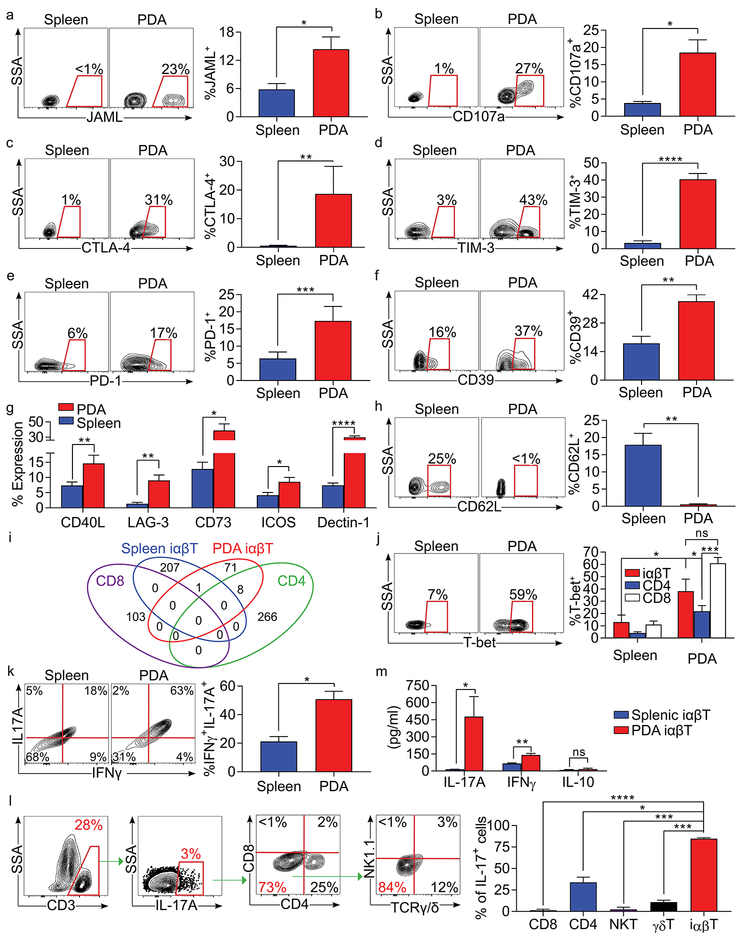
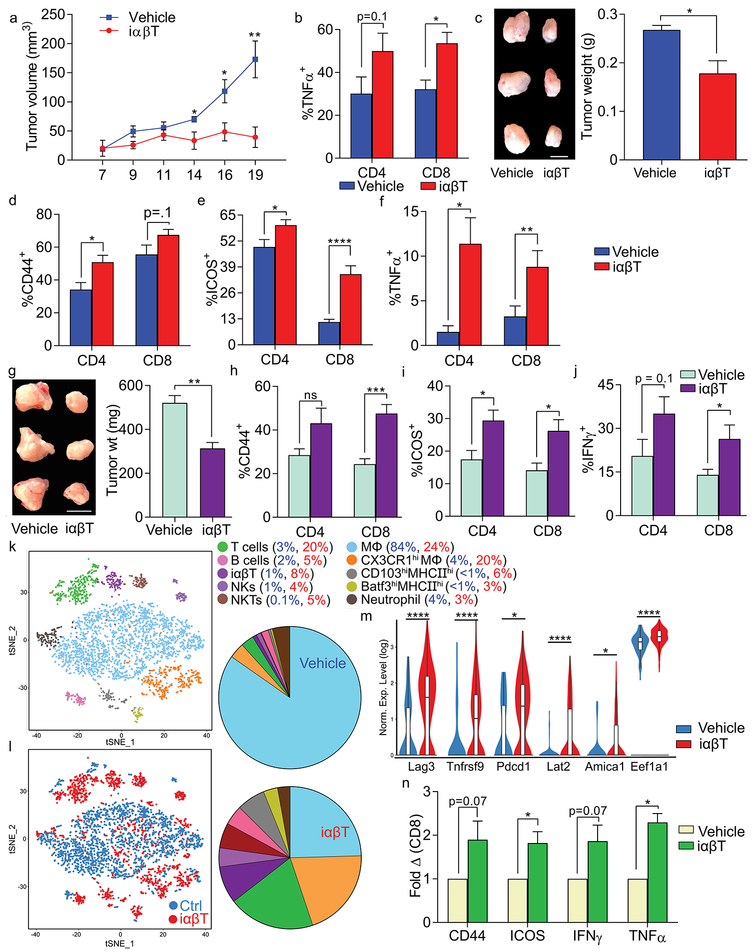
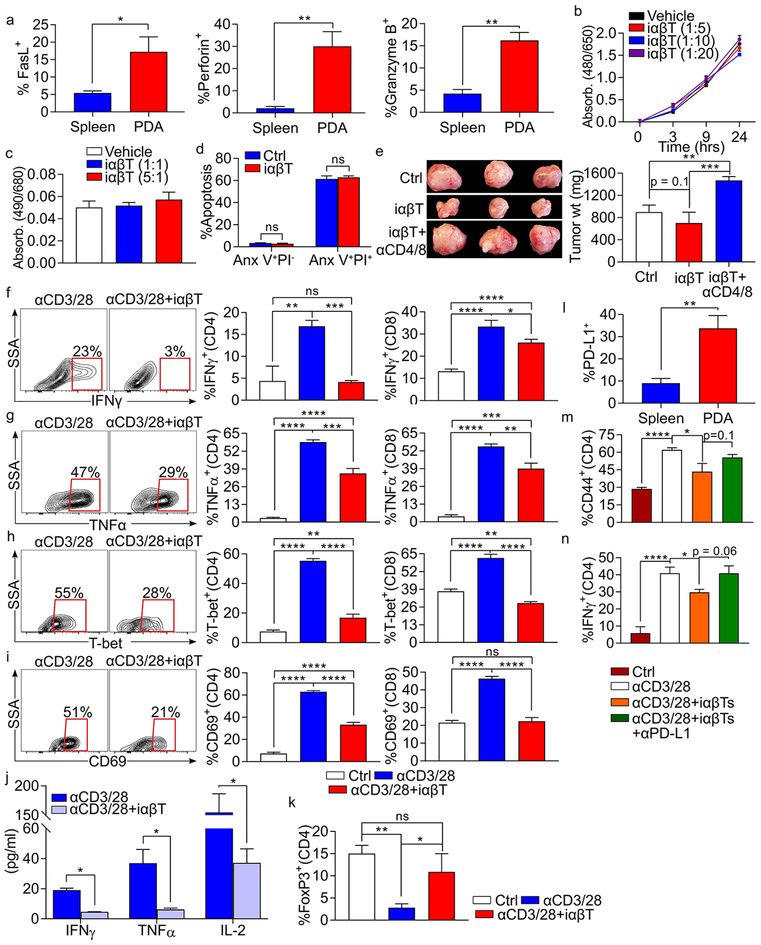
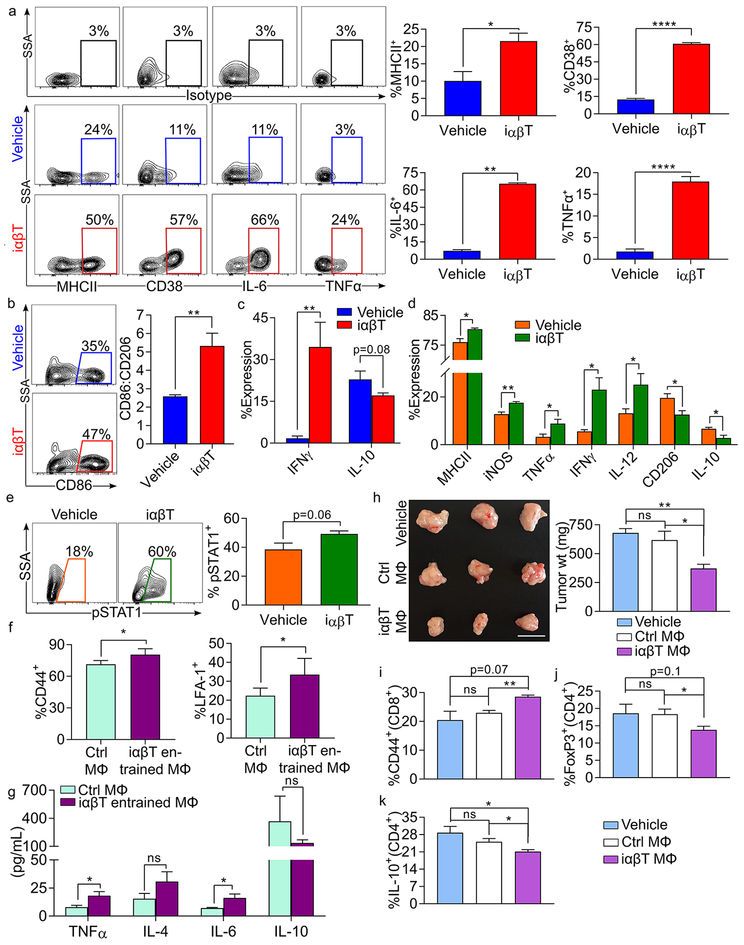
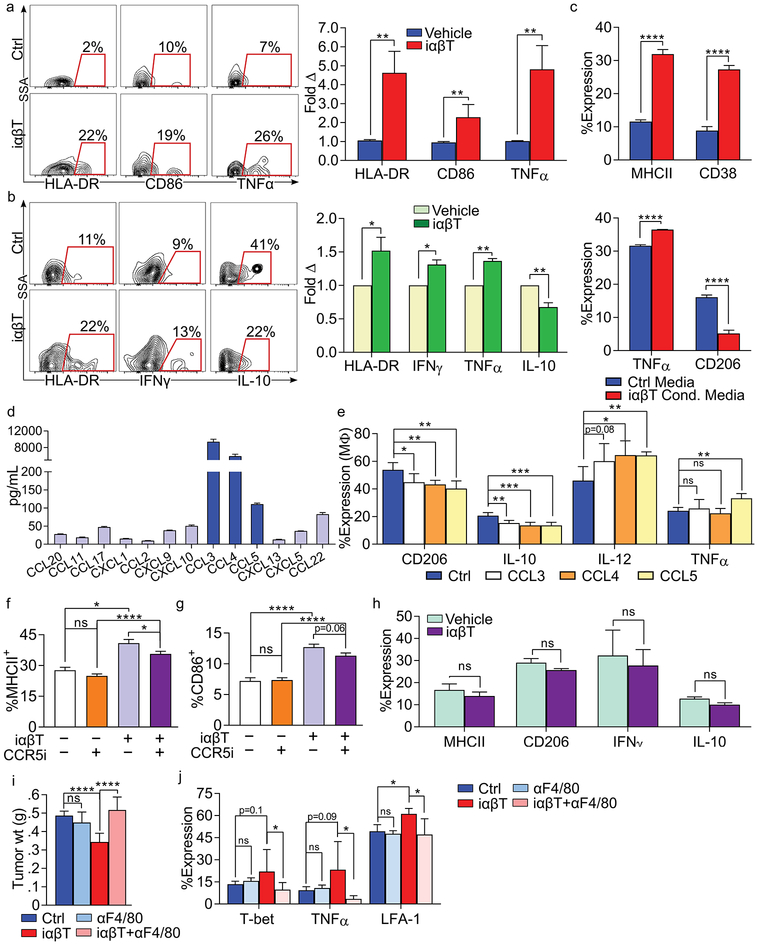
Unconventional T-lymphocyte populations are emerging as important regulators of tumor immunity. Despite this, the role of TCRαβ+CD4-CD8-NK1.1- innate αβ T cells (iαβT) in pancreatic ductal adenocarcinoma (PDA) has not been explored. We found that iαβTs represent ∼10% of T lymphocytes infiltrating PDA in mice and humans. Intratumoral iαβTs express a distinct T-cell receptor repertoire and profoundly immunogenic phenotype compared with their peripheral counterparts and conventional lymphocytes. iαβTs comprised ∼75% of the total intratumoral IL17+ cells. Moreover, iαβT-cell adoptive transfer is protective in both murine models of PDA and human organotypic systems. We show that iαβT cells induce a CCR5-dependent immunogenic macrophage reprogramming, thereby enabling marked CD4+ and CD8+ T-cell expansion/activation and tumor protection. Collectively, iαβTs govern fundamental intratumoral cross-talk between innate and adaptive immune populations and are attractive therapeutic targets. SIGNIFICANCE: We found that iαβTs are a profoundly activated T-cell subset in PDA that slow tumor growth in murine and human models of disease. iαβTs induce a CCR5-dependent immunogenic tumor-associated macrophage program, T-cell activation and expansion, and should be considered as novel targets for immunotherapy.See related commentary by Banerjee et al., p. 1164.This article is highlighted in the In This Issue feature, p. 1143.


Conflict of interest statement

The authors declare no competing interests.

Figures

Figure 1.
Figure 1.. iαβTs expand in PDA.
(a) CD45+ leukocytes infiltrating day 21 orthotopic KPC tumors, normal pancreas, and spleens in WT mice were gated and tested for the frequency of TCRβ+CD4CD8NK1.1 iαβTs. Representative contour plots and quantitative data are shown (n=10). (b) CD45+TCRβ+ NK1.1 leukocytes from pancreata and spleens of 6 month-old KC mice were gated and tested for co-expression CD4 and CD8. Representative contour plots are shown (n=5). (c) Multiplex IHC of human PDA and adjacent normal pancreas were stained for CK19, CD3, CD4, and CD8. The frequency of CD3+CD4CD8 cells were quantified and representative images are shown. (d) Orthotopic KPC tumors were harvested from WT mice on day 21. CD45+CD3+ leukocytes were purified by FACS and analyzed by single cell RNAseq. The distribution of cellular clusters was determined using the t-Distributed Stochastic Neighbor Embedding (t-SNE) algorithm. Each cluster is identified by a distinct color. Percent cellular abundance in each cluster is indicated. (e) Orthotopic KPC tumors were harvested from WT mice on days 7, 14, or 21 after tumor cell implantation and tumor-infiltrating CD45+TCRβ+CD4CD8 leukocytes were gated and tested for expression of NK1.1. Representative contour plots from days 7 and 21 and quantitative data comparing frequency of tumor-infiltrating iαβT per NKT cells at all time points are shown (n=5/time point). (f) Paraffin-embedded sections made from tumors of mice serially treated with anti-TCRγ/δ and NK1.1 depleting antibodies were tested for co-expression of Hematoxylin, CD3, CD4, and CD8 in the PDA TME. (g) CD45+TCRβ+NK1.1 leukocytes infiltrating orthotopic KPC tumors in WT and Faslpr mice were gated and tested for expression of CD4 and CD8. Representative contour plots and quantitative data are shown (n=5/group). (h) The thymus from 6-month old WT and KC mice were harvested and CD45+TCRβ+ thymocytes were gated and tested for expression of CD4 and CD8. The frequency of iαβTs in the thymus was calculated (n=5/group). (i) CD4+ T cells, CD8+ T cells, or iαβTs were harvested from CD45.1 mice and transferred i.v. to orthotopic PDA-bearing CD45.2 mice. PDA tumors were harvested at 96 hours and CD45.1+ cells were gated and tested for CD4 and CD8 expression. Representative contour plots are shown (n=5/group). (j) WT mice were orthotopically administered KPC tumor cells and sacrificed on day 21. PDA-infiltrating CD4+ T cells, CD8+ T cells, and iαβTs were assayed for Ki67 proliferative index. Representative contour plots and quantitative data are shown (n=5). (k) Splenic and orthotopic PDA-infiltrating iαβTs were tested on day 21 for expression of CCR2, CCR5, and CCR6 (n=5). (l) The frequency of PDA-infiltrating iαβTs was tested on day 21 in WT, CCR2–/–, CCR5–/–, and CCR6–/– hosts (n=5/group). All experiments were repeated at least 3 times (*p<0.05, **p<0.01, ***p<0.001, ****p<0.0001).
Figure 2.
Figure 2.. iαβTs infiltrating PDA are phenotypically distinct.
WT mice bearing orthotopic KPC tumors were sacrificed on day 21. (a-g) Splenic and PDA-infiltrating iαβTs were tested for expression of (a) JAML, (b) CD107a, (c) CTLA-4, (d) TIM-3, (e) PD-1, (f) CD39, (g) CD40L, LAG-3, CD73, ICOS, and Dectin-1. (h) Splenic and PDA-infiltrating iαβTs were tested for expression of CD62L. (i) TCR sequencing of splenic iαβTs and PDA-infiltrating iαβTs, CD4+ and CD8+ T cells was performed in triplicate and assessed for overlapping clones between populations. (j) Splenic and PDA-infiltrating iαβTs, CD4+ T cells, and CD8+ T cells were tested for expression of T-bet. (k) Splenic and orthotopic PDA-infiltrating iαβTs were tested for co-expression of IFNγ and IL-17A. (l) PDA-infiltrating CD3+IL-17+ cells were gated and tested for the frequency of CD4+ T cells, CD8+ T cells, NKT cells, γδT cells, and iαβTs. (m) Splenic and PDA-infiltrating iαβTs were cultured in vitro for 24h and cell culture supernatant was harvested and assayed for IL-17, IFNγ, and IL-10 (n=5/group). Flow cytometry experiments were repeated more than 4 times with similar results (n=5 mice for each replicate experiment; *p<0.05, **p<0.01, ***p<0.001, ****p<0.0001).
Figure 3.
Figure 3.. iαβTs protect against PDA and enhance intra-tumoral T cell immunity.
(a) WT mice were administered KPC tumor cells subcutaneously, either alone or admixed with iαβTs. Tumor growth was serially measured (n=5/group). (b) WT mice were administered KPC tumor cells subcutaneously, either alone or admixed with PDA-infiltrating iαβTs. On day 21, tumor-infiltrating CD8+ T cells were analyzed for expression of TNFα (n=5/group). (c-f) WT mice were orthotopically administered KPC tumor cells, either alone or admixed with iαβTs. Tumors were harvested on day 21. (c) Representative pictures of tumors and quantitative analysis of tumor weight are shown. (d) PDA-infiltrating CD4+ and CD8+ T cells were analyzed for expression of CD44, (e) ICOS, and (f) TNFα (n=5/group). Each mouse experiment was repeated more than 3 times. (g-j) Mice with established orthotopic KPC tumor were serially transferred i.v. twice weekly with iαβTs or vehicle beginning on day 5 (n=5). Mice were sacrificed at day 21 after tumor implantation. (g) Representative pictures of tumors and quantitative analysis of tumor weight are shown. (h) PDA-infiltrating CD4+ and CD8+ T cells were analyzed for expression of CD44, (i) ICOS, and (j) IFNγ. Subcutaneous and orthotopic tumor experiments were each repeated at least 4 times. (k-m) Mice with established orthotopic KPC tumor were serially transferred i.v. twice weekly with iαβTs or vehicle beginning on day 5. Mice were sacrificed at day 21 and single cell RNAseq performed on FACS-purified CD45+ tumor-infiltrating leukocytes. (k) The distribution of cellular clusters was determined using the t-SNE algorithm. Each cluster is identified by a distinct color. (l) A t-SNE plot overlay of tumor-infiltrating leukocytes in tumors of mice treated with iαβTs (red) vs vehicle (blue) is shown. Percent cellular abundance in each cluster is depicted in pie charts and specified in the accompanying legend. (m) Violin plots comparing normalized log expression of select genes in the T cell cluster for both treatment groups are shown. (n) PDOTS derived from resected human tumors were treated with autologous iαβTs or vehicle. At 72h, CD8+ T cells were analyzed for expression of CD44, ICOS, IFNγ, and TNFα. Data is indicated as fold change in the iαβT cell-treated group compared to vehicle-treatment (n=5 patients; *p<0.05, **p<0.01, ***p<0.001, ****p<0.0001).
Figure 4.
Figure 4.. iαβTs induce T cell dependent tumor immunity but are directly suppressive to conventional T cells.
(a) WT mice bearing orthotopic KPC tumors were sacrificed on day 21. Splenic and PDA-infiltrating iαβTs were tested for expression of FasL, Perforin, and Granzyme B (n=5 mice). (b, c) iαβTs were harvested by FACS from orthotopic PDA tumors and cultured in various ratio with KPC tumor cells. (b) Proliferation of KPC tumors cells was tested using the XTT assay. (c) Cytotoxicity against KPC tumor cells was determined in an LDH release assay. (d) iαβTs were harvested by FACS from orthotopic PDA tumors and cultured in 1:1 ratio with KPC tumor cells. KPC tumor cell apoptosis was determined by co-staining for Annexin V and PI. (e) WT mice were orthotopically administered KPC tumor cells admixed with iαβTs. Cohorts were either serially depleted of both CD4+ and CD8+ T cells or administered isotype control before sacrifice on day 21. Representative images and quantitative analysis of tumor weights are shown (n=5/group). This experiment was repeated twice. (f-i) Polyclonal splenic CD4+ or CD8+ T cells were cultured without stimulation, stimulated by CD3/CD28 co-ligation, or stimulated by CD3/CD28 co-ligation in co-culture with iαβTs. CD4+ and CD8+ T cell activation were determined at 72h by their expression of (f) IFNγ, (g) TNFα, (h) T-bet, and (i) CD69. Representative contour plots and quantitative data are shown. (j) Polyclonal splenic CD3+ T cells were stimulated by CD3/CD28 co-ligation, either alone or in co-culture with iαβTs. Cell culture supernatant was tested for expression of IFNγ, TNFα, and IL-2 at 72h. (k) Polyclonal splenic CD4+ T cells were cultured without stimulation, stimulated by CD3/CD28 co-ligation, or stimulated by CD3/CD28 co-ligation in co-culture with iαβTs. CD4+ T cells were tested for expression of FoxP3 at 72h. (l) Spleen and PDA-infiltrating iαβTs were tested for expression of PD-L1 by flow cytometry. (m, n) Polyclonal splenic CD4+ T cells from PD-L1–/– mice were cultured without stimulation, stimulated by CD3/CD28 co-ligation, or stimulated by CD3/CD28 co-ligation in co-culture with WT iαβTs, either alone or with an αPD-L1 neutralizing mAb. CD4+ T cells were tested for expression of (m) CD44 and (n) IFNγ at 72h. Experiments were performed in replicates of 5 and repeated at least 4 times (*p<0.05, **p<0.01, ***p<0.001, ****p<0.0001).
Figure 5.
Figure 5.. iαβTs induce immunogenic reprogramming of macrophages.
(a-c) Splenic macrophages were cultured alone or co-cultured with iαβTs for 24h. Macrophages were then harvested and tested for expression of (a) MHC II, CD38, IL-6, TNFα, (b) CD86, CD206, (c) IFNγ, and IL-10. Select contour plots and quantitative data are shown. This experiment was repeated 5 times. (d, e) KPC tumor-bearing mice were adoptively transferred with iαβTs. Tumors were harvested on day 21 and TAMs were analyzed for expression of (d) MHCII, iNOS, TNFα, IFNγ, IL-12, CD206, IL-10, and (e) pSTAT1. This experiment was repeated twice (n=5/group). (f, g) iαβT cell-entrained splenic macrophages and control splenic macrophages were pulsed with Ova323–339 peptide and used to stimulated Ova-restricted CD4+ T cells. T cell activation was determined at 96h by expression of (f) CD44 and LFA-1. (g) Cell culture supernatant was harvested and tested for expression of TNFα, IL-4, IL-6, and IL-10. In vitro experiments were performed in replicates of 5 and repeated 3 times. (h-k) Cohorts of WT mice were administered orthotopic KPC tumor either alone, admixed with control macrophages or macrophages that had been co-cultured with iαβTs. Pancreatic tumors were harvested on day 21 (n=5/group). (h) Tumor weights were recorded. (i) Tumor infiltrating CD8+ T cells were analyzed for expression of CD44. (j) Tumor infiltrating CD4+ T cells were analyzed for expression of FoxP3 and (k) IL-10. This experiment was repeated twice (*p<0.05, **p<0.01, ***p<0.001, ****p<0.0001).
Figure 6.
Figure 6.. iαβTs induce immunogenic macrophage programming via CCR5 activation.
(a) iαβTs were FACS-sorted from 3 healthy volunteers and co-cultured with autologous naïve PBMC-derived macrophages. At 24h, macrophage expression of HLA-DR, CD86, and TNF-α were determined by flow cytometry. Experiments for each individual were performed in triplicate. Representative contour plots are shown and quantitative data is presented as fold-change in expression compared with macrophages cultured alone. (b) Human PDOTS were treated with autologous iαβTs or vehicle. Tumor-associated macrophages were tested for expression of HLA-DR, IFNγ, TNFα, and IL-10. Representative contour plots are shown and quantitative data is indicated as fold-change in expression compared to vehicle treatment (n=5 patients). (c) Naive macrophages were cultured with iαβT cell conditioned media or control media. After 24h, macrophage expression of MHCII, CD38, TNF-α, and CD206 were determined by flow cytometry. This experiment was repeated 3 times. (d) iαβTs were FACS-sorted from orthotopic PDA tumors and cultured for 24h. Cell culture supernatant was analyzed in a chemokine array. This experiment was repeated twice (n=5). (e) WT bone marrow-derived macrophages were treated with rCCL3, rCCL4, rCCL5, or vehicle and assessed at 24h. (f, g) WT derived macrophages were cultured alone or co-cultured with PDA-infiltrating iαβTs for 24h. A CCR5 small molecule inhibitor (CCR5i) or vehicle was added to select wells. Macrophage expression of (f) MHC II and (g) CD86. This experiment was repeated 3 times (n=5/group). (h) CCR5–/– macrophages were cultured with PDA-infiltrating iαβTs for 24h. Macrophage expression of MHC II, CD206, IFNγ, and IL-10 were determined. This experiment was repeated 4 times in replicates of 5. (i, j) Orthotopic PDA tumors were harvested from control WT mice or WT mice treated with αF4/80, iαβT cell transfer, or αF4/80 plus iαβT cell transfer. (i) tumor weights were measured and (j) CD8+ T cell activation was determined by expression of T-bet, TNFα, and LFA-1 (n=7/group; *p<0.05, **p<0.01, ***p<0.001, ****p<0.0001).

Comment in

References

    1. Guerra C, Schuhmacher AJ, Canamero M, Grippo PJ, Verdaguer L, Perez-Gallego L, et al. Chronic pancreatitis is essential for induction of pancreatic ductal adenocarcinoma by K-Ras oncogenes in adult mice. Cancer Cell 2007;11(3):291–302 doi 10.1016/j.ccr.2007.01.012. - DOI - PubMed
    1. Biswas SK, Mantovani A. Macrophage plasticity and interaction with lymphocyte subsets: cancer as a paradigm. Nat Immunol 2010;11(10):889–96 doi 10.1038/ni.1937. - DOI - PubMed
    1. DeNardo DG, Barreto JB, Andreu P, Vasquez L, Tawfik D, Kolhatkar N, et al. CD4(+) T cells regulate pulmonary metastasis of mammary carcinomas by enhancing protumor properties of macrophages. Cancer Cell 2009;16(2):91–102 doi 10.1016/j.ccr.2009.06.018. - DOI - PMC - PubMed
    1. Jang JE, Hajdu CH, Liot C, Miller G, Dustin ML, Bar-Sagi D. Crosstalk between Regulatory T Cells and Tumor-Associated Dendritic Cells Negates Anti-tumor Immunity in Pancreatic Cancer. Cell Rep 2017;20(3):558–71 doi 10.1016/j.celrep.2017.06.062. - DOI - PMC - PubMed
    1. Daley D, Zambirinis CP, Seifert L, Akkad N, Mohan N, Werba G, et al. gammadelta T Cells Support Pancreatic Oncogenesis by Restraining alphabeta T Cell Activation. Cell 2016;166(6):1485–99 e15 doi 10.1016/j.cell.2016.07.046. - DOI - PMC - PubMed

Publication types

Substances