. 2019 Jul 31;132(15):jcs232132.
doi: 10.1242/jcs.232132.

Acylpeptide hydrolase is a novel regulator of KRAS plasma membrane localization and function

Affiliations

Acylpeptide hydrolase is a novel regulator of KRAS plasma membrane localization and function

Lingxiao Tan et al. J Cell Sci. .

Abstract

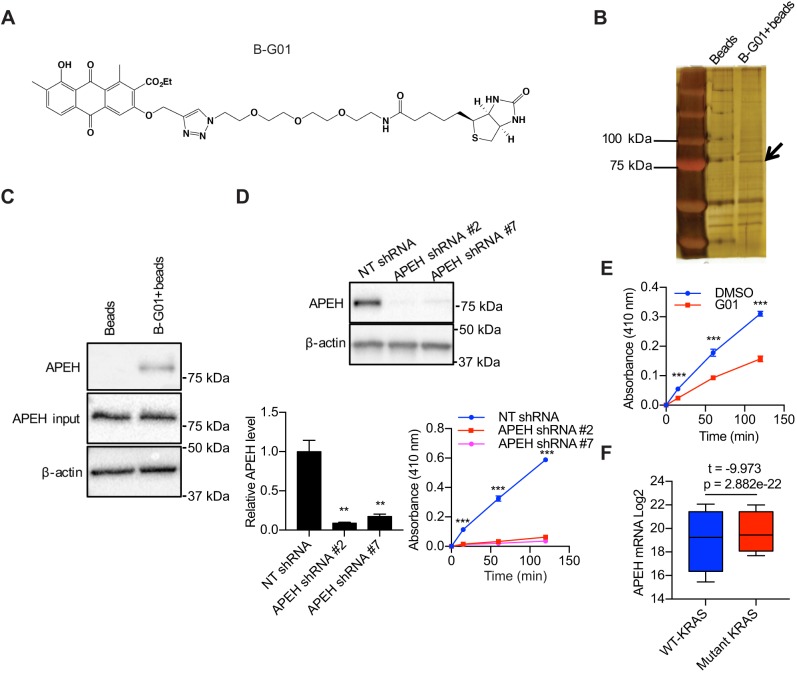
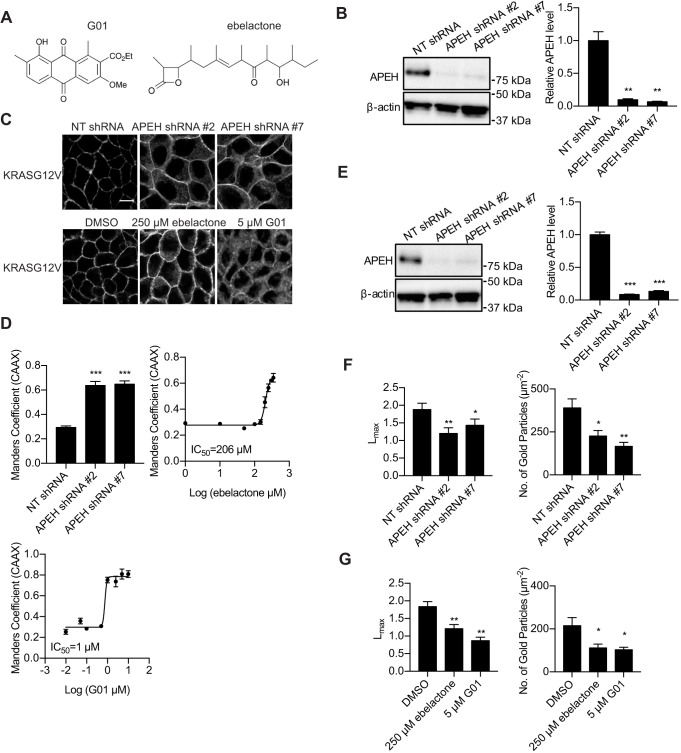
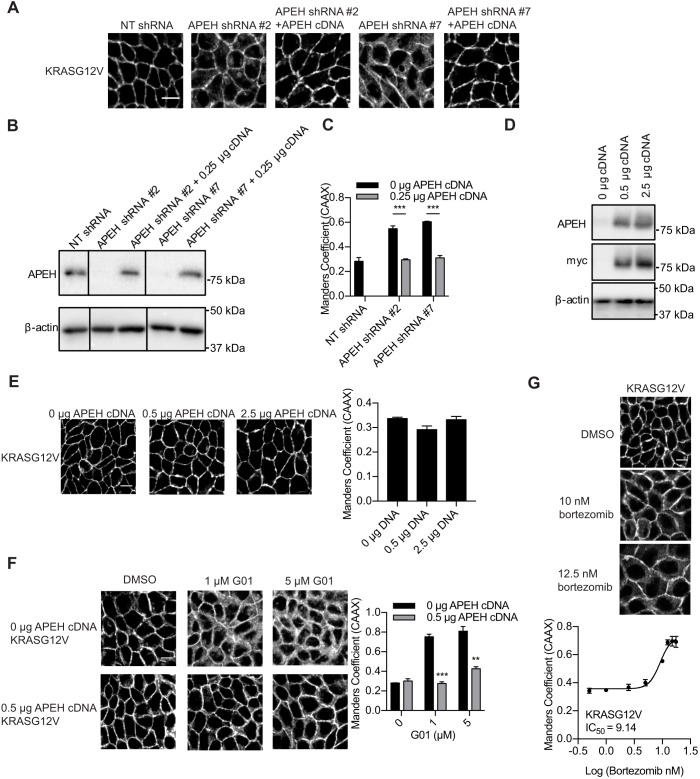
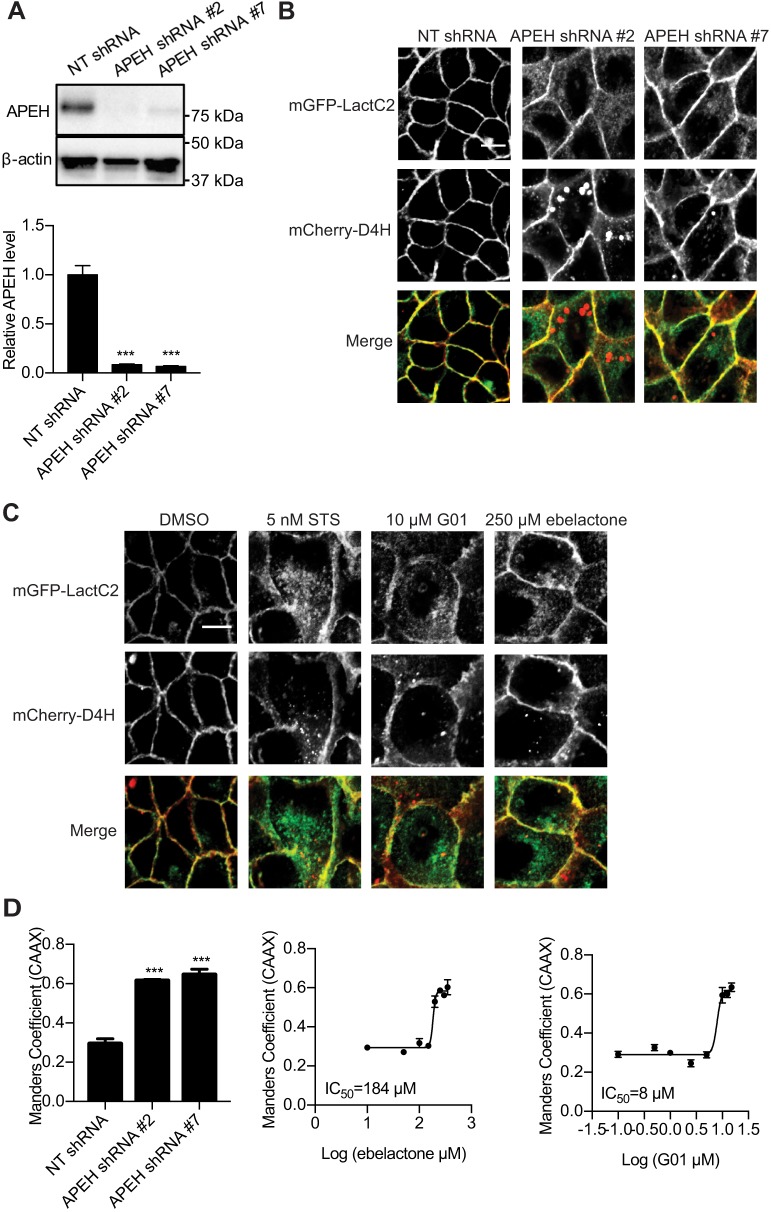
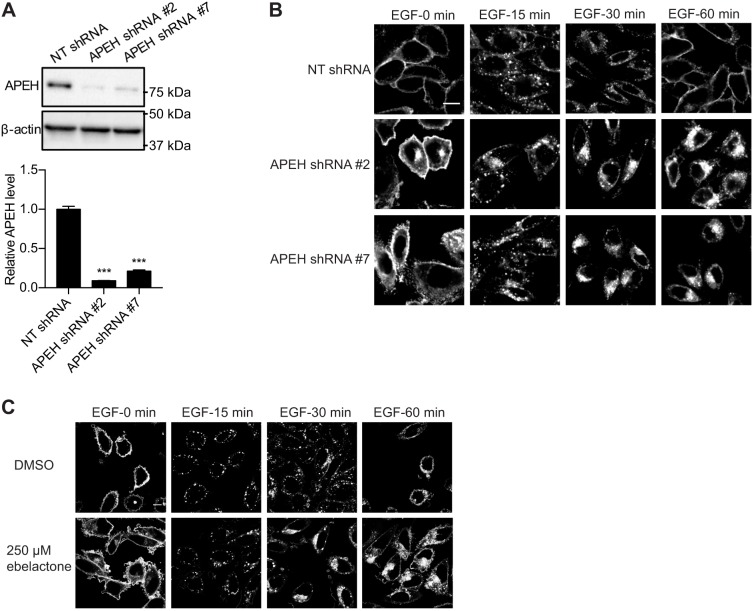
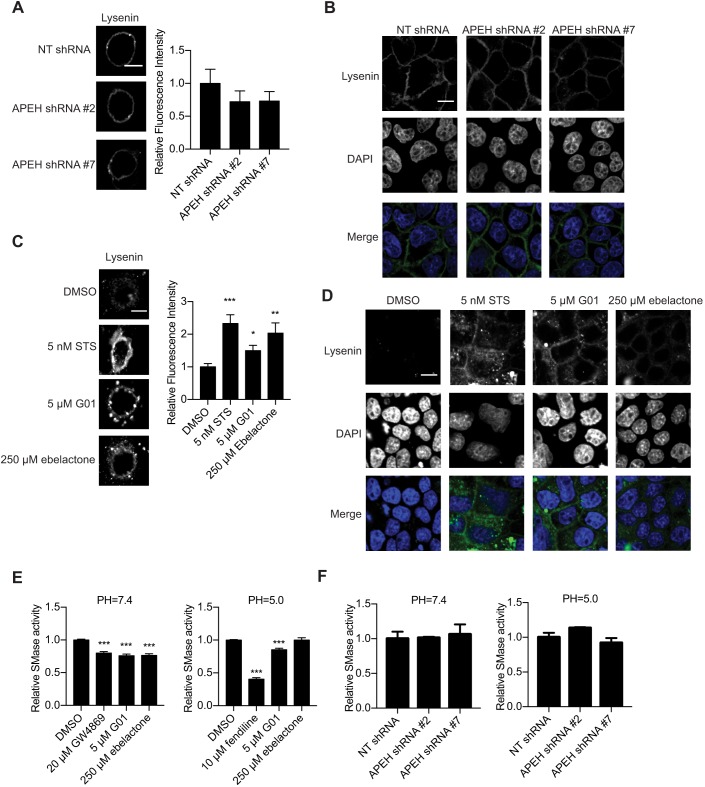
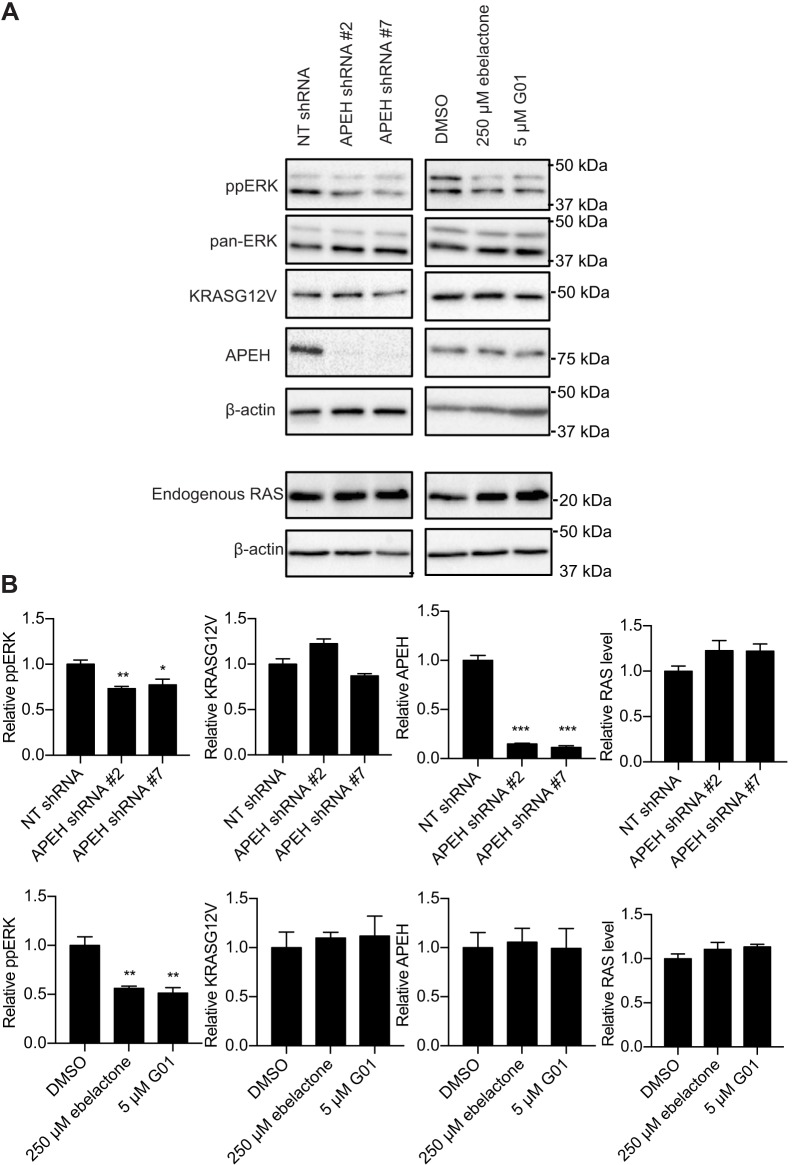
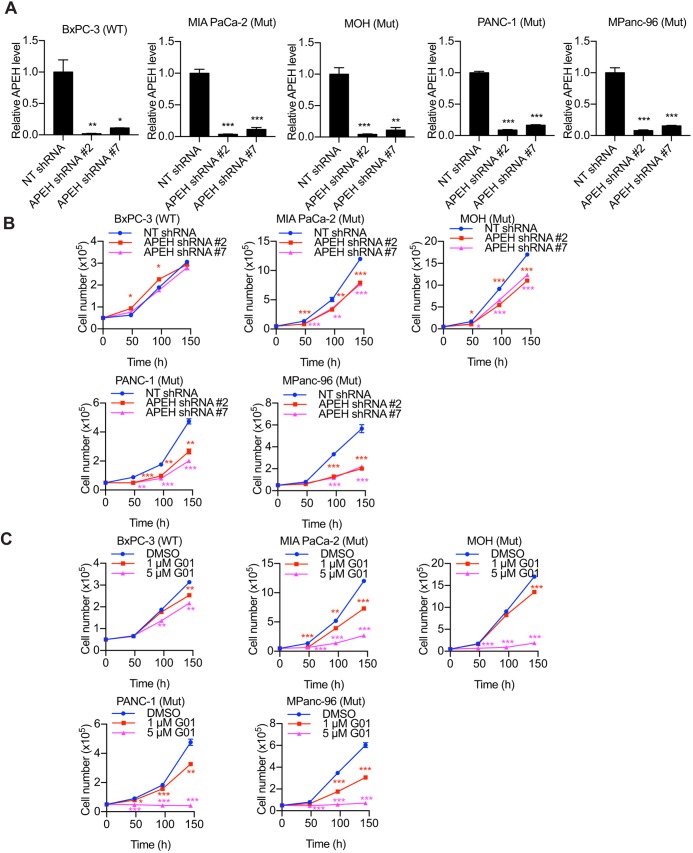
The primary site for KRAS signaling is the inner leaflet of the plasma membrane (PM). We previously reported that oxanthroquinone G01 (G01) inhibited KRAS PM localization and blocked KRAS signaling. In this study, we identified acylpeptide hydrolase (APEH) as a molecular target of G01. APEH formed a stable complex with biotinylated G01, and the enzymatic activity of APEH was inhibited by G01. APEH knockdown caused profound mislocalization of KRAS and reduced clustering of KRAS that remained PM localized. APEH knockdown also disrupted the PM localization of phosphatidylserine (PtdSer), a lipid critical for KRAS PM binding and clustering. The mislocalization of KRAS was fully rescued by ectopic expression of APEH in knockdown cells. APEH knockdown disrupted the endocytic recycling of epidermal growth factor receptor and transferrin receptor, suggesting that abrogation of recycling endosome function was mechanistically linked to the loss of KRAS and PtdSer from the PM. APEH knockdown abrogated RAS-RAF-MAPK signaling in cells expressing the constitutively active (oncogenic) mutant of KRAS (KRASG12V), and selectively inhibited the proliferation of KRAS-transformed pancreatic cancer cells. Taken together, these results identify APEH as a novel drug target for a potential anti-KRAS therapeutic.

Keywords: Acylpeptide hydrolase; KRAS; Oxanthroquinone; Plasma membrane; Recycling endosome; Sphingomyelin metabolism.


Conflict of interest statement

Competing interestsThe authors declare no competing or financial interests.

Figures

Fig. 1.
Fig. 1.
APEH is bound and inhibited by G01. (A) Structure of B-G01. (B) Beads collected from cell lysates incubated with or without B-G01 were analyzed by silver staining. The band that was analyzed by mass spectrometry is indicated (arrow). (C) Beads collected from 200 μg cell lysates incubated with or without B-G01 were immunoblotted for APEH. Controls including 20 μg whole-cell lysate (input) were immunoblotted for APEH and β-actin. Representative blots were shown. (D) Lysates of MDCK cells transfected with NT shRNA or APEH shRNAs were blotted for APEH. The level of APEH was normalized to the level of β-actin. Representative western blots are shown. **P<0.01 between APEH knockdown and control APEH levels (one-way ANOVA). Lysates were incubated with 1 mM ac-Ala-pNA for 2 h at 37°C. Absorbance at 410 nm was measured at intervals. ***P<0.001 (one-way ANOVA). Results are mean±s.e.m. (n=3). (E) MDCK cell lysates were incubated with vehicle (DMSO) or 50 μM G01 for 1 h at room temperature and 1 mM ac-Ala-pNA was added. Absorbance at 410 nm was measured following warming to 37°C. Results are mean±s.e.m. (n=3). ***P<0.001 between DMSO- and G01-treated background-subtracted absorbance (Student's t-tests). (F) Box plots indicating quartiles of APEH expression level in patient tissues (n=20,163) of 33 types of cancers with or without KRAS mutants were generated using the UCSC Xena Browser. Whiskers represent upper and lower quartiles. The statistical significance was analyzed with Welch's t-test.
Fig. 2.
Fig. 2.
APEH inhibition or knockdown inhibits KRASG12V PM localization and nanoclustering. (A) Structure of G01 and ebelactone. (B) MDCK cells stably expressing mGFP–KRASG12V and mCherry–CAAX transfected with NT shRNA or APEH shRNAs were lysed and blotted for APEH. The level of APEH was normalized to the level of β-actin. Representative western blots are shown. Results are mean±s.e.m. (n=3). **P<0.01 between APEH-knockdown and control APEH levels (one-way ANOVA). (C) Cells treated as in B together with MDCK cells stably expressing mGFP–KRASG12V and mCherry–CAAX and treated with ebelactone or G01 for 48 h were imaged in a confocal microscope. Representative images are shown. Scale bar: 10 μm. (D) Upper left, the extent of KRAS mislocalization was quantified by determining the Manders’ coefficients, which evaluate the extent of colocalization of mCherry–CAAX and mGFP–KRASG12V. Results are mean±s.e.m. (n=3). ***P<0.001 between APEH-knockdown and control Manders’ coefficients (one-way ANOVA). Upper right and bottom left, estimated IC50 values for ebelactone or G01 were obtained from the respective Manders’ coefficient (mean±s.e.m.; n=3) dose–response plots. (E) MDCK cells stably expressing mGFP–KRASG12V transfected with NT shRNA or APEH shRNAs were lysed and blotted for APEH. The level of APEH was normalized to the level of β-actin. Representative western blots are shown. Results are mean±s.e.m. (n=3). ***P<0.001 between APEH-knockdown and control APEH levels (one-way ANOVA). (F) Basal PM sheets were generated from cells from E and imaged by EM after incubation with anti-GFP antibody conjugated to 4.5 nm gold particles. Left, the extent of clustering was analyzed with Ripley's K-function expressed as L(r)−r functions, and normalized on the 99% confidence interval (c.i.). Lmax, which is the maximum value of L(r)−r, serves as the summary statistic. Values of Lmax above the c.i. indicate clustering, with the extent of clustering given by the value of Lmax (mean±s.e.m.; n≥12). *P<0.05; **P<0.01 comparing the pattern for control cells with that for APEH knockdown cells (bootstrap tests). Right, gold labeling density on the PM sheets is shown as mean±s.e.m. (n≥12). *P<0.05; **P<0.01 for the difference in gold labeling density (one-way ANOVA). (G) Lmax and gold labeling density calculated as in F of basal PM sheets generated from cells treated with vehicle (DMSO) or ebelactone or G01 for 48 h.
Fig. 3.
Fig. 3.
Expression of exogenous APEH rescues the KRASG12V mislocalization induced by APEH knockdown or G01 treatment. (A) Cells as in Fig. 2B were transfected with 0.25 μg APEH–Myc cDNA and imaged in a confocal microscope. Representative images are shown. (B) Parallel cultures of the cells as in A were analyzed by immunoblotting. Representative blots are shown. (C) The extent of KRAS mislocalization was quantified by determining the Manders’ coefficients. ***P<0.001 (Student's t-test). (D) MDCK cells stably expressing mGFP–KRASG12V and mCherry–CAAX were transfected with 0.5 or 2.5 μg APEH–Myc cDNA and lysed for immunoblotting. Representative blots are shown. (E) Parallel cultures of the cells as in D were imaged in a confocal microscope and representative images are shown. The extent of KRAS mislocalization was quantified by determining the Manders’ coefficients. There was no significant difference between APEH-overexpressing and control cells (one-way ANOVA). (F) Cells as in D were seeded on 12-well plates and treated with vehicle (DMSO) or G01 for 48 h. Representative images are shown. The extent of KRAS mislocalization was quantified by determining the Manders’ coefficients. **P<0.01; ***P<0.001 compared with cells without APEH overexpression (one-way ANOVA). (G) MDCK cells stably expressing mGFP–KRASG12V and mCherry–CAAX were treated with vehicle (DMSO) or bortezomib for 48 h. Cells were imaged in a confocal microscope. Representative images are shown. The extent of KRAS mislocalization was quantified determining the Manders’ coefficients. Estimated IC50 values were obtained from the respective Manders’ coefficients dose–response plots. All graphs show mean±s.e.m. (n=3). Scale bars: 10 μm.
Fig. 4.
Fig. 4.
PtdSer and cholesterol are mislocalized upon APEH knockdown or inhibition. (A) MDCK cells stably expressing mGFP–LactC2 and mCherry–D4H were transfected with NT shRNA or APEH shRNAs and lysed for quantitative immunoblotting. The level of APEH was normalized to the level of β-actin. Representative western blots are shown. Results are mean±s.e.m. (n=3). ***P<0.001 between APEH-knockdown and control cells (one-way ANOVA). (B) Parallel cultures of cells as in A were imaged in a confocal microscope. Representative images are shown. (C) MDCK cells stably expressing mGFP–LactC2 and mCherry–D4H were treated with vehicle (DMSO) or staurosporine (STS) or ebelactone or G01 for 48 h and imaged in a confocal microscope. Representative images are shown. (D) Left, MDCK cells stably expressing mGFP–LactC2 and mCherry–CAAX were transfected with NT shRNA or APEH shRNAs and imaged in a confocal microscope. The extent of LactC2 mislocalization was quantified by determining the Manders’ coefficients. ***P<0.001 (one-way ANOVA). Middle and right, MDCK cells stably expressing mGFP–LactC2 and mCherry–CAAX were treated with G01 or ebelactone for 48 h and imaged in a confocal microscope. The extent of LactC2 mislocalization was quantified by determining the Manders’ coefficients. Estimated IC50 values for ebelactone or G01 were obtained from the respective Manders’ coefficient dose–response plots. Results are mean±s.e.m. (n=3). Scale bars: 10 μm.
Fig. 5.
Fig. 5.
The endocytic recycling of EGFR is disrupted by APEH knockdown or inhibition. (A) CHO cells stably expressing mGFP–EGFR were transfected with NT shRNA or APEH shRNAs and lysed for quantitative immunoblotting. The level of APEH was normalized to the level of β-actin. Results are mean±s.e.m. (n=3). Representative western blots are shown. ***P<0.001 between APEH-knockdown and control APEH levels (one-way ANOVA). (B) Cells as in A were serum-starved for 2 h and incubated with 50 ng/ml EGF on ice for 20 min. Excess EGF was washed away and cells were incubated with fresh warm medium. Cells were fixed at different time points and imaged in a confocal microscope. Representative images are shown. (C) CHO cells stably expressing mGFP–EGFR were treated with vehicle (DMSO) or ebelactone. Cells were serum-starved for 2 h and incubated with 50 ng/ml EGF on ice for 20 min. Excess EGF was washed away and cells were incubated with fresh warm medium. Cells were fixed at different time points and imaged in a confocal microscope. Representative images are shown. Scale bars: 10 μm.
Fig. 6.
Fig. 6.
APEH knockdown does not alter cellular SM levels. (A) Cells as in Fig. 1D were stained with GFP–lysenin and imaged in a confocal microscope with fixed imaging parameters to compare fluorescence intensities. Representative images are shown. The GFP fluorescence intensity was quantified using ImageJ and normalized to the mean of those in NT shRNA group (set at one). Results are mean±s.e.m. (n≥12). There was no significant difference in the relative fluorescence intensity (one-way ANOVA). (B) Cells as in Fig. 1D were stained with GFP–lysenin and DAPI following by cell permeabilization. Cells were imaged in a confocal microscope with fixed imaging parameters for comparison of fluorescent intensities. Representative images are shown. (C) MDCK cells were treated with vehicle (DMSO), staurosporine (STS), ebelactone or G01 for 48 h, and imaged and analyzed as in A. *P<0.05; **P<0.01; ***P<0.001 compared with DMSO (one-way ANOVA). (D) MDCK cells were treated with vehicle (DMSO), STS, ebelactone or G01 for 48 h and permeabilized. Cells were stained with GFP–lysenin and DAPI and were imaged as in B. Representative images are shown. (E) MDCK cells were treated with vehicle (DMSO), GW4869, G01 or ebelactone for 48 h and lysed. Cell lysates were analyzed for neutral and acid SMase activity. ***P<0.001 (one-way ANOVA). (F) Cells as in Fig. 1D were lysed and analyzed for neutral and acid SMase activity. There was no significant difference between the control and knockdown cells (one-way ANOVA). Graphs in E and F show mean±s.e.m. (n=3). Scale bars: 10 μm.
Fig. 7.
Fig. 7.
MAPK signaling is reduced by APEH knockdown or inhibition. (A) MDCK cells expressing KRASG12V were treated with vehicle (DMSO) or ebelactone or G01 for 48 h. These cells, together with the cells as in Fig. 2E, were lysed for quantitative immunoblotting. Representative blots are shown. (B) Levels of ppERK were normalized to the total level of ERK. Levels of KRASG12V, APEH, and endogenous RAS were normalized to the total level of β-actin. Results are mean±s.e.m. (n=3). *P<0.05; **P<0.01; ***P<0.001 between drug-treated or shRNA-transfected and control protein levels (one-way ANOVA).
Fig. 8.
Fig. 8.
The proliferation of KRAS-dependent pancreatic cancer cells is inhibited by APEH knockdown or inhibition. BxPC-3, MiaPaCa-2, MOH, PANC-1 and MPanc-96 cells were transfected with NT shRNA or APEH shRNAs and lysed for quantitative immunoblotting. The level of APEH was normalized to the level of β-actin. *P<0.05; **P<0.01; ***P<0.001 between APEH-knockdown and control APEH cells (one-way ANOVA). (B) Cells as in A were grown in 12-well plates for 6 days. Cells were counted every 48 h. *P<0.05; **P<0.01; ***P<0.001 (one-way ANOVA). (C) BxPC-3, MiaPaCa-2, MOH, PANC-1 and MPanc-96 cells were treated with vehicle (DMSO) or daily doses of two concentrations of G01 in 12-well plates for 6 days. Cells were counted every 48 h. *P<0.05; **P<0.01; ***P<0.001 (one-way ANOVA). All graphs show mean±s.e.m. (n=3).

Similar articles

Cited by

References

    1. Aits S. and Jäättelä M. (2013). Lysosomal Cell Death at a Glance. J. Cell. Sci. 126, 1905-1912. 10.1242/jcs.091181 - DOI - PubMed
    1. Bergamo P., Palmieri G., Cocca E., Ferrandino I., Gogliettino M., Monaco A., Maurano F. and Rossi M. (2016). Adaptive response activated by dietary cis9, trans11 conjugated linoleic acid prevents distinct signs of gliadin-induced enteropathy in mice. Eur. J. Nutr. 55, 729-740. 10.1007/s00394-015-0893-2 - DOI - PubMed
    1. Berndtsson M., Beaujouin M., Rickardson L., Havelka A. M., Larsson R., Westman J., Liaudet-Coopman E. and Linder S. (2009). Induction of the lysosomal apoptosis pathway by inhibitors of the ubiquitin-proteasome system. Int. J. Cancer 124, 1463-1469. 10.1002/ijc.24004 - DOI - PubMed
    1. Cho K.-J., Park J.-H., Piggott A. M., Salim A. A., Gorfe A. A., Parton R. G., Capon R. J., Lacey E. and Hancock J. F. (2012). Staurosporines disrupt phosphatidylserine trafficking and mislocalize Ras proteins. J. Biol. Chem. 287, 43573-43584. 10.1074/jbc.M112.424457 - DOI - PMC - PubMed
    1. Cho K.-J., van der Hoeven D., Zhou Y., Maekawa M., Ma X., Chen W., Fairn G. D. and Hancock J. F. (2016). Inhibition of acid sphingomyelinase depletes cellular phosphatidylserine and mislocalizes K-Ras from the plasma membrane. Mol. Cell. Biol. 36, 363-374. 10.1128/MCB.00719-15 - DOI - PMC - PubMed

Publication types