

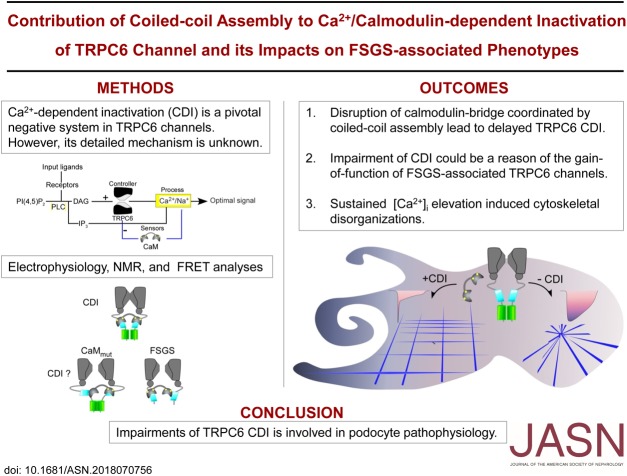
Contribution of Coiled-Coil Assembly to Ca2+/Calmodulin-Dependent Inactivation of TRPC6 Channel and its Impacts on FSGS-Associated Phenotypes
- PMID: 31266820
- PMCID: PMC6727271
- DOI: 10.1681/ASN.2018070756
Contribution of Coiled-Coil Assembly to Ca2+/Calmodulin-Dependent Inactivation of TRPC6 Channel and its Impacts on FSGS-Associated Phenotypes
Abstract
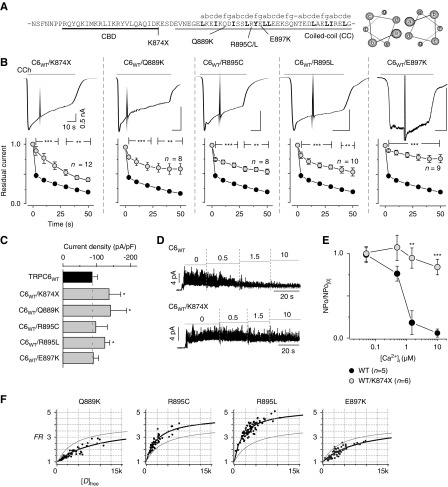
Background: TRPC6 is a nonselective cation channel, and mutations of this gene are associated with FSGS. These mutations are associated with TRPC6 current amplitude amplification and/or delay of the channel inactivation (gain-of-function phenotype). However, the mechanism of the gain-of-function in TRPC6 activity has not yet been clearly solved.
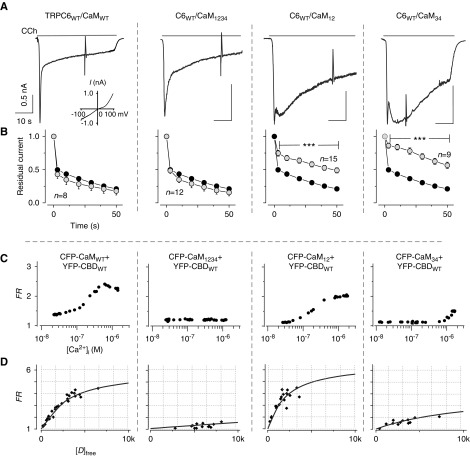
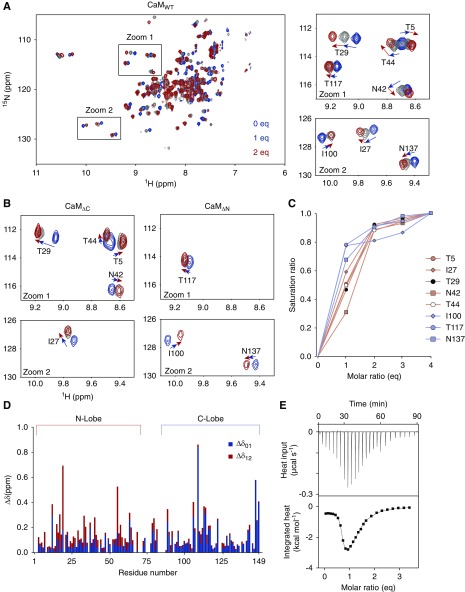
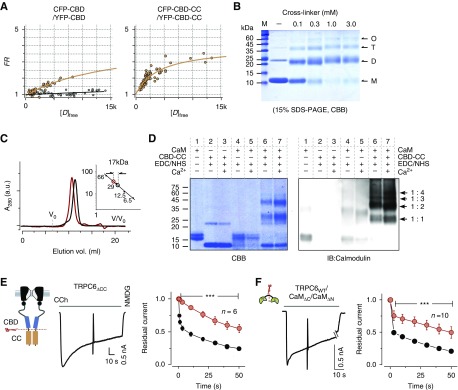
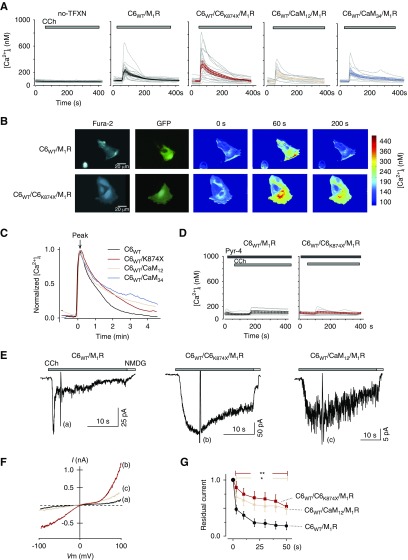
Methods: We performed electrophysiologic, biochemical, and biophysical experiments to elucidate the molecular mechanism underlying calmodulin (CaM)-mediated Ca2+-dependent inactivation (CDI) of TRPC6. To address the pathophysiologic contribution of CDI, we assessed the actin filament organization in cultured mouse podocytes.
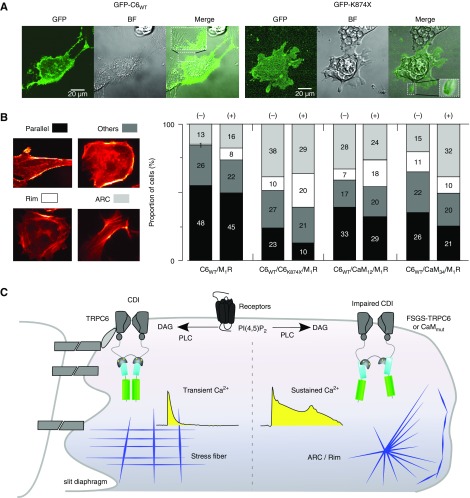
Results: Both lobes of CaM helped induce CDI. Moreover, CaM binding to the TRPC6 CaM-binding domain (CBD) was Ca2+-dependent and exhibited a 1:2 (CaM/CBD) stoichiometry. The TRPC6 coiled-coil assembly, which brought two CBDs into adequate proximity, was essential for CDI. Deletion of the coiled-coil slowed CDI of TRPC6, indicating that the coiled-coil assembly configures both lobes of CaM binding on two CBDs to induce normal CDI. The FSGS-associated TRPC6 mutations within the coiled-coil severely delayed CDI and often increased TRPC6 current amplitudes. In cultured mouse podocytes, FSGS-associated channels and CaM mutations led to sustained Ca2+ elevations and a disorganized cytoskeleton.
Conclusions: The gain-of-function mechanism found in FSGS-causing mutations in TRPC6 can be explained by impairments of the CDI, caused by disruptions of TRPC's coiled-coil assembly which is essential for CaM binding. The resulting excess Ca2+ may contribute to structural damage in the podocytes.
Keywords: Calcium signal; TRPC channel; chronic kidney disease; electrophysiology; focal segmental glomerulosclerosis; podocyte.
Copyright © 2019 by the American Society of Nephrology.
Figures
References
-
- Berridge MJ: Calcium signalling remodelling and disease. Biochem Soc Trans 40: 297–309, 2012 - PubMed
-
- Winn MP, Conlon PJ, Lynn KL, Farrington MK, Creazzo T, Hawkins AF, et al. .: A mutation in the TRPC6 cation channel causes familial focal segmental glomerulosclerosis. Science 308: 1801–1804, 2005 - PubMed
-
- Clapham DE: TRP channels as cellular sensors. Nature 426: 517–524, 2003 - PubMed
Publication types
MeSH terms
Substances
LinkOut - more resources
Full Text Sources
Miscellaneous
