. 2019 Jul 2;10(4):e00957-19.
doi: 10.1128/mBio.00957-19.

mRNA Degradation Rates Are Coupled to Metabolic Status in Mycobacterium smegmatis

Affiliations

mRNA Degradation Rates Are Coupled to Metabolic Status in Mycobacterium smegmatis

Diego A Vargas-Blanco et al. mBio. .

Abstract

The success of Mycobacterium tuberculosis as a human pathogen is due in part to its ability to survive stress conditions, such as hypoxia or nutrient deprivation, by entering nongrowing states. In these low-metabolism states, M. tuberculosis can tolerate antibiotics and develop genetically encoded antibiotic resistance, making its metabolic adaptation to stress crucial for survival. Numerous bacteria, including M. tuberculosis, have been shown to reduce their rates of mRNA degradation under growth limitation and stress. While the existence of this response appears to be conserved across species, the underlying bacterial mRNA stabilization mechanisms remain unknown. To better understand the biology of nongrowing mycobacteria, we sought to identify the mechanistic basis of mRNA stabilization in the nonpathogenic model Mycobacterium smegmatis We found that mRNA half-life was responsive to energy stress, with carbon starvation and hypoxia causing global mRNA stabilization. This global stabilization was rapidly reversed when hypoxia-adapted cultures were reexposed to oxygen, even in the absence of new transcription. The stringent response and RNase levels did not explain mRNA stabilization, nor did transcript abundance. This led us to hypothesize that metabolic changes during growth cessation impact the activities of degradation proteins, increasing mRNA stability. Indeed, bedaquiline and isoniazid, two drugs with opposing effects on cellular energy status, had opposite effects on mRNA half-lives in growth-arrested cells. Taken together, our results indicate that mRNA stability in mycobacteria is not directly regulated by growth status but rather is dependent on the status of energy metabolism.IMPORTANCE The logistics of tuberculosis therapy are difficult, requiring multiple drugs for many months. Mycobacterium tuberculosis survives in part by entering nongrowing states in which it is metabolically less active and thus less susceptible to antibiotics. Basic knowledge on how M. tuberculosis survives during these low-metabolism states is incomplete, and we hypothesize that optimized energy resource management is important. Here, we report that slowed mRNA turnover is a common feature of mycobacteria under energy stress but is not dependent on the mechanisms that have generally been postulated in the literature. Finally, we found that mRNA stability and growth status can be decoupled by a drug that causes growth arrest but increases metabolic activity, indicating that mRNA stability responds to metabolic status rather than to growth rate per se Our findings suggest a need to reorient studies of global mRNA stabilization to identify novel mechanisms that are presumably responsible.

Keywords: ATP; Mycobacterium smegmatis; Mycobacterium tuberculosis; carbon starvation; hypoxia; mRNA degradation; mRNA stability; stress response; tuberculosis.


Figures

FIG 1
FIG 1
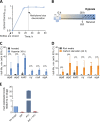
Transcript half-lives are increased in response to hypoxia and carbon starvation stress. (A) Growth kinetics for M. smegmatis under hypoxia using a variation of the Wayne and Hayes model (55), showing OD stabilization at 18 to 24 h. Oxygen depletion was assessed qualitatively by methylene blue discoloration. (B) M. smegmatis was sealed in vials to produce a hypoxic environment, and at 18 h, transcription was inhibited with RIF and samples were collected thereafter. Transcript half-lives for the indicated genes were measured for M. smegmatis mc2155 after blocking transcription with 150 μg/ml RIF. (C and D) RNA samples were collected during log-phase normoxia and hypoxia (18 h after closing the bottles) (C) or during log phase in 7H9 supplemented with ADC, glycerol, and Tween 80 (rich medium) or 7H9 with Tyloxapol only (carbon starvation, 24 h) (D). mRNA degradation rates were compared using linear regression (n = 3), and half-lives were determined by the negative reciprocal of the best-fit slope. Error bars are 95% confidence intervals (CI). ***, P < 0.001; ****, P < 0.0001. When a slope of zero was included in the 95% CI (indicating no degradation), the upper limit for half-life was unbounded, indicated by a clipped error bar with a double line. (E) RIF blocks overexpression of an ATc-inducible gene (rraA) in hypoxic cultures. Forty hours after the bottles were sealed, cultures were treated with 50 ng/ml ATc and/or 150 μg/ml RIF or the drug vehicle (DMSO) for 1 h. Expression levels (qPCR) are displayed relative to those with no drugs (DMSO treatment). ATc, RIF, and DMSO solutions were degassed prior to addition. Error bars are standard deviations (SD).
FIG 2
FIG 2
Transcript stabilization in hypoxia and carbon starvation are not dependent on the stringent response. (A) Growth kinetics for M. smegmatis mc2155 (wild type [WT]) and Δrel Δsas2 strains cultured in 7H9 in flasks sealed at time zero. (B) Transcript half-lives for a set of genes 24 h after sealing of the hypoxia bottles (arrow in panel A). RNA samples were collected after transcription was blocked with 150 μg/ml RIF (degassed). (C) Bacteria were grown to log phase in 7H9 supplemented with ADC, glycerol, and Tween 80 and then transferred to 7H9 supplemented with only Tyloxapol at time zero. (D) Transcript stability for a set of genes 22 h after transfer to carbon starvation medium (arrow in panel C). (A and C) The means and SD of triplicate cultures are shown. (B and D) Half-lives were compared using linear regression analysis (n =3). Error bars are 95% CI. ****, P < 0.0001; ns, not significant (P > 0.05). In cases where no degradation was observed or when the upper 95% CI limit was unbounded, the bar or upper error bar were clipped, respectively.
FIG 3
FIG 3
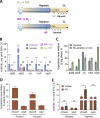
Hypoxia-induced mRNA stability is reversible and independent of mRNA abundance. (A) M. smegmatis was sealed in vials for 18 h to produce a hypoxic environment and then reexposed to oxygen for 2 min before transcription was inhibited with RIF (top) or injected with RIF 1 min prior to opening of the vials and reexposing them to oxygen (bottom). (B) Transcript half-lives for a set of genes are displayed for log-phase normoxia cultures, hypoxia (18 h), and reaeration with RIF added either before or after opening of the vials. Half-lives were compared by linear regression analysis (n =3). (C) Expression levels of transcripts under hypoxia (18 h) or with a 2-min reaeration relative to the expression levels in log-phase normoxia cultures (percentages). Error bars are SD. (D) Expression levels of transcripts under hypoxia (18 h) or log-phase normoxia after being treated with 200 ng/ml ATc for 1 h or 10 min, respectively, to induce dCas9 overexpression, relative to the expression levels in cultures treated with an H2O vehicle (percentages). Error bars are SD. (E) Transcript half-lives for dCas9 and sigA for log-phase normoxia and hypoxia (18 h) after induction of dCas9 with ATc or after vehicle treatment as shown in panel D. (B and E) Degradation rates were compared using linear regression (n = 3), and half-lives were determined by the negative reciprocal of the best-fit slope. Error bars are 95% CI. *, P < 0.05; **, P < 0.01; ****, P < 0.0001; ns, P > 0.05. RIF added to hypoxic cultures was degassed prior to its addition.
FIG 4
FIG 4
mRNA stability is regulated independently of degradation protein levels. (A) Western blotting for FLAG-tagged RNase E and cMyc-tagged PNPase or RNA helicase (msmeg_1930) in M. smegmatis under log-phase normoxia and hypoxia (18 h) and with a 2-min reaeration. Samples were normalized to the total protein level, and levels were similar on a per-OD basis under all conditions. (B) Translation was inhibited in hypoxic cultures by 150 μg/ml CAM 1 min before the addition of 150 μg/ml RIF. RNA was harvested at time points beginning 2 min after the addition of CAM. (C) Transcript half-lives for samples from hypoxic cultures with the drug vehicle (ethanol), for hypoxic cultures after translation inhibition, and for cultures with 2 min of reaeration after translation inhibition. Degradation rates were compared using linear regression (n = 3), and half-lives were determined by the negative reciprocal of the best-fit slope. Error bars are 95% CI. ns, P > 0.05; *, P < 0.05; ***, P < 0.001; ****, P < 0.0001. Drugs and drug vehicles added to the hypoxic cultures were degassed prior to their addition.
FIG 5
FIG 5
mRNA stability is modulated in response to changes in metabolic status. (A) M. smegmatis was cultured in MMA media for 22 h to OD600 0.8 before being treated with 5 μg/ml BDQ or the vehicle (DMSO) for 30 min. Intracellular ATP was determined using the BacTiter-Glo kit. (B) Growth kinetics for M. smegmatis from panel A in the presence of BDQ. (C) Transcript half-lives for a subset of transcripts collected during intracellular ATP depletion (30 min with BDQ) or at the basal levels (30 min with DMSO). (D) As in panel A, but for M. smegmatis treated with 500 μg/ml INH or the vehicle (H2O) for 6.5 h. (E) Growth kinetics for M. smegmatis from panel D in the presence of INH. (F) Transcript half-lives for a subset of transcripts after 6.5 h of INH or vehicle treatment. (G) Growth kinetics for M. smegmatis transitioning into hypoxia, and intracellular ATP levels at different stages. Bottles were sealed at time zero. The dotted line represents the time at which transcript stability analyses were made for the hypoxia (18 h) condition for Fig. 1, 3, and 4. In C and F, half-lives were compared using linear regression analysis (n =3). Error bars are 95% CI. *, P < 0.05; **, P < 0.01; ***, P < 0.001; ****, P < 0.0001. ATP was measured in biological triplicate cultures and is representative of at least two independent experiments.

References

    1. Via LE, Lin PL, Ray SM, Carrillo J, Allen SS, Eum SY, Taylor K, Klein E, Manjunatha U, Gonzales J, Lee EG, Park SK, Raleigh JA, Cho SN, McMurray DN, Flynn JL, Barry CE III.. 2008. Tuberculous granulomas are hypoxic in guinea pigs, rabbits, and nonhuman primates. Infect Immun 76:2333–2340. doi:10.1128/IAI.01515-07. - DOI - PMC - PubMed
    1. Belton M, Brilha S, Manavaki R, Mauri F, Nijran K, Hong YT, Patel NH, Dembek M, Tezera L, Green J, Moores R, Aigbirhio F, Al-Nahhas A, Fryer TD, Elkington PT, Friedland JS. 2016. Hypoxia and tissue destruction in pulmonary TB. Thorax 71:1145–1153. doi:10.1136/thoraxjnl-2015-207402. - DOI - PMC - PubMed
    1. Rustad TR, Minch KJ, Brabant W, Winkler JK, Reiss DJ, Baliga NS, Sherman DR. 2013. Global analysis of mRNA stability in Mycobacterium tuberculosis. Nucleic Acids Res 41:509–517. doi:10.1093/nar/gks1019. - DOI - PMC - PubMed
    1. Albertson MH, Nyström T, Kjelleberg S. 1990. Functional mRNA half-lives in the marine Vibrio sp. S14 during starvation and recovery. Microbiology 136:2195–2199. doi:10.1099/00221287-136-11-2195. - DOI
    1. Georgellis D, Barlow T, Arvidson S, von Gabain A. 1993. Retarded RNA turnover in Escherichia coli: a means of maintaining gene expression during anaerobiosis. Mol Microbiol 9:375–381. doi:10.1111/j.1365-2958.1993.tb01698.x. - DOI - PubMed

Publication types

LinkOut - more resources