. 2019 Jul 2;10(4):e01750-18.
doi: 10.1128/mBio.01750-18.

Resistance to the Tat Inhibitor Didehydro-Cortistatin A Is Mediated by Heightened Basal HIV-1 Transcription

Affiliations

Resistance to the Tat Inhibitor Didehydro-Cortistatin A Is Mediated by Heightened Basal HIV-1 Transcription

Guillaume Mousseau et al. mBio. .

Abstract

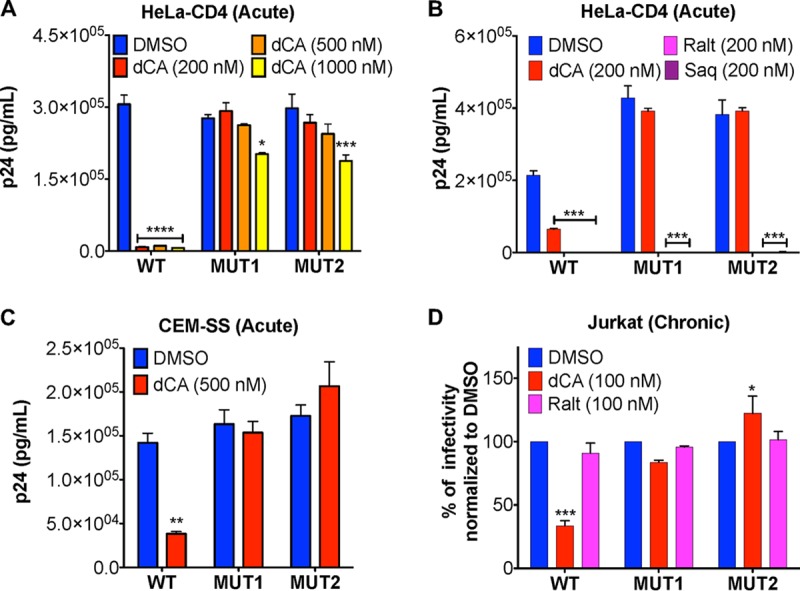
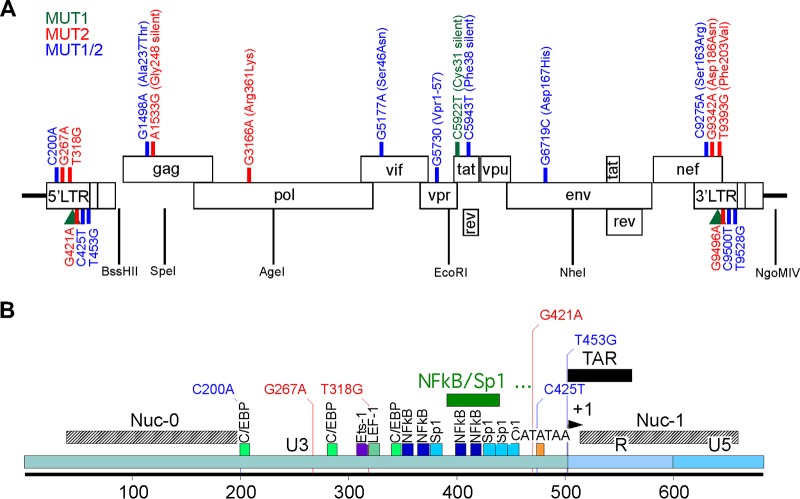
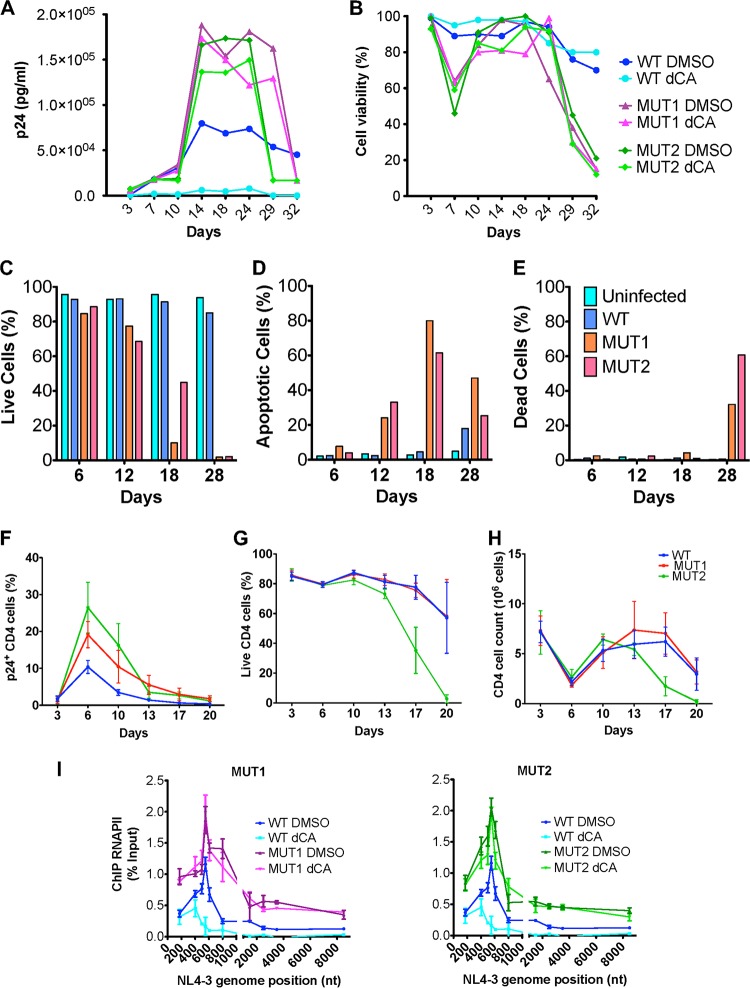
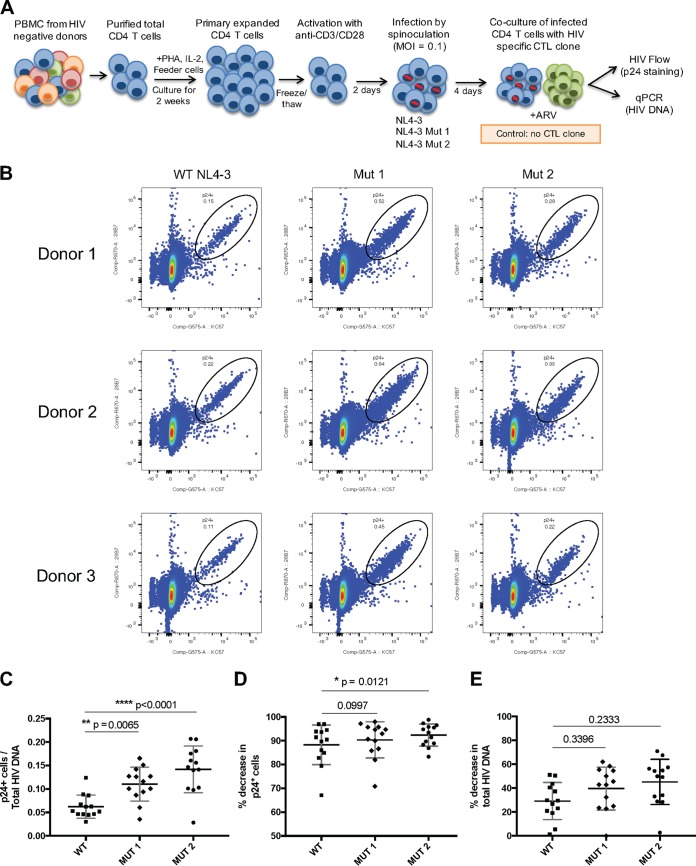
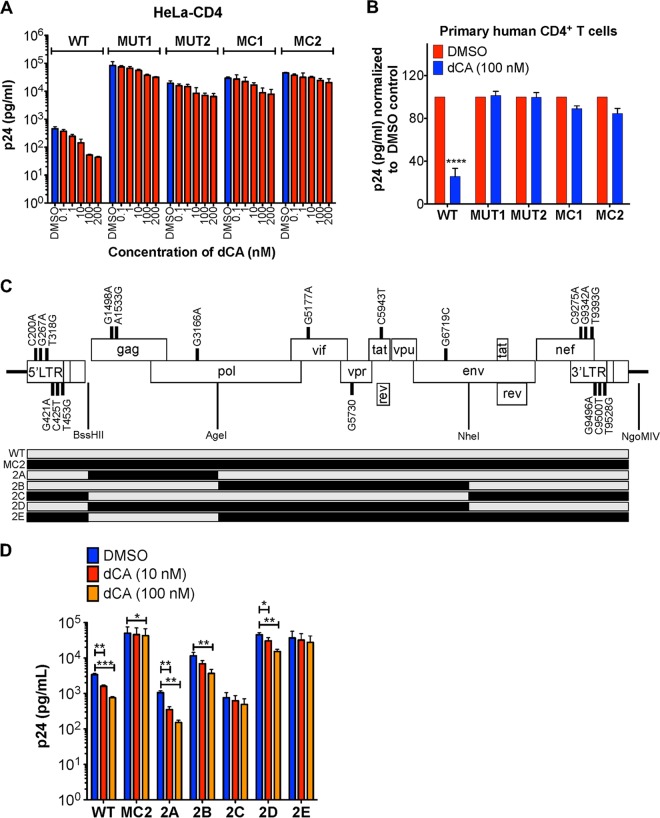
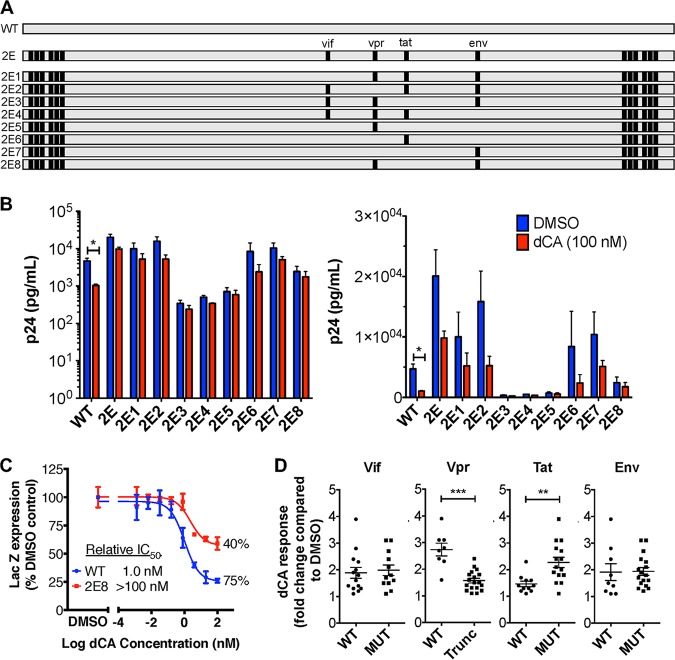
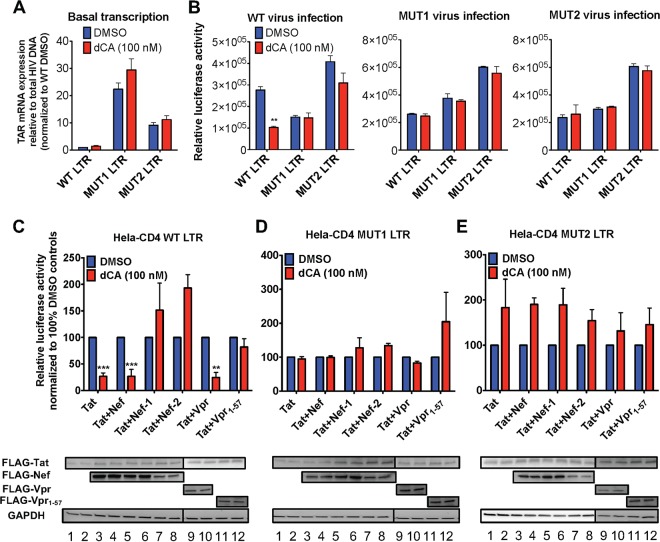
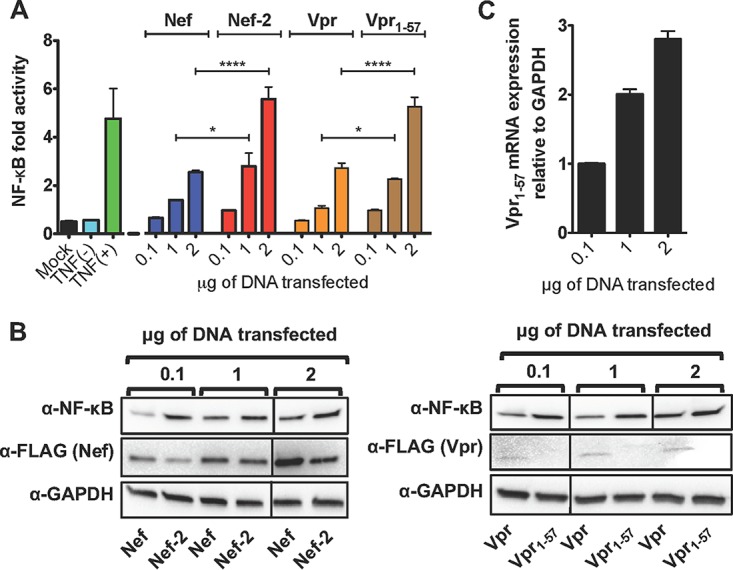
Human immunodeficiency virus type 1 (HIV-1) Tat binds the viral RNA structure transactivation-responsive element (TAR) and recruits transcriptional cofactors, amplifying viral mRNA expression. The Tat inhibitor didehydro-cortistatin A (dCA) promotes a state of persistent latency, refractory to viral reactivation. Here we investigated mechanisms of HIV-1 resistance to dCA in vitro Mutations in Tat and TAR were not identified, consistent with the high level of conservation of these elements. Instead, viruses resistant to dCA developed higher Tat-independent basal transcription. We identified a combination of mutations in the HIV-1 promoter that increased basal transcriptional activity and modifications in viral Nef and Vpr proteins that increased NF-κB activity. Importantly, these variants are unlikely to enter latency due to accrued transcriptional fitness and loss of sensitivity to Tat feedback loop regulation. Furthermore, cells infected with these variants become more susceptible to cytopathic effects and immune-mediated clearance. This is the first report of viral escape to a Tat inhibitor resulting in heightened Tat-independent activity, all while maintaining wild-type Tat and TAR.IMPORTANCE HIV-1 Tat enhances viral RNA transcription by binding to TAR and recruiting activating factors. Tat enhances its own transcription via a positive-feedback loop. Didehydro-cortistatin A (dCA) is a potent Tat inhibitor, reducing HIV-1 transcription and preventing viral rebound. dCA activity demonstrates the potential of the "block-and-lock" functional cure approaches. We investigated the viral genetic barrier to dCA resistance in vitro While mutations in Tat and TAR were not identified, mutations in the promoter and in the Nef and Vpr proteins promoted high Tat-independent activity. Promoter mutations increased the basal transcription, while Nef and Vpr mutations increased NF-κB nuclear translocation. This heightened transcriptional activity renders CD4+ T cells infected with these viruses more susceptible to cytotoxic T cell-mediated killing and to cell death by cytopathic effects. Results provide insights on drug resistance to a novel class of antiretrovirals and reveal novel aspects of viral transcriptional regulation.

Keywords: HIV promoter; HIV transcription; Nef; Tat inhibitor; Vpr; drug resistance; viral resistance.


Figures

FIG 1
FIG 1
HIV-1 isolates MUT1 and MUT2 are resistant to the Tat inhibitor dCA. (A) Inhibition of WT NL4-3 but not of the natural isolates MUT1 and MUT2 by increasing concentrations of dCA. HeLa-CD4 cells were infected with viruses, washed, and treated with the indicated concentrations of dCA or DMSO control. Supernatants collected 48 h later to quantify p24 capsid by ELISA (n = 3). (B) The dCA-resistant natural isolates MUT1 and MUT2 remain sensitive to integrase and protease inhibitors. Supernatants were collected 96 h later to quantify p24 capsid by ELISA (n = 3). (C) Viral resistance to dCA is cell type independent. CEM-SS cells were infected with the indicated viruses and then handled as described above for panel A. Supernatants harvested 72 h later were subjected to p24 ELISA (n = 3). (D) Chronically infected Jurkat cells were treated with the indicated compounds for 4 days before the levels of p24 in the supernatants were assessed by ELISA (n = 4). Data are normalized to the values for 100% DMSO control for each virus. All data are presented as means plus standard errors of the means (SEM). The two-way ANOVA followed by a Bonferroni posttest were used for statistical comparisons. Values that are significantly different are indicated by asterisks as follows: *, P < 0.05; **, P < 0.01; ***, P < 0.001; ****, P < 0.0001. Abbreviations: WT, wild type; MUT, mutant (dCA-resistant natural isolate); Ralt, raltegravir; Saq, saquinavir.
FIG 2
FIG 2
Schematic representation showing the positions of the mutated nucleotides in MUT1 and MUT2 dCA-resistant HIV-1 isolates. (A) NL4-3 genome with the indicated mutations found after deep sequencing, representing 50% or higher frequency of nucleotide changes. Green, red, and blue lines indicate the positions of mutations in MUT1, MUT2 and both MUT1/MUT2, respectively. The green triangle is a two NF-κB/one Sp1 insertion detected in MUT1. Amino acid changes are also indicated where applicable. The restriction sites used for cloning are indicated. (B) Close-up of the NL4-3 5′ LTR, using the same color code as in panel A.
FIG 3
FIG 3
Cells infected with dCA-resistant viruses have high replication rates and eventually undergo cytopathic cell death. (A and B) HeLa-CD4 cells were infected with WT or dCA-resistant MUT1 and MUT2 viruses for 8 h. Cells were then treated with DMSO or 100 nM dCA. (A) Viral capsid quantified by p24 ELISA and (B) viability of infected HeLa-CD4 cells monitored using trypan blue cell staining. The results shown are representative of three independent experiments. (C to E) Analysis by flow cytometry of the cell viability of acutely infected HeLa-CD4 cells. HeLa-CD4 cells uninfected and infected with WT, MUT1 and MUT2 viruses were stained with annexin V and Zombie Red. Zombie Red-negative annexin V-negative cells represent viable cells. Flow cytometry analysis was performed over time. Data are representative of three independent experiments. (F to H) Primary CD4+ T cells from three independent donors were infected with WT or dCA-resistant MUT1 and MUT2 viruses. At different times postinfection, cells were stained and analyzed by flow cytometry. (F) Frequency of CD4+ T cells expressing p24; (G) frequency of Live/Dead-negative CD4+ T cells assessed by flow cytometry; and (H) absolute number of CD4+ T cells in culture assessed by cell counting with trypan blue staining. Genome positions are shown in nucleotides (nt). (I) RNAPII recruitment to dCA-resistant virus isolates assessed by ChIP. HeLa-CD4 cells were infected with WT, MUT1 or MUT2 viruses in the presence of DMSO or 100 nM dCA, and 9 days postinfection, the cells were cross-linked and ChIP to RNAPII was performed. The promoter of RPL13A was used as a reference (see Fig. S3 in the supplemental material). The results are presented as percent immunoprecipitated DNA over input. All data are presented as means ± SEM (n = 3).
FIG 4
FIG 4
Primary CD4+ T cells infected with dCA-resistant viruses express more HIV antigens and are more susceptible to CTL-mediated killing. (A) Experimental design of the CTL killing assay in which target cells are isolated from CD4+ T cells purified out of PBMCs from HIV-negative donors and expanded in culture for 2 weeks, followed by activation with anti-CD3 and anti-CD28 antibodies and in vitro infection by spinoculation with wild type NL4-3 virus or dCA-resistant viruses. The viruses are allowed to grow in the CD4+ T cell culture for 4 days, and the killing assay is performed by coculturing these cells with HIV-specific CD8+ T cell clone in the presence of ARVs. The killing efficiency is calculated by the percent decrease in p24-expressing cells (assessed by flow cytometry) or HIV DNA (assessed by RT-qPCR) after the coculture compared to a control incubated without CTL clone. PHA, phytohemagglutinin; MOI, multiplicity of infection. (B) Representative plots of p24-expressing cells after 3 days of in vitro infection with wild-type NL4-3 virus and dCA-resistant viruses in primary human CD4+ T cells from three different donors. (C) Ratio between frequency of p24-expressing cells and total HIV DNA is significantly higher in cells infected with dCA-resistant viruses than in cells infected with wild-type NL4-3 virus. (D) CTL killing results showing percent decrease in frequency of CD4+ T cells expressing p24 after coculture with HIV-specific CTL clone. (E) CTL killing results showing percent decrease in total HIV DNA from CD4+ T cells after coculture with HIV-specific CTL clone. Data in panels C to E are presented as means ± SEM (n = 13). Paired ANOVA (Friedman’s test) was used for statistical comparison.
FIG 5
FIG 5
Molecular clones mimic the dCA resistance of natural isolates. (A) HeLa-CD4 were infected with WT, MUT1, or MUT2 virus or with the molecular clones (MCs) of dCA-resistant viruses (MC1 or MC2). Cells were than washed and treated with the indicated concentrations of dCA or DMSO. Capsid p24 was measured 48 h posttreatment using p24 ELISA (n = 2). (B) MCs and viral isolates are resistant to dCA in primary human CD4+ T cells isolated from three donors. CD4+ T cells were infected and treated with DMSO or 100 nM dCA. Capsid p24 was measured by ELISA 6 days after treatment. Data are normalized to the values for 100% DMSO control for each virus. See Fig. S4 for raw data (n = 3). (C) MC2 chimeras and resistance to dCA. Schematics of recombinant MC2 chimeras. (Top) Molecular chimeras were made based on MC2, and mutations and restriction enzyme sites are indicated. (Bottom) Schematic of the recombinant chimeras 2A to 2E made from MC2. The gray and black segments indicate the sequences from WT and MC2, respectively. (D) Susceptibility to dCA of the constructed chimeras. Chimeras 2C and 2E with mutations in Nef/LTR (as well as Vif, Vpr, Tat, and Env for 2E) are highly resistant to dCA. HeLa-CD4 cells were infected with the indicated viruses before adding dCA. Viral capsid production in the supernatant was measured 48 h later by p24 ELISA. All data are presented as means plus SEM. One-way ANOVA followed by a Bonferroni post-test were used for statistical comparisons in panel D. Statistical significance: *, P < 0.05; **, P < 0.01; ***, P < 0.001.
FIG 6
FIG 6
Characterization of the roles of Vif, Vpr, Tat and Env mutations in dCA resistance. (A) Schematics of site-specific sequence reversions from the dCA-resistant chimera 2E to that of the WT NL4-3 sequence. Nucleotide mutations in Vif, Vpr, Tat and Env were reverted individually to the WT sequence (2E1 to 2E4) or in combination (2E5 to 2E8). Gray squares show WT sequence; black squares show 2E mutations. (B) The molecular chimeras 2E5 and 2E8 with the Vpr truncation and six mutations in the Nef/LTR region confer the most resistance to dCA (n = 3, except for 2E7 [n = 2]). The experiment was performed as described in the legend to Fig. 5A. Logarithmic (left panel) and linear (right panel) representations of the data are shown. (C) CPRG assay of WT and 2E8 viruses with increasing concentrations of dCA. Relative IC50 is represented as well as the maximum inhibition upon dCA treatment. (D) Chimeras expressing a truncated Vpr are more resistant to dCA. Chimeras (2E to 2E8) were separated into groups containing either the WT or MUT protein for each viral protein. Each data point corresponds to the independent repeats from panel B. All data are presented as means ± SEM. The two-tailed paired t test and two-tailed Mann Whitney were used for statistical comparisons for panels B and D, respectively. Statistical significance: *, P < 0.05; **, P < 0.01; ***, P < 0.001. Trunc, truncated.
FIG 7
FIG 7
The LTRs of resistant viruses have enhanced transcriptional activity and largely contribute to dCA resistance. (A) Basal transcription of stable clones of HeLa-CD4 LTR promoters (WT, MUT1 and MUT2) driving luciferase. Twenty-four hours after plating, cells were treated with DMSO or 100 nM dCA for 48 h. TAR mRNA expression was measured and normalized to total proviral DNA. Data are normalized to 1 to the WT LTR-treated DMSO condition (n = 3). (B) Activation of WT or MUT LTRs by WT or dCA MUT viruses. HeLa-CD4 cells stably expressing WT or MUT LTR-Luc were infected for 16 h with WT or MUT viruses in the presence of DMSO or dCA (100 nM). Cells were washed and treated with dCA or DMSO, and luciferase activity was measured 48 h later (n = 3). (C to E) Effects of Tat, Nef and Vpr transactivation of WT and MUT LTRs in the presence or absence of dCA. (Top) Activity of the WT and MUT LTRs in the presence or absence of dCA after Tat transfection alone or in combination with Nef, Vpr or their mutated/truncated forms. At 24 h posttransfection, the cells were treated with either DMSO or 100 nM dCA for 48 h. Cells were then lysed and luciferase activity was measured. Data are normalized to 100% of the values for the DMSO controls (n = 3). (Bottom) Expression of FLAG-tagged Tat (FLAG-Tat), FLAG-Nef, FLAG-Nef-1, FLAG-Nef-2, FLAG-Vpr and FLAG-Vpr1-57 in the presence of DMSO or dCA from cells presented in the top panels, quantified by Western blotting using an anti-FLAG antibody and anti-GAPDH antibody as a control. All data are presented as means plus SEM. One-way ANOVA followed by a Bonferroni posttest were used for statistical comparisons. *, P < 0.05; **, P < 0.01; ***, P < 0.001; ****, P < 0.0001.
FIG 8
FIG 8
Impact of Nef mutation and Vpr truncation on NF-κB activation. (A) HeLa-CD4 cells were cotransfected with a luciferase reporter vector under the control of a NF-κB promoter, with increasing amounts of Nef, Nef-2, Vpr or Vpr1-57 expression vectors. Luciferase activity was measured 48 h posttransfection. Renilla luciferase construct was cotransfected for normalization. For a control for NF-κB activation, the cells were treated or not treated with TNF-α for 30 min prior to lysis (n = 3). (B) Representative Western blot of proteins transfected in panel A revealed with anti-FLAG (α-FLAG), anti-NF-κB or anti-GAPDH antibodies. Expression levels of Vpr1-57 were too low to be detected by Western blot (n = 3). (C) Detection by RT-qPCR of mRNA levels of Vpr1-57 from samples indicated in panel A (n = 2). All data are presented as means plus SEM. The two-way ANOVA followed by a Bonferroni post-test were used for statistical comparisons. *, P < 0.05; ****. P < 0.0001.

Comment in

Similar articles

Cited by

References

    1. Perelson AS, Neumann AU, Markowitz M, Leonard JM, Ho DD. 1996. HIV-1 dynamics in vivo: virion clearance rate, infected cell life-span, and viral generation time. Science 271:1582–1586. doi:10.1126/science.271.5255.1582. - DOI - PubMed
    1. Roberts JD, Bebenek K, Kunkel TA. 1988. The accuracy of reverse transcriptase from HIV-1. Science 242:1171–1173. doi:10.1126/science.2460925. - DOI - PubMed
    1. Shriner D, Rodrigo AG, Nickle DC, Mullins JI. 2004. Pervasive genomic recombination of HIV-1 in vivo. Genetics 167:1573–1583. doi:10.1534/genetics.103.023382. - DOI - PMC - PubMed
    1. Charpentier C, Karmochkine M, Laureillard D, Tisserand P, Belec L, Weiss L, Si-Mohamed A, Piketty C. 2008. Drug resistance profiles for the HIV integrase gene in patients failing raltegravir salvage therapy. HIV Med 9:765–770. doi:10.1111/j.1468-1293.2008.00628.x. - DOI - PubMed
    1. Condra JH, Schleif WA, Blahy OM, Gabryelski LJ, Graham DJ, Quintero JC, Rhodes A, Robbins HL, Roth E, Shivaprakash M, Titus D, Yang T, Tepplert H, Squires KE, Deutsch PJ, Emini EA. 1995. In vivo emergence of HIV-1 variants resistant to multiple protease inhibitors. Nature 374:569–571. doi:10.1038/374569a0. - DOI - PubMed

Publication types

MeSH terms