. 2019 Jul 2;10(1):2753.
doi: 10.1038/s41467-019-10366-y.

Sequential LASER ART and CRISPR Treatments Eliminate HIV-1 in a Subset of Infected Humanized Mice

Affiliations

Sequential LASER ART and CRISPR Treatments Eliminate HIV-1 in a Subset of Infected Humanized Mice

Prasanta K Dash et al. Nat Commun. .

Abstract

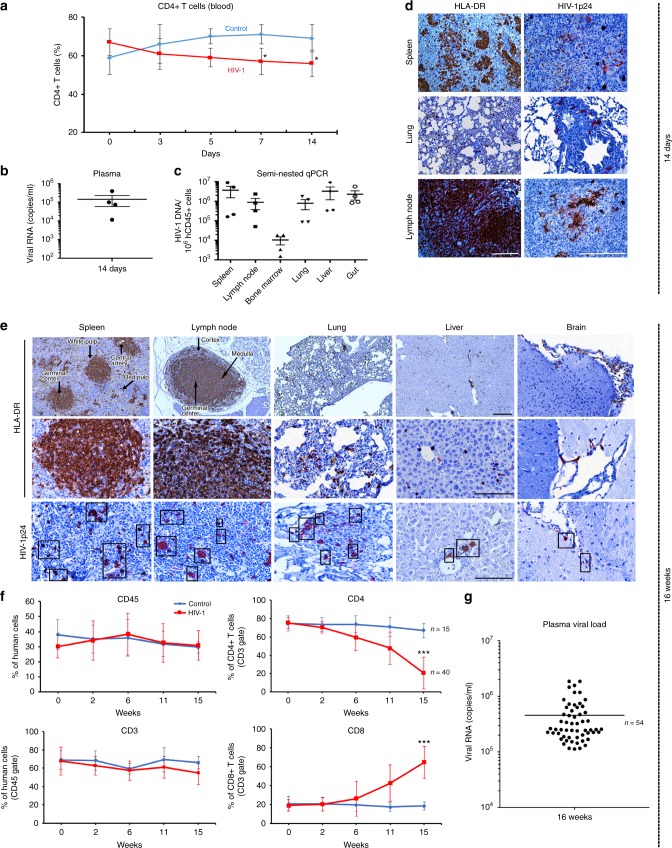
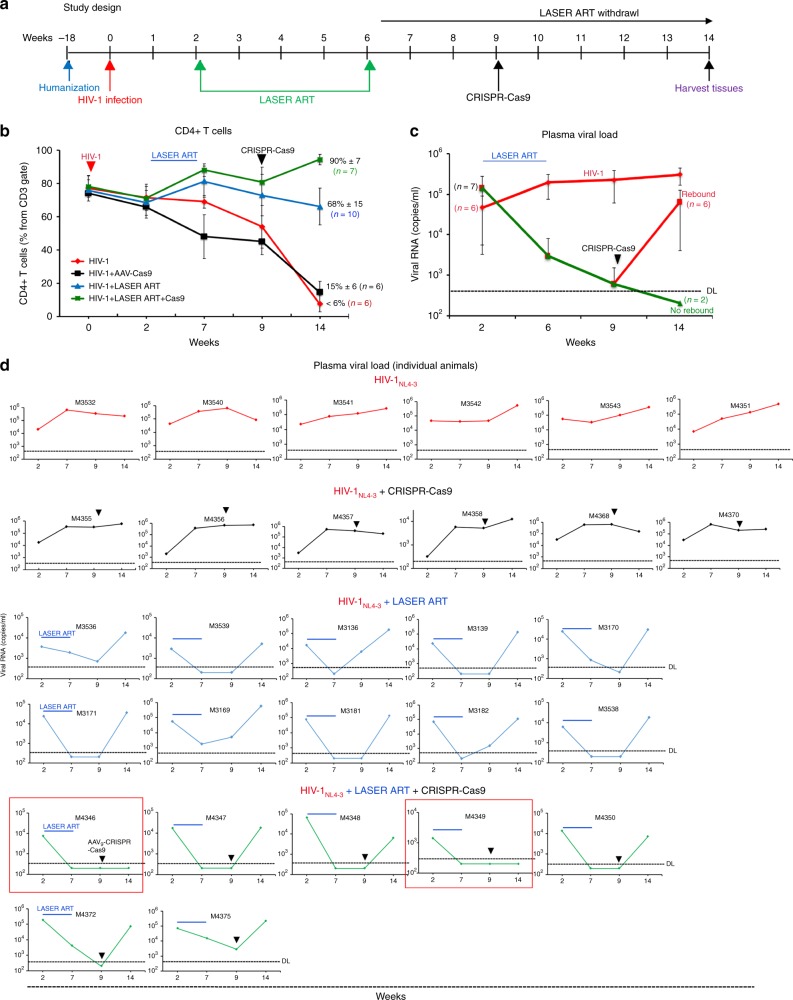
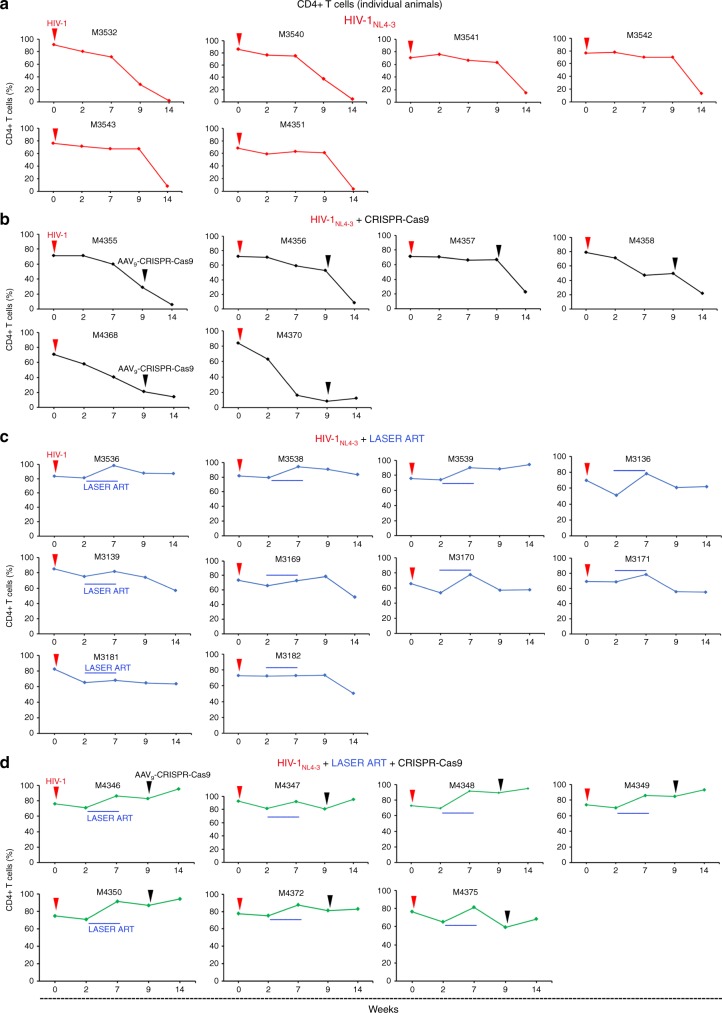
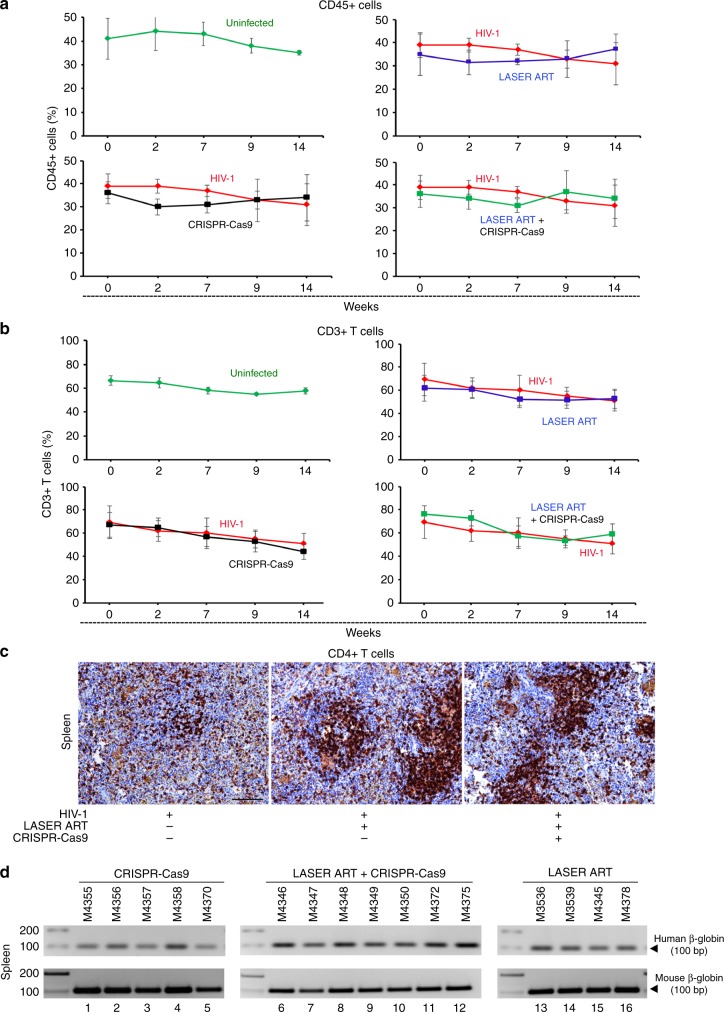
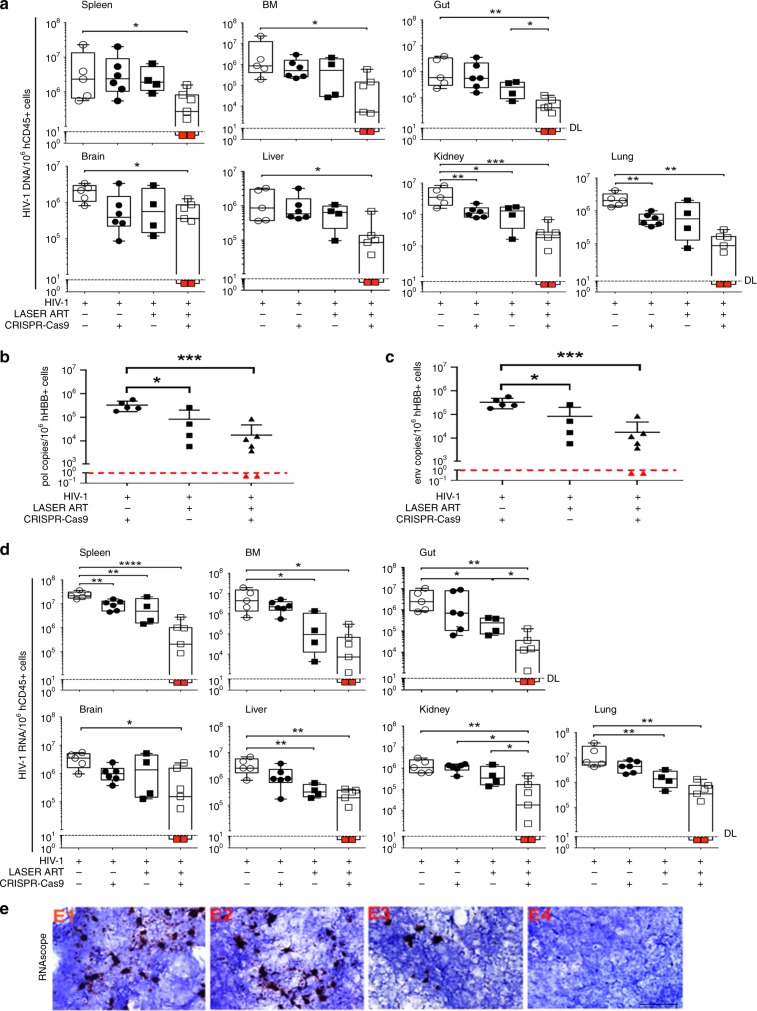
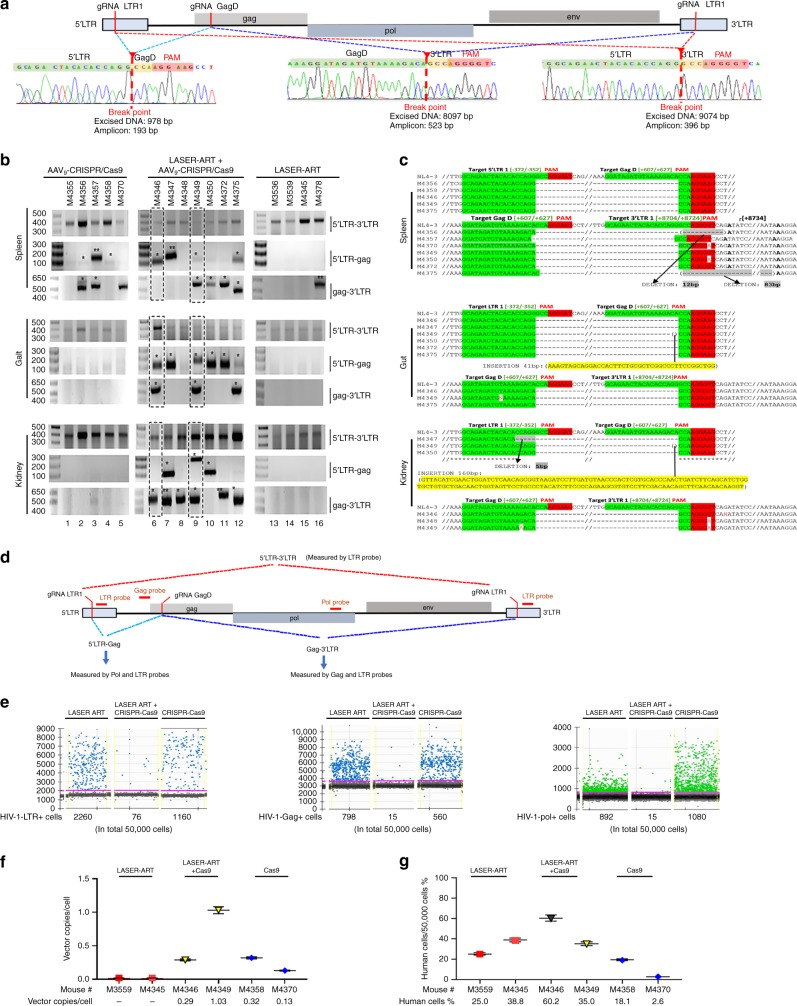
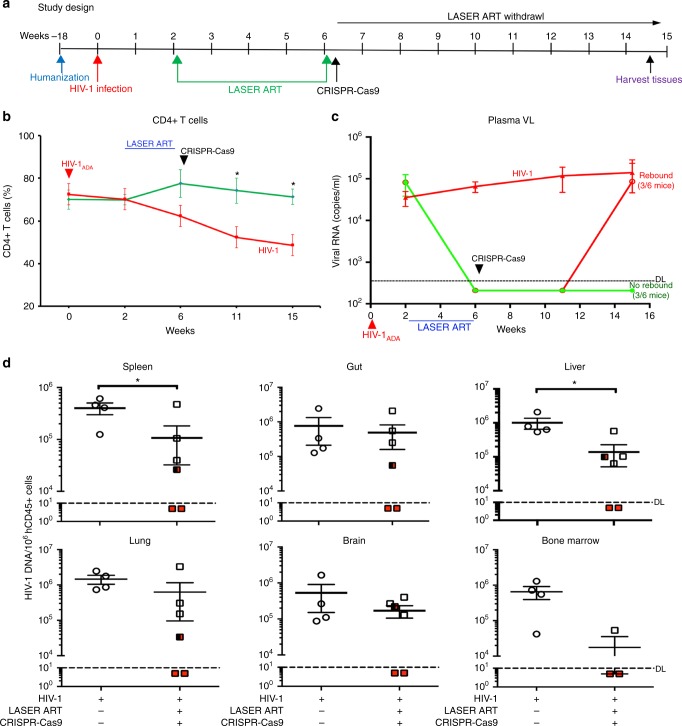
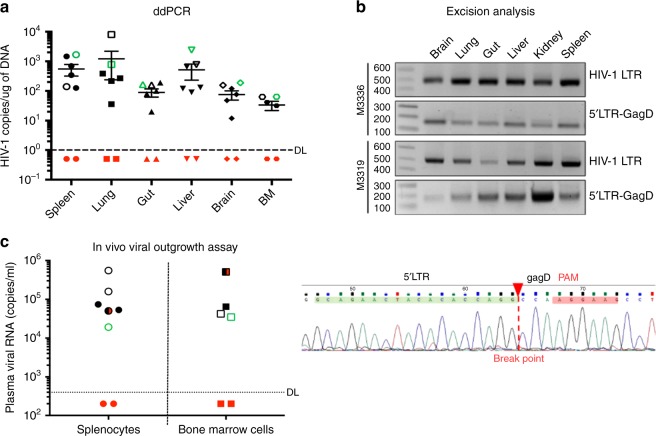
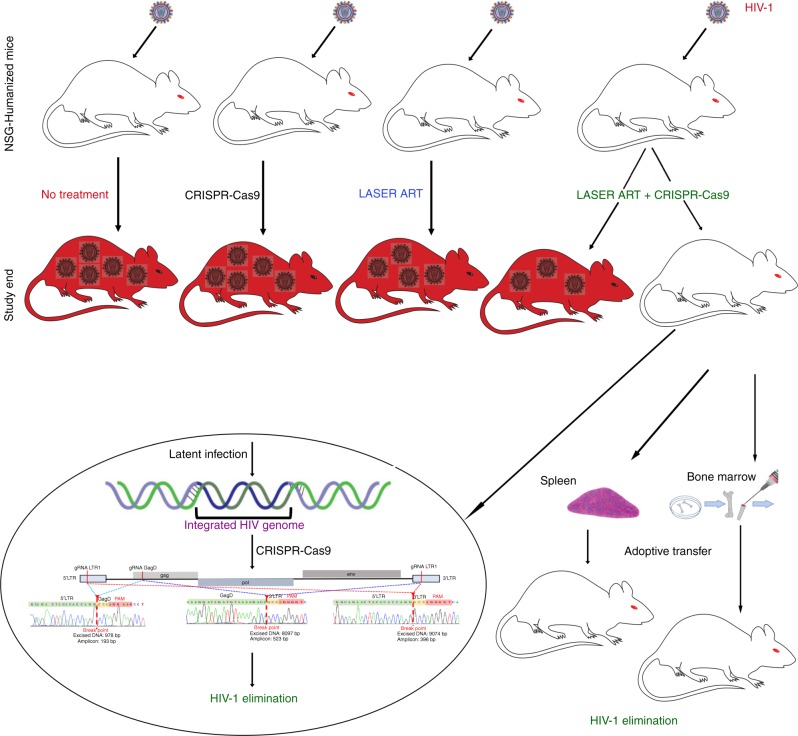
Elimination of HIV-1 requires clearance and removal of integrated proviral DNA from infected cells and tissues. Here, sequential long-acting slow-effective release antiviral therapy (LASER ART) and CRISPR-Cas9 demonstrate viral clearance in latent infectious reservoirs in HIV-1 infected humanized mice. HIV-1 subgenomic DNA fragments, spanning the long terminal repeats and the Gag gene, are excised in vivo, resulting in elimination of integrated proviral DNA; virus is not detected in blood, lymphoid tissue, bone marrow and brain by nested and digital-droplet PCR as well as RNAscope tests. No CRISPR-Cas9 mediated off-target effects are detected. Adoptive transfer of human immunocytes from dual treated, virus-free animals to uninfected humanized mice fails to produce infectious progeny virus. In contrast, HIV-1 is readily detected following sole LASER ART or CRISPR-Cas9 treatment. These data provide proof-of-concept that permanent viral elimination is possible.


Conflict of interest statement

K.K. and RK are named inventors on patents that cover the viral gene editing technology that is the subject of this article. HEG and BE are named inventors on patents that cover the medicinal and polymer chemistry technologies that were also employed in this manuscript. In addition to the foregoing interests, KK is a co-founder, board member, scientific advisor, and holds equity in Excision Biotherapeutics, a biotech start-up that has licensed the viral gene editing technology from Temple University for commercial development and clinical trials. H.E.G. is the founder of Brain First, a second independent biotech start-up and is the operative head of the Nebraska Nanomedicine Production Plant, a good manufacturing program facility that was responsible for synthesizing the long-acting slow effective release antiretroviral therapies used in the accompanying report. The authors declare that this work was produced solely by the authors and that no other individuals or entities influenced any aspects of the work including, but not limited to, the study conception and design; data acquisition, analysis and interpretation; and writing of the manuscript. No other entities provided funds for the work. The authors further declare that they have received no financial compensation from any other third parties for any aspects of the published work. The remaining authors declare no competing interests.

Figures

Fig. 1
Fig. 1
Viral and human immune profiles in a HIV-1 infected humanized mice. a Human CD4 + T cells were determined by flow cytometry in blood of humanized mice before infection (time 0) and on days 3, 5, 7, and 14 after HIV-1ADA infection (n = 4, red color). Each infected animal received 104 TCID50 of titered virus. Uninfected (control, n = 3) animals are shown in blue. b Viral load measurements in plasma of HIV-1 infected humanized mice at 14 days. c HIV-1 DNA was detected by semi-nested real-time qPCR in tissue of infected animals at 14 days after viral infection (n = 4). d Representative images of human HLA-DR expression in spleen, lung, and lymph nodes, confirms human cell reconstitution in all animals. Replicate sections were stained for HIV-1p24 and show large numbers of infected cells. Scale- bars (10 and 40 μm) eg Immune cell profiles and viral load of tissue were evaluated 16 weeks after viral infection. e Photomicroscopic images illustrate human cells present in spleens, lymph nodes, lungs, livers and brains of humanized mice. Tissue sections stained with anti- human HLA-DR (upper 2 panels) and HIV-1p24 (bottom panels). f Total human CD45 + leukocytes, CD3 + and subpopulations of CD4 + and CD8 T + cells from blood of control (n = 15) and HIV-1 infected (n = 40) mice. g Plasma viral load was consist among the animals in both acute (14 days) and chronic (16 weeks) infectious paradigms, n = 54. One-way ANOVA and Bonferroni’s post-hoc tests for multiple comparisons and two-tailed Student’s t-test were used for statistical analyses in  a and f. *P < 0.05, ***P < 0.001. Source data are provided as a source data file
Fig. 2
Fig. 2
Viral load and CD4 + T cells in HIV-1 infected and treated humanized mice. Mice  were infected with 104 TCID50 of HIV-1NL4–3 followed by treatments with LASER ART, CRISPR-Cas9 or both. a The study scheme shows the times of infection and treatments. After confirmation of viral infection, 29 infected humanized mice were subdivided into four groups. The first group (n = 6, red) were left untreated (control), the second group (n = 6, black) received a single intravenous (IV) dose of AAV9-CRISPR-Cas9 (1012 units), nine weeks after viral infection, the third group (n = 10, blue) were administered LASER ART (NMDTG and NRPV at 45 mg/kg and NMABC and NM3TC at 40 mg/mg) by intramuscular (IM) injection two weeks after viral infection, the fourth (n = 7, green) were given LASER ART (as in group 3) and three weeks after the last LASER ART treatment, a single IV dose of AAV9-CRISPR-Cas9 was administered as in group 2. LASER ART treatment was ceased and after an additional five weeks, antiretroviral drug levels were assessed and were at or below the limit of  quantitation < 1 ng/ml (Table 1). b Flow cytometry for human CD4 + T cells are shown with increased numbers of CD4 counts in the LASER ART and dual LASER ART and CRISPR-Cas9 groups. c Evaluation of plasma viral load indicated that after administration of AAV9-CRISPR-Cas9, 2 of 7 mice showed no evidence for viral rebound at 14 weeks. d Plasma viral load of individual animals for different treatment groups of humanized mice were assayed at 2, 7, 9, and 14 weeks of HIV-1 infection for HIV-1 RNA. Viral RNA levels were determined by the COBAS Ampliprep-Taqman-48 V2.0 assay with a sensitivity of 200 copies/ml once adjusted to the plasma dilution factor. Viral RNA rebound was observed at the study end in all 10 LASER ART treated animals. This corresponded to eight weeks after therapy interruption. Rebound was also observed at the study end in 5 of 7 dual-treated animals. Virus was not observed in two dual-treated animals (M4346 and M4349) and  are highlighted in the red boxes. Source data are provided as a source data file
Fig. 3
Fig. 3
Human CD4 + T cells in HIV-1 infected and treated humanized mice. ad Peripheral blood of humanized mice  was assayed before and 2, 7, 9, and 14 weeks after HIV-1NL4-3 infection and the presence of human CD4 + cells from CD3 + gated populations were examined. a Percentage of human CD4 + T cells followed a decreased pattern in all mice (n = 6, red) in the HIV-1 infected group. b Percentage of human CD4 + T cells were decreased in all mice (n = 6, black) in the HIV-1 infected and AAV9-CRISPR-Cas9 group. c CD4 + T cell profile of HIV-1 infected and LASER ART animals (n = 10, blue) showed a decline in CD4 + T cell numbers two weeks after viral infection. LASER ART was eliminated eight weeks after treatment. d CD4 + T cells of HIV-1 infected and LASER ART and AAV9-CRISPR-Cas9-treated animals (n = 7, green). Decreased CD4 + T cell numbers were seen as early as two weeks after infection. At this time, LASER ART was administered for four weeks followed by AAV9-CRISPR-Cas9 given at week 9. The mice were then followed for an additional five weeks. Restoration of CD4 + T cells  was observed in both LASER ART and LASER ART and AAV9-CRISPR-Cas9 treatment groups. Source data are provided as a source data file
Fig. 4
Fig. 4
Human leukocytes in blood and spleens of humanized mice. a, b Peripheral blood of HSC reconstituted mice was assayed before and after 2, 7, 9, and 14 weeks of HIV-1NL4–3 infection for human CD45 + (A) and CD3 + (B) cells. The experiments were performed to assess levels of humanization and percentage of total CD3 + T cells throughout the study. These included uninfected (n = 3, green), HIV-1NL4–3 infected (n = 6, red), HIV-1 and AAV9-CRISPR-Cas9-treated (n = 6, black), HIV-1 and LASER ART (n = 10, blue), and HIV-1 and LASER ART and AAV9-CRISPR-Cas9 (n = 7, blue/black) treated mice. All are shown from data generated from the experiments outlined in Fig. 3. In the HIV-1 infected mice group, the numbers of CD45 + and CD3 + human cells in blood of mice were comparable to the treatment groups. We did not observe any differences amongst time points when compared to control uninfected and untreated animals. c Immunohistochemistry was performed in spleens of HIV-1 infected mice to confirm T cell reconstitution. Here, the spleens of infected animals treated with LASER ART or both LASER ART and CRISPR-Cas9 were examined for the presence and numbers of CD4 + T cells. Significant reductions in CD4 + T cells (brown stained cells)  were seen readily in the HIV-1-infected control mice. These cells were protected in HIV-1 infected animals treated with LASER ART with or without CRISPR-Cas9. Scale bar, 10 μm. d Verification of the presence of human cells in the spleens of humanized mice. PCR analysis of genomic DNA isolated from the spleens of humanized mice using primer sets specific to human and mouse beta-globin. Source data are provided as a source data file
Fig. 5
Fig. 5
Viral DNA and RNA in HIV-1 infected and treated humanized mouse tissues. a HIV-1 DNA and (d) HIV-1 RNA analyses using ultrasensitive semi-nested real-time qPCR assays from spleen, bone marrow, gut, brain, liver, kidney, and lung from treatment groups described in Fig. 4a–c. Animal numbers were decreased in one group due to deaths seen through the experimental observation period. The data represent each of the four groups HIV-1 infected (n = 5), HIV-1 infected and AAV9-CRISPR-Cas9 treated (n = 6), HIV-1 infected and LASER ART treated (n = 4) and HIV-1 infected LASER ART and AAV9-CRISPR-Cas9-treated mice (n = 7). The data are expressed as total HIV-1 DNA (a) or HIV-1 RNA (d) copies/106 human CD45 + cells. Two animals, M4346 and M4349 [shown by the red squares below the dashed lines (detection limit)], with dual treatments, showed sterilization of virus from all tissues analyzed. b, c Quantitative PCR showed complete elimination of signals corresponding to pol (b) and env (c) DNA sequences of HIV-1 in mice M4346 and M4349 (shown as red triangles). One-way ANOVA and Bonferroni’s post-hoc tests for multiple comparisons and two-tailed Student’s t test were used for comparisons between two groups for statistical analyses. *P < 0.05, **P< 0.01, ***P< 0.001, ****P < 0.0001. e Representative results from RNAscope assay revealed the detection of single or clusters of brown dots corresponding to HIV-1 RNA in 5 μm-thick spleen sections of infected animals receiving either LASER ART or CRISPR-Cas9 alone, but not both (M4346). E1, humanized mice infected with HIV-1 (controls); E2, HIV-1 infected animals treated only with CRISPR-Cas9; E3, HIV-1 infected LASER ART treated animals demonstrating viral rebound after cessation of therapy; E4, infected animals treated with LASER ART followed by CRISPR-Cas9. E1-E4 are representative tissue sections taken from each of the animal groups. In these assays, we used the antisense V-HIV1-Clade-B targeting 854–8291 bp of HIV-1 as the probe. Scale bar 40μM. Source data are provided as a source data file
Fig. 6
Fig. 6
Excision of HIV-1 DNA by CRISPR-Cas9 in HIV-1 infected humanized mice. a Schematic illustration of proviral HIV-1NL4–3 DNA highlighting the positions of gRNA LTR1 and gRNA GagD target sites, their nucleotide compositions, and the three CRISPR-Cas9 induced break points. b Total DNA from spleen, gut, and kidney from three groups of animals used for PCR genotyping with primers sets derived from the 5’LTR, 3’LTR, and the HIV-1 gag gene. Predicted amplicons of 193 bp and 523 bp, which result from the excisions of DNA fragments between 5’LTR to Gag and Gag to 3’LTR, respectively, were selected for DNA sequencing. The fragment of 396 bp represents both populations of full length LTRs, as well as the chimeric of both 5’ and 3’LTR after excision of entire proviral genome. Single asterisks above the bands point to the specificity of fragmental HIV DNA excision by CRISPR-Cas9 as verified by Sanger sequencing (supplementary figs. 3 and 4). The double asterisk depicts non-specific amplicons (supplementary fig. 2). The dashed boxes show the excised HIV-1 amplicons in the two animals with no viral rebound. c Representative DNA sequences from each group were aligned to the reference LTR-Gag region of the HIV-1NL4–3 sequence. The positions and nucleotide compositions of targets for gRNAs LTR1 and GagD are shown in green, PAM in red, and insertion sequences in yellow. Arrows highlight positions of small and large deletions. d Schematic showing locations of each gRNA, the TaqMan probe and the possible excision outcomes. e Representative ddPCR data for HIV-1, LTR, Gag, and Pol collected from one HIV-infected humanized mouse of each group treated with LASER ART, LASER ART plus AAV9-CRISPR-Cas9 or AAV9-CRISPR-Cas9 only (Cas9) are shown. f TaqMan probe and primers specific for saCas9, which was delivered by AAV9, were used to determine the AAV transduction efficiency and represented as  AAV vector copies/cell. g Total human cell population in samples was measured using TaqMan probe and primers specific for human beta-actin. Source data are provided as a source data file
Fig. 7
Fig. 7
Viral elimination in a subset of HIV-1 infected and treated humanized mice. Dual LASER ART and CRISPR-Cas9 treatment resulted in viral elimination in up to a third of HIV-1ADA infected animals. Validation was made by state of the art viral, immune, and excision detection systems. a The timeline of the experiment showing the temporal administration of LASER ART and CRISPR-Cas9 treatments, and animal sacrifice. b The percentage of human CD4 + T cells and (c) viral loads measured in the HIV-1 infected (n = 4, red). Dual treated animals (n = 6, green) that showed no (n = 3, green) or viral rebound (n = 3, green to red) in plasma. d HIV-1 DNA analysis was performed using ultrasensitive semi-nested real-time qPCR assays from spleen, gut, liver, lung, brain and bone marrow from infected (n = 4, open circles) and infected and dual-treated mice (n = 6, squares). Whole bone marrowcells isolated from three animals (out of 6) from the dual-treated rebound group were used for adoptive transfer, Therefore, the data represent n = 3 for real-time-PCR assay for the dual-treated animals in the bone marrow adoptive transfer studies. The data are expressed as total HIV-1 DNA copies/106 human CD45 + cells. Two animals, M3319 and M3336 (illustrated by the red squares) were below the dashed lines for virus detection as measured by plasma VL. These animals had no detectable viral DNA after dual treatments demonstrating viral sterilization from all analyzed tissues. A single animal (M3324), as illustrated by a half-red-black designation, had an undetectable VL in plasma, but viral DNA was amplified in all the tissues analyzed. Source data are provided as a source data file
Fig. 8
Fig. 8
Confirmation of viral elimination in HIV-1 infected and treated mice tissues. a Ultrasensitive ddPCR, with sensitivity of detecting 1–2 viral copies, was used in cross validation tests for viral DNA detection and performed in tissues of HIV-1ADA-infected and infected/dual-treated animals. As a positive control, one animal each from the HIV-1 infected (open black structure) and HIV-1 and LASER ART (open green structure) groups are illustrated. These were placed together with the six infected animals from the dual treatment group illustrated as closed structures (either black or red). Dashed line represents the limit of detection. Results are shown as the mean ± SEM (BM: bone marrow). b Agarose gel analyses of the PCR assay of DNA from various tissues of two animals with no rebound shows the presence of segments of HIV-1 LTR DNA and detection of a 193 bp amplicon, indicative of excision of a DNA fragment between the LTR and the gag gene (top). The histogram illustrates representative results from sequencing of the  193 bp fragment highlighting the position of the 5’ LTR breakpoint, and Gag and PAM trinucleotide on the GagD RNA. c An in vivo viral outgrowth assay was performed by adoptive transfer of splenocytes and bone marrow cells from infected and virus eradicated LASER ART + CRISPR Cas9-treated mice to uninfected recipient CD34 + NSG-hu mice. These animals failed to show viral recovery after one month of examination by plasma viral RNA measurements. Confirmation assays were performed as positive controls: two animals from an HIV-1 infected  group (open black circles for spleen and boxes for bone marrow) and an animal from a LASER ART treatment group are shown as open green circles (spleen) and box (bone marrow). All controls readily recovered virus. Five animals from the dual treatment group are illustrated as closed circles (spleen) and boxes (bone marrow). Virus was not detected in plasma from animals injected with splenocytes and bone marrow cells isolated from 2 dual-treated animals (M3319 and M3336, red circles and boxes) and used as the definition of viral eradication. Source data are provided as a source data file
Fig. 9
Fig. 9
A working model for HIV-1 elimination. A cartoon illustration of the viral elimination strategy is shown for single LASER ART, AAV9-CRISPR-Cas9 injection groups and dual treatment groups. We highlight the observed restriction of viral infection by LASER ART and an inability to achieve elimination of virus by AAV9-CRISPR-Cas9 treatment alone. However, the sequential administration of LASER ART and AAV9-CRISPR-Cas9 can achieve viral elimination in a subset of animals. Why specific animals are cured of infection while others are not is incompletely understood but tied, in measure, to viral set points

Similar articles

Cited by

References

    1. Chun TW, et al. Presence of an inducible HIV-1 latent reservoir during highly active antiretroviral therapy. Proc. Natl Acad. Sci. USA. 1997;94:13193–13197. doi: 10.1073/pnas.94.24.13193. - DOI - PMC - PubMed
    1. Lorenzo-Redondo R, et al. Persistent HIV-1 replication maintains the tissue reservoir during therapy. Nature. 2016;530:51–56. doi: 10.1038/nature16933. - DOI - PMC - PubMed
    1. Deeks SG, et al. International AIDS Society global scientific strategy: towards an HIV cure 2016. Nat. Med. 2016;22:839–850. doi: 10.1038/nm.4108. - DOI - PMC - PubMed
    1. Hutter G, et al. Long-term control of HIV by CCR5 Delta32/Delta32 stem-cell transplantation. New Engl. J. Med. 2009;360:692–698. doi: 10.1056/NEJMoa0802905. - DOI - PubMed
    1. Gupta, R. K. et al. HIV-1 remission following CCR5Delta32/Delta32 haematopoietic stem-cell transplantation. Nature568, 244–248 (2019). - PMC - PubMed

Publication types