. 2019 Jul 2;10(1):2921.
doi: 10.1038/s41467-019-10970-y.

A molecular switch from STAT2-IRF9 to ISGF3 underlies interferon-induced gene transcription

Affiliations

A molecular switch from STAT2-IRF9 to ISGF3 underlies interferon-induced gene transcription

Ekaterini Platanitis et al. Nat Commun. .

Abstract

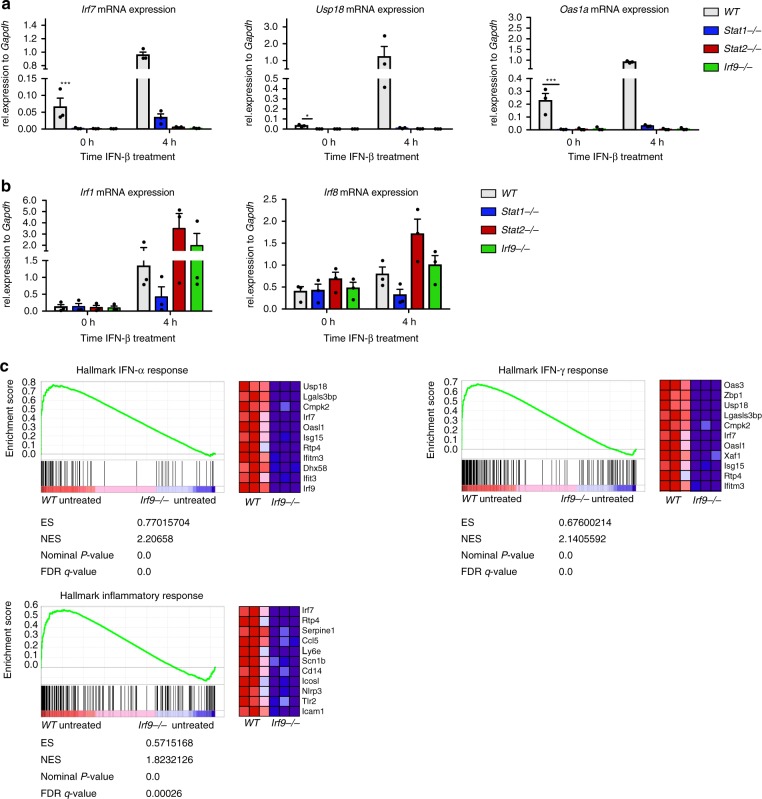
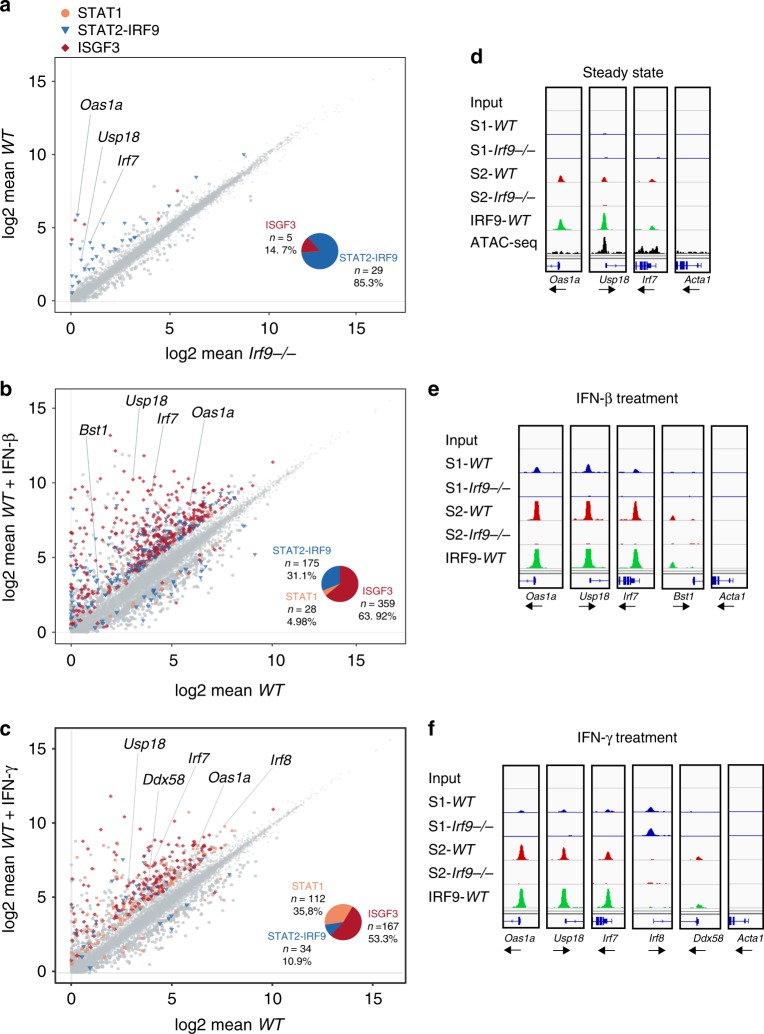
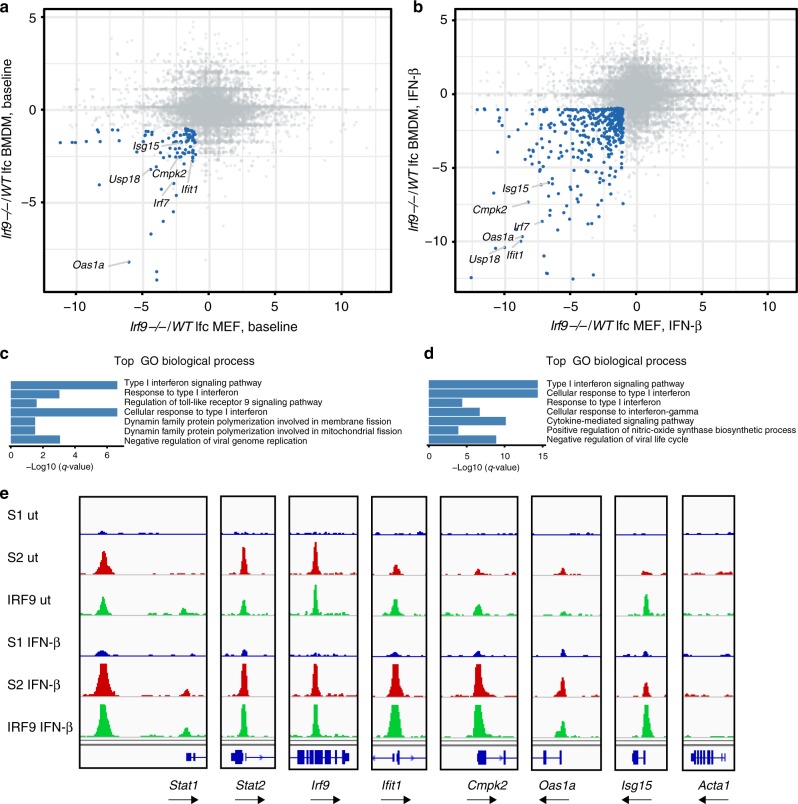
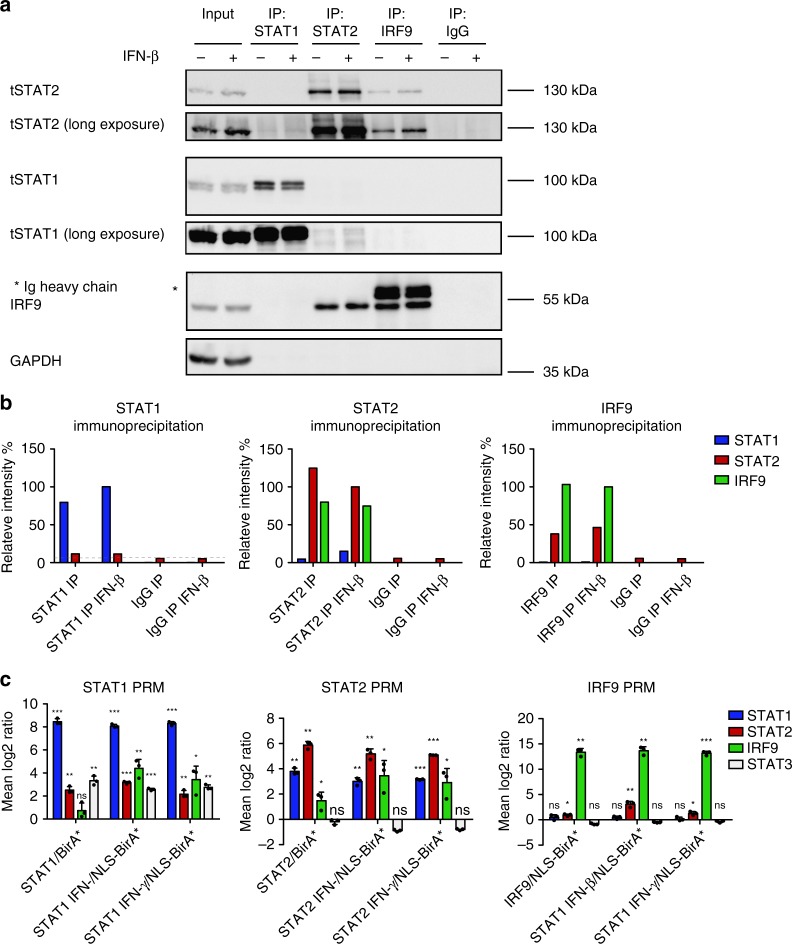
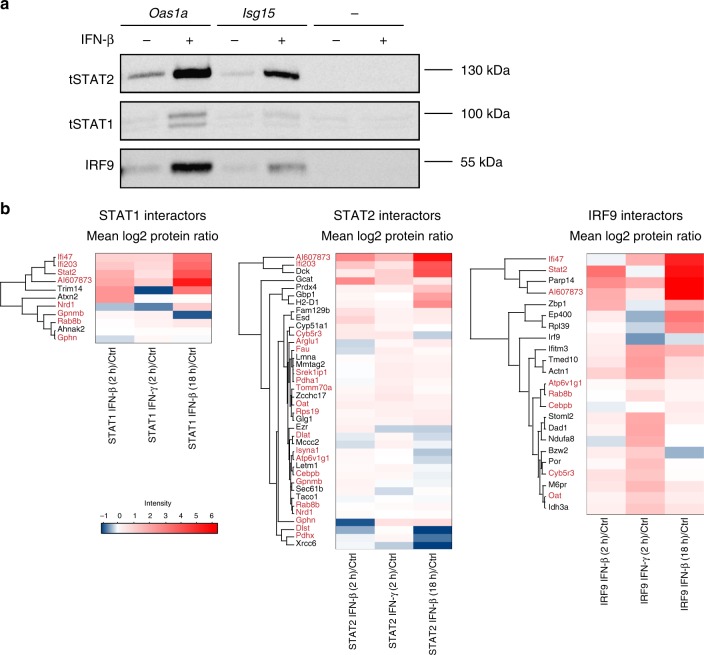
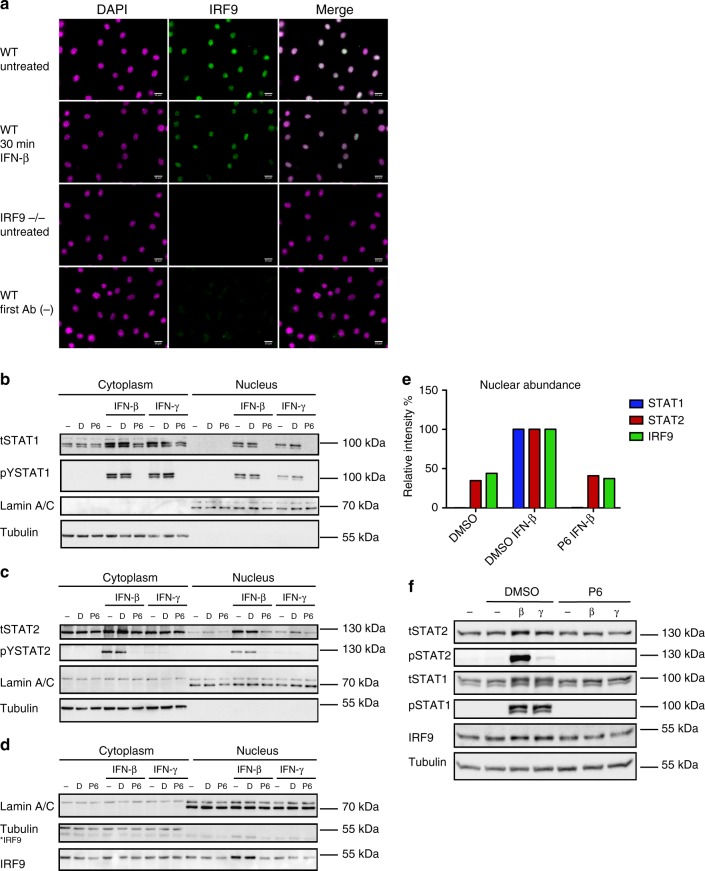
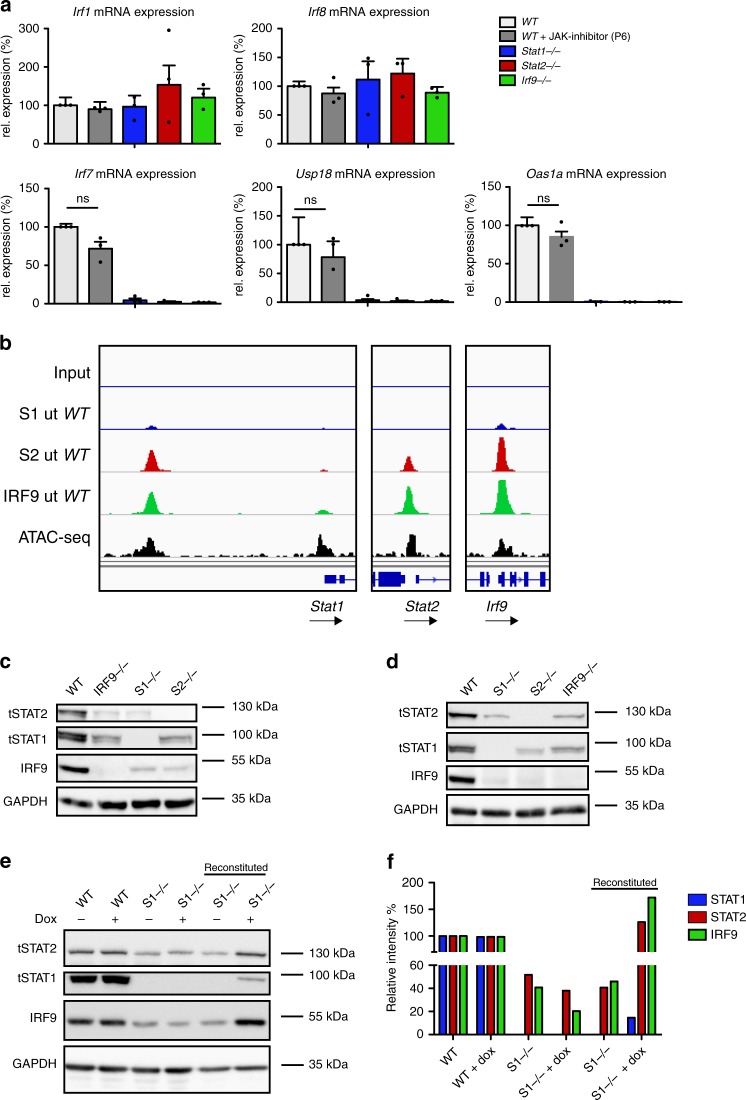
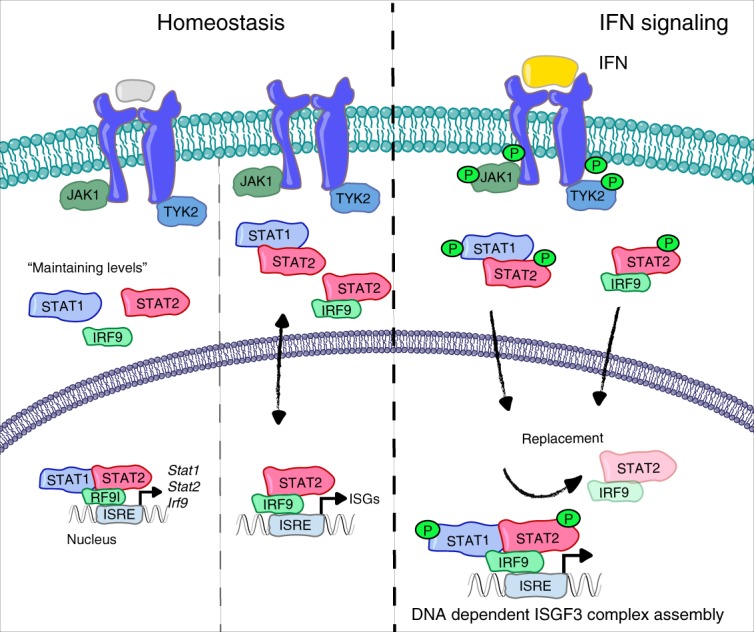
Cells maintain the balance between homeostasis and inflammation by adapting and integrating the activity of intracellular signaling cascades, including the JAK-STAT pathway. Our understanding of how a tailored switch from homeostasis to a strong receptor-dependent response is coordinated remains limited. Here, we use an integrated transcriptomic and proteomic approach to analyze transcription-factor binding, gene expression and in vivo proximity-dependent labelling of proteins in living cells under homeostatic and interferon (IFN)-induced conditions. We show that interferons (IFN) switch murine macrophages from resting-state to induced gene expression by alternating subunits of transcription factor ISGF3. Whereas preformed STAT2-IRF9 complexes control basal expression of IFN-induced genes (ISG), both type I IFN and IFN-γ cause promoter binding of a complete ISGF3 complex containing STAT1, STAT2 and IRF9. In contrast to the dogmatic view of ISGF3 formation in the cytoplasm, our results suggest a model wherein the assembly of the ISGF3 complex occurs on DNA.


Conflict of interest statement

The authors declare no competing interests.

Figures

Fig. 1
Fig. 1
Conditions of basal ISG expression. a, b Bone marrow-derived macrophages (BMDM) isolated from wild-type (WT), Stat1−/−, Stat2−/−, and Irf9−/− mice were treated with 250 IU/ml of IFN-β as indicated. Gapdh-normalized gene expression was measured by RT-q-PCR. Data represent the mean and standard error of the mean (SEM) values of three independent experiments. P-values were calculated using the paired ratio t-test (*P ≤ 0.05; **P ≤ 0.01; ***P ≤ 0.001). c Gene set enrichment analyses showing upregulation of an IFN and inflammatory response signature of untreated WT compared with untreated Irf9−/− BMDM. The top correlated genes for each biological triplicate are displayed in the corresponding heat maps. The total height of the curve indicates the extent of enrichment (ES), with the normalized enrichment score (NES), the false discovery rate (FDR), and the P-value. Source data are provided as a source data file
Fig. 2
Fig. 2
IFN-induced gene expression and STAT complexes in BMDM. ac panels on the left. Scatterplot linking RNA-seq (n = 3) with ChIP-seq (n = 2) data (BMDM). Differentially expressed genes (log-fold change (lfc) > 1, padj < 0.05) between Irf9−/− and WT untreated (a), WT untreated versus WT IFN-β (b), or WT untreated versus IFN-γ-treated (c) BMDM are shown. Genes associated with complexes containing at least one of the ISGF3 subunits (STAT1, STAT2, and IRF9) according to ChIP with the respective antibodies are color-coded as follows. Blue triangles: STAT2–IRF9; red diamonds: STAT1, STAT2, and IRF9 (ISGF3); beige squares: STAT1 only. The pie chart inserts show the relative proportions of genes associated with STAT2–IRF9, ISGF3, or STAT1 dimers. Panels on the right df. Representative browser tracks of the ChIP-seq experiments shown in ac). Data from untreated (d), IFN-β (90 min; e), or IFN-γ- (90 min; f) treated BMDM derived from wild-type (WT) and Irf9−/− (IRF9−/−) mice are shown (scale 0–150). Individual tracks represent binding of STAT1 (S1/blue), STAT2 (S2/red), and IRF9 (green). Tracks are shown for ChIP-seq and control input, as well as regulatory chromatin sites from ATAC-seq for untreated BMDM, derived from data in ref.
Fig. 3
Fig. 3
IFN-induced gene expression and STAT complexes in MEFs. a, b Log-fold change (lfc)/lfc plot comparing WT or IRF9−/− BMDM with mouse embryonic fibroblast (MEF). mRNA expression (n = 3) ratios, with a cutoff padj ≤ 0.05 and lfc ≥ 1, (IRF9−/−/WT) in resting (a) or in IFN-β- treated (b) cells is plotted. Genes affected by the loss of IRF9 in both cell types are displayed in blue. c, d GO analysis of the IRF9-dependent genes in untreated (c) and IFN-β-treated (d) cells as defined in a, b. The top seven pathways are listed for IRF9-dependent genes (in blue). e Representative genome browser tracks for transcription factor binding at ISG and control loci (scale 0–60): STAT1 (S1/blue), STAT2 (S2/red), and IRF9 (green). Tracks represent ChIP-seq experiments in untreated and IFN-β-treated MEF
Fig. 4
Fig. 4
Signal dependence of complex formation from ISGF3 subunits. a BMDMs from wild-type (WT) animals were treated for 1.5 h with IFN-β and immunoprecipitation was carried out using antibodies against STAT1, STAT2, IRF9, or an IgG control. Immunoprecipitated complexes were analyzed by western blotting with antibodies to STAT1, STAT2, IRF9, and GAPDH. Input controls represent 10% of the total lysate used for the immunoprecipitation. b The representative blot was quantified using ImageJ software. Relative intensities of the bands were normalized to their corresponding input sample. Data represent relative intensities in percent, where STAT1, STAT2, and IRF9 levels in IFN-β-treated IPs equal 100%. c Targeted quantitative MS analysis of STAT1, STAT2, and IRF9 BioIDs using PRM. Raw 264.7 cells were treated with 0.2 µg/ml doxycycline for 24 h, followed by addition of 50 µM biotin for 18 h. Cells were treated for 2 h either with IFN-β or IFN-γ lysed and protein complexes were isolated by streptavidin affinity purification, followed by analysis with LC–MS. Mean log2-transformed protein ratios were calculated for three biological replicates of myc-STAT1-BirA*, myc-STAT2-BirA*, or myc-IRF9-BirA* cells normalized to their appropriate localization control. Standard deviation and t-test statistics were calculated for each of the target proteins. P-values (*P ≤ 0.05; **P ≤ 0.01; ***P ≤ 0.001). Source data are provided as a source data file
Fig. 5
Fig. 5
Complex formation of ISGF3 subunits and proximity labeling of interactors. a Raw 264.7 cells were treated for 1.5 h with IFN-β. Cell lysates were incubated with a biotinylated Oas1a-ISRE oligo, a biotinylated Isg15-ISRE oligo, or plasmid DNA. DNA-bound protein complexes were isolated by streptavidin affinity purification, followed by western blot analysis. b STAT1, STAT2, and IRF9 interactome dynamics in response to interferon treatment. Hierarchical cluster analysis of proteins significantly enriched upon treatment with IFN-β or IFN-γ. Proteins were filtered, which were at least twofold enriched above background (myc-BirA* or BirA*-NLS controls) in at least one condition at an adjusted p-value of < 0.01, and which showed at least a twofold increase in intensity after interferon induction when compared with steady-state conditions. For this filtered set of proteins, we computed the mean log2 LFQ protein ratio of the interferon-induced (2 and 18 h) and the steady-state condition and used these values to generate a hierarchical cluster analysis and heat maps in Perseus with default settings. Interactor names shown in red were found associated with more than one ISGF3 subunit across all experimental conditions, including interactors under resting conditions shown in Supplementary Data 7. Source data are provided as a source data file
Fig. 6
Fig. 6
Localization of STAT complexes in BMDM. a IRF9 localization as determined by immunofluorescence. BMDMs of wild-type (WT) and Irf9−/− (IRF9−/−) mice were left untreated or stimulated with IFN-β for 30 min. The cells were fixed and stained with an anti-IRF9 antibody followed by Alexa Fluor® 488-conjugated secondary antibody (green). Nuclei were stained with DAPI (magenta). First Ab (−) indicates the control without the first antibody. The scale bars represent 10 µm. bd Nuclear and cytoplasmic extracts from BMDM were prepared from controls or after a 30-min treatment with IFN-β or IFN-γ and analyzed by western blot. A 2:1 ratio of the nuclear-to-cytoplasmic fraction is shown. Where indicated, 15 µM P6 inhibitor or DMSO were added for 3 h prior to IFN treatment. Phosphorylation of STAT1 at Y701 and total STAT1 levels, as well as phosphorylation of STAT2 at Y689, total STAT2 and IRF9, and α-tubulin and lamin A/C levels were determined. e The nuclear fractions of the representative blots bd were quantified using ImageJ software. Relative intensities of the bands were normalized to their corresponding lamin C levels. Data represent relative intensities in percent, where STAT1, STAT2, and IRF9 levels in IFN-β-treated nuclear extracts equal 100%. f Phosphorylation of STAT1 at Y701, STAT2 at Y689, total STAT1, total STAT2, IRF9, and α-tubulin was determined in whole-cell lysates of BMDM. Overall, 15 µM P6 inhibitor or DMSO were added for 3 h prior to IFN treatment. Source data are provided as a source data file
Fig. 7
Fig. 7
Cross-regulation of ISGF3 subunits. a BMDMs isolated from WT, Stat1−/−, Stat2−/−, and Irf9−/− mice were left untreated or treated with 15 µM P6 inhibitor for 3 h. Gapdh-normalized gene expression was measured by RT-q-PCR. Data represent relative expression in percent, where WT untreated equals 100%. Data represent the mean and standard error of the mean (SEM) values of three independent experiments. P-values were calculated using the paired ratio t-test (*P ≤ 0.05; **P ≤ 0.01; ***P ≤ 0.001). b STAT1 (S1), STAT2 (S2), and IRF9 binding at the Stat1, Stat2, and Irf9 promoters (scale 0–150). The browser tracks represent data derived from the ChIP-seq experiments in BMDM described in the legend of Fig. 2. c Whole-cell extracts from wild-type, Stat1−/−, Stat2−/−, and Irf9−/− BMDMs were tested by western blot for total STAT1, STAT2, and IRF9 levels. d Whole-cell extracts from wild-type, Stat1−/−, Stat2−/−, and Irf9−/− mouse embryonic fibroblasts were analyzed by western blot for total STAT1, STAT2, and IRF9 levels. e Stat1−/− mouse embryonic fibroblasts were stably transduced with a doxycycline-inducible STAT1-myc construct. Whole-cell extracts from wild-type, Stat1−/−, and reconstituted Stat1−/− MEFs were tested by western blot for total STAT1, STAT2, and IRF9 levels in the absence and presence of doxycycline. f The representative blot in e was quantified using ImageJ. Relative intensities of the bands were normalized to their corresponding GAPDH levels. Data represent relative intensities in percent, where STAT1, STAT2, and IRF9 levels in untreated wild-type MEFs equal 100%. Source data are provided as a source data file
Fig. 8
Fig. 8
Model of the molecular switch from resting to IFN-induced gene expression. Under homeostatic conditions, a tonic signal from the type I-IFN receptor activates small quantities of ISGF3, which increase basal expression of the genes encoding the ISGF3 subunits STAT1, STAT2, and IRF9. This causes the constitutive formation of STAT1–STAT2 as well as STAT2–IRF9 complexes. Basal expression of a large fraction of interferon-induced genes (ISGs) is stimulated by STAT2–IRF9 complexes that appear in the nucleus without a signaling requirement. Signaling by the type I-IFN receptor and to a significant extent also by the IFN-γ receptor causes the formation of tyrosine-phosphorylated STAT1–STAT2 heterodimers that translocate to the nucleus and form an ISGF3 complex by associating on DNA with IRF9. The higher off-rate of STAT2–IRF9 compared with ISGF3 combined with a larger quantity of tyrosine-phosphorylated STAT1–STAT2 versus STAT2–RF9 complexes in IFN-treated cells most likely explains why a rapid exchange takes place after interferon treatment

References

    1. McNab F, Mayer-Barber K, Sher A, Wack A, O’Garra A. Type I interferons in infectious disease. Nat. Rev. Immunol. 2015;15:87–103. doi: 10.1038/nri3787. - DOI - PMC - PubMed
    1. MacMicking JD. Interferon-inducible effector mechanisms in cell-autonomous immunity. Nat. Rev. Immunol. 2012;12:367–382. doi: 10.1038/nri3210. - DOI - PMC - PubMed
    1. Darnell JEJ, Kerr IM, Stark GR. Jak-STAT pathways and transcriptional activation in response to IFNs and other extracellular signaling proteins. Science. 1994;264:1415–1421. doi: 10.1126/science.8197455. - DOI - PubMed
    1. Schindler C, Levy DE, Decker T. JAK-STAT signaling: from interferons to cytokines. J. Biol. Chem. 2007;282:20059–20063. doi: 10.1074/jbc.R700016200. - DOI - PubMed
    1. Kessler DS, Veals SA, Fu XY, Levy DE. Interferon-alpha regulates nuclear translocation and DNA-binding affinity of ISGF3, a multimeric transcriptional activator. Genes Dev. 1990;4:1753–1765. doi: 10.1101/gad.4.10.1753. - DOI - PubMed

Publication types

MeSH terms

Substances