. 2019 Jul 2;10(1):2908.
doi: 10.1038/s41467-019-10725-9.

Enhancer accessibility and CTCF occupancy underlie asymmetric TAD architecture and cell type specific genome topology

Affiliations

Enhancer accessibility and CTCF occupancy underlie asymmetric TAD architecture and cell type specific genome topology

Christopher Barrington et al. Nat Commun. .

Abstract

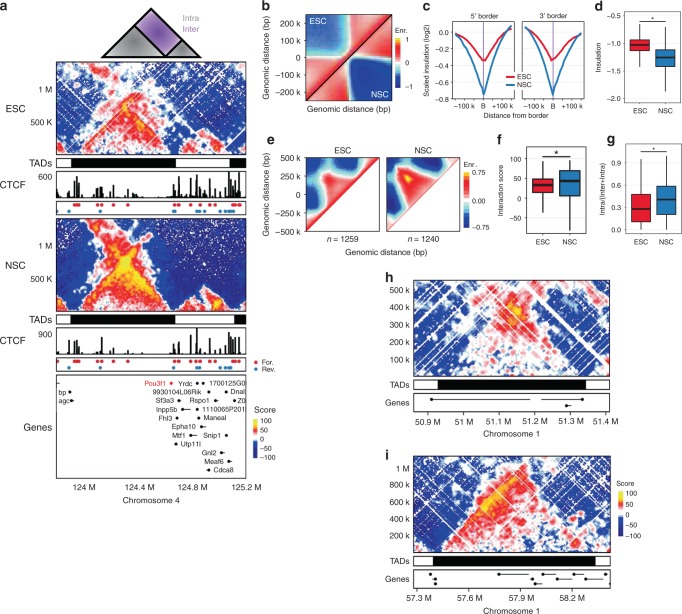
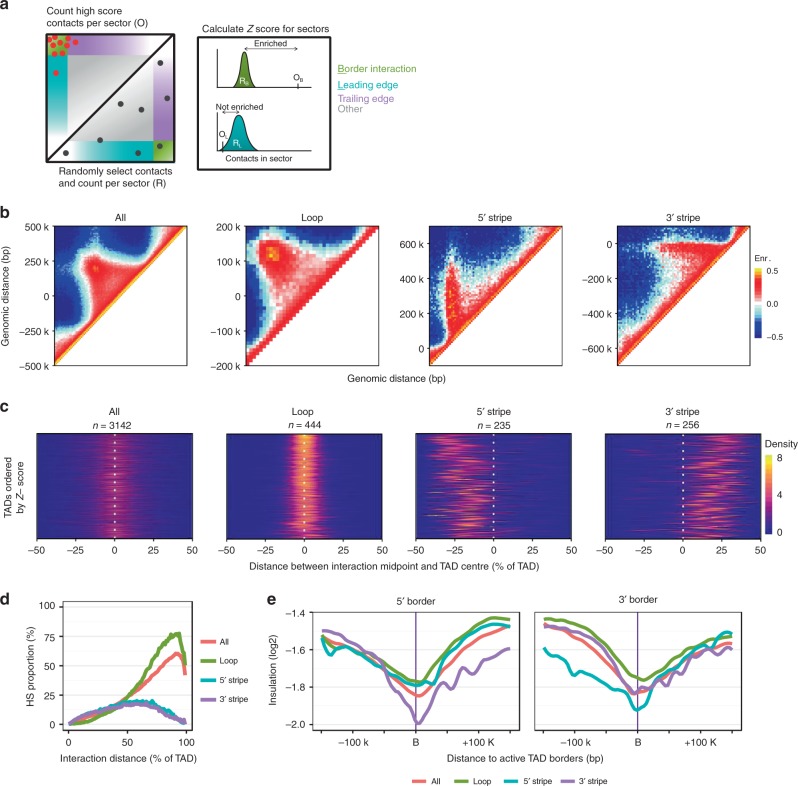
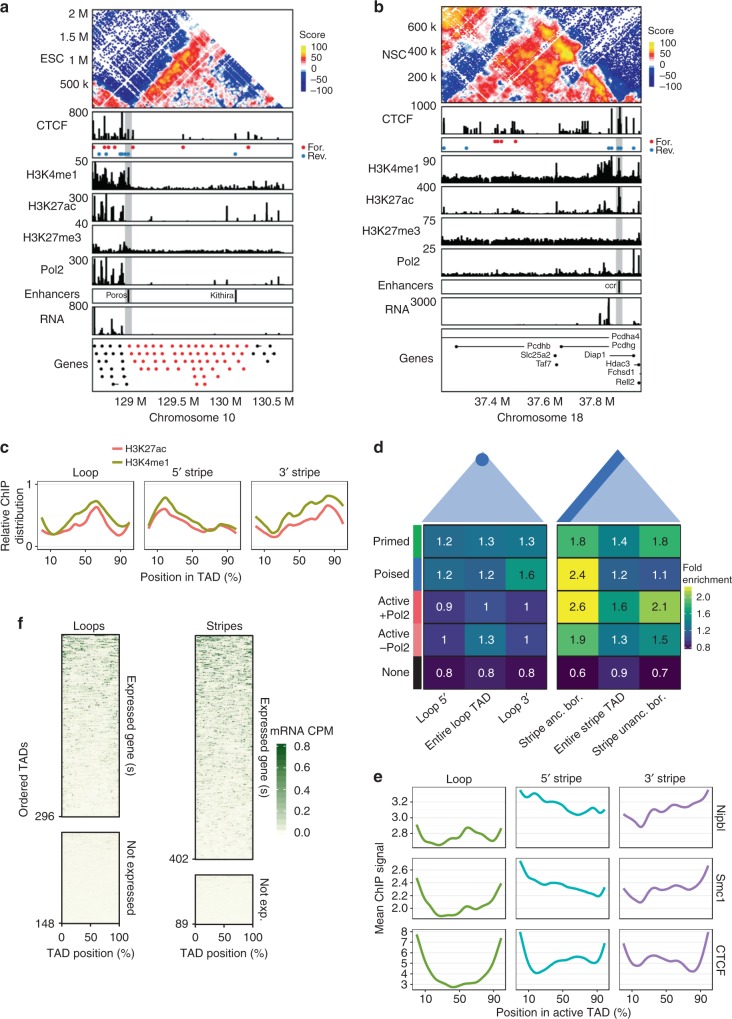
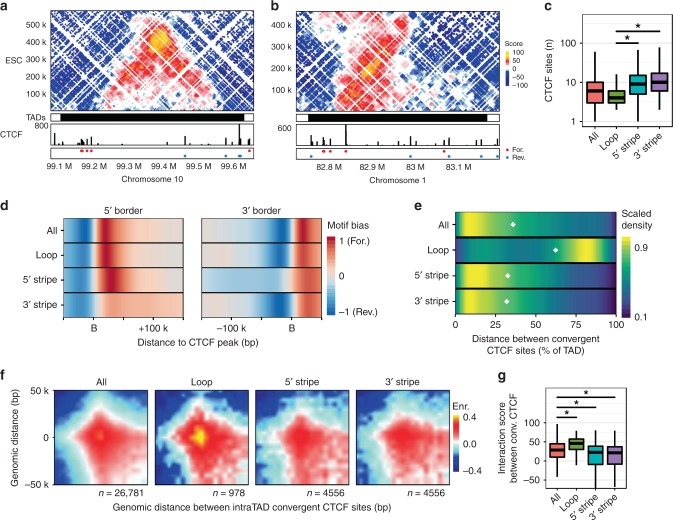
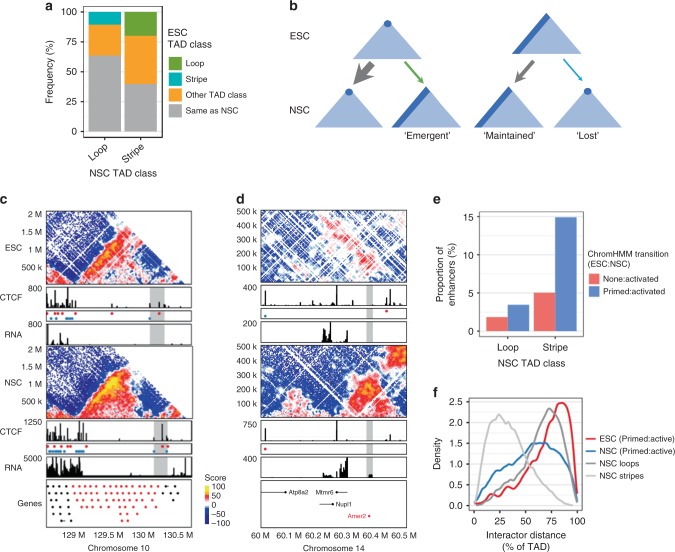
Cohesin and CTCF are master regulators of genome topology. How these ubiquitous proteins contribute to cell-type specific genome structure is poorly understood. Here, we explore quantitative aspects of topologically associated domains (TAD) between pluripotent embryonic stem cells (ESC) and lineage-committed cells. ESCs exhibit permissive topological configurations which manifest themselves as increased inter- TAD interactions, weaker intra-TAD interactions, and a unique intra-TAD connectivity whereby one border makes pervasive interactions throughout the domain. Such 'stripe' domains are associated with both poised and active chromatin landscapes and transcription is not a key determinant of their structure. By tracking the developmental dynamics of stripe domains, we show that stripe formation is linked to the functional state of the cell through cohesin loading at lineage-specific enhancers and developmental control of CTCF binding site occupancy. We propose that the unique topological configuration of stripe domains represents a permissive landscape facilitating both productive and opportunistic gene regulation and is important for cellular identity.


Conflict of interest statement

The authors declare no competing interests.

Figures

Fig. 1
Fig. 1
Topological changes during lineage commitment. a Schematic of intra-TAD (grey) and inter-TAD (purple) interactions (top). Hi-C and CTCF ChIP-seq data for a 1.5 Mb region on chr4 around the Pou3f1 gene in ESC (upper) and NSC (middle). TADs are represented as alternating black/white rectangles and gene annotations are shown in the bottom panel. Hi-C contact maps show the interaction ‘Scores’ for individual fragment end pairs, colour-coded according to the density of the observed contacts around it and normalised by the density of the expected contacts (see the section “Methods”). CTCF ChIP-seq tracks as well as colour-coded CTCF motifs under ChIP peaks are shown for both cell types (red and blue dots represent forward and reverse motifs, respectively). b Aggregate Hi-C maps of ESC (upper half) and NSC (lower half) TAD borders reveal increased insulation between NSC TADs. c Scaled contact insulation profiles across ESC (red) and NSC (blue) TAD borders at 300 kb band. d Distribution of observed insulation at borders in ESC (red) and NSC (blue). Central bar represents the median with boxes indicating the upper and lower quartiles. KS test *p < 0.001. e Aggregate Hi-C maps of size-selected (30th–70th percentiles) TADs from both cell types showing increased interactions between TAD borders in NSC (left panel), note strong ‘corner’ interaction in NSCs. f Distribution of mean interaction score between 20 kb regions centred on intra-TAD border pairs in ESC and NSC (right panel). Box plot as in d. g Distribution of TAD connectivity defined as the number of high-score contacts (>40) that are located within a TAD as a proportion of high-score contacts that connect the TAD to a 10 Mb region up or downstream of the TAD. Box plot as in d. h, i Examples of TAD types observed in ESC Hi-C data; h TAD with a prominent interaction between the TAD borders (loop domain) and (i) TAD with an asymmetric contact profile ‘anchored’ on the 5′ border (5′ stripe domain). Shown also are the TAD positions and gene annotations as in (a)
Fig. 2
Fig. 2
Unbiased identification of intra-TAD architecture. a Schematic representation of the analysis approach to classify TADs. See the section “Methods” for details. b Aggregate Hi-C contact maps of ESC TAD classes identified using the approach in a, and size-selected for visualisation (‘All’, n = 1259; ‘Loop’, n = 178; ‘5’ Stripe’, n = 93; ‘3’ Stripe’, n = 102). c Distribution of distances between high-scoring contact pairs and the TAD centre, relative to TAD size. All TADs in the class are ordered by Z-score along the y-axis. Yellow represents contact distances with the highest density. d Distribution of distances between high-scoring contact pairs in classified ESC TADs. TADs were scaled and discretized into 1% bins with the number of high-scoring interactions (score > 40) in each bin is shown as a proportion of interactions of any score in the same bin. e Mean contact insulation (300 kb band) within 150 kb of either the 5′ or 3′ TAD borders (‘B’ on the x-axis) and grouped according to TAD class
Fig. 3
Fig. 3
Lineage-appropriate enhancers and cohesin loading, not transcription, define stripe TAD polarity. a Hi-C contact map for a 2 Mb region around the Olfactory (Olf) gene cluster on chr10 in ESCs. Also shown is ChIP-seq data (CTCF, H3K4me1, H3K27ac, H3K27me3, Pol2), CTCF motifs at bound sites (annotated as before), RNA-seq data and the locations of the known Olf enhancers Poros and Kithira. Only the TSSs of the genes in the region are shown for clarity, with Olf TSSs coloured in red. Note, the cluster is located at the end of the chromosome, hence the abrupt lack of Hi-C data in the image. b Hi-C contact map for a 700 kb region around the Protocadherin (Pcdh) beta and gamma clusters on chr18 in NSCs. Epigenomic tracks as in a, including the known Pcdh enhancer ccr. c Scaled ChIP-seq signal distributions of enhancer histone marks (H3K4me1, H3K27ac) across active ESC TAD classes. d ChromHMM was used to define genomic segments into Primed (H3K4me1), Poised (H3K4me1, H3K27me3), Active (H3K4me1, H3K27ac ± Pol2) and None in ESCs. The enrichment of these segments with respect to the TAD borders of loop (left panel) or stripe domains (right panel) was then calculated using ChromHMM OverlapEnrichment (see also the section “Methods”). Fold enrichment values are shown. Borders were defined as a 60 kb region of the TAD and 5′ and 3′ stripe domains were oriented and grouped into anchored (anc.) or unanchored (unanc.) borders. e Distribution of ESC RNA-seq signal (counts per million) in 5 kb bins across scaled loop and stripe TADs calculated using deepTools. TADs were ordered according to the mean expression within the TAD (see the section “Methods” and Fig S3h). f Distribution of the mean ChIP-seq signal for Nipbl, Smc1, and CTCF across size-scaled and classified ESC TADs of the A compartment. Note, the signal was not scaled to allow comparison between TAD classes
Fig. 4
Fig. 4
CTCF occupancy and connectivity are key determinants of stripe TAD architecture. ESC Hi-C contact maps for (a) a 550 kb region on chr10 representative of a loop domain and (b) a 450 kb region on chr1 representative of a 5′ stripe domain. TAD calls, CTCF ChIP-seq data, and motifs at peaks are shown as before. c Distribution of the number of CTCF-binding sites in classified ESC TADs. Central bar represents the mean and whiskers and boxes indicate all and 50% of values, respectively. KS test *p < 0.001. d Distribution of bound CTCF motifs within 50 kb outside and 100 kb inside of TAD borders, separated into 5′ and 3′ borders (‘B’ on the x-axis). Colour scale represents the difference in density distribution of forward and reverse motifs. e Density distribution of distances between convergent CTCF motifs within TAD classes as a proportion of TAD size. White diamonds indicate median distances. f Aggregate Hi-C contact maps around pairs of intra-TAD convergent CTCF sites in ESCs. Pairs have a minimum interaction score of 40 within a 50 kb region. Number of pairs shown below each plot. g Quantification of interaction scores between convergent CTCF sites shown in (f), Box plot as in c, KS test *p < 0.001
Fig. 5
Fig. 5
Structural changes to stripe TADs accompanying differentiation are coincident with changes in CTCF occupancy or lineage-appropriate enhancers. a TAD class dynamics between ESC and NSCs. ESC TADs separated into loop or stripe domains that maintain at least one border during differentiation, and their classification in NSCs. Frequency represents the proportion of NSC classified domains that were maintained or changed from a given ESC TAD group. b Schematic representation of data in (a) revealing the fates of TAD classes during differentiation. c, d Hi-C contact maps from ESCs and NSCs revealing TAD class changes associated with CTCF-binding site occupancy or transcription changes. CTCF ChIP-seq tracks, motifs, gene annotations, and gene expression are shown as before. c A 2.1 Mb region on chr10 around the Olf gene cluster changes from an ESC stripe to an NSC loop domain in conjunction with an increase in CTCF signal in NSCs at the unanchored stripe border (highlighted grey). d New insulation at a 500 kb region on chr14 is associated with a change from an ESC stripe to an NSC loop domain upon NSC-specific expression of Amer2. e Activated NSC enhancers defined by ChromHMM which were either unclassified (‘None’, red) or Primed (blue) in ESCs and their distribution in NSC loop or stripe domains. f Distribution of intra-TAD contact distance as a proportion of TAD size, in ESC (red) or NSC (blue) Hi-C maps from active NSC-specific enhancers which were primed in ESCs (Primed:active). As a comparison, the distribution of contact distances in loop (dark grey) or stripe (light grey) NSC domains are also shown. Note the shift between the blue and red distributions upon activation of NSC enhancers. Enhancer elements were expanded by 20 kb to include enough contact information

References

    1. Dekker J, Mirny L. The 3D genome as moderator of chromosomal communication. Cell. 2016;164:1110–1121. doi: 10.1016/j.cell.2016.02.007. - DOI - PMC - PubMed
    1. de Laat W, Duboule D. Topology of mammalian developmental enhancers and their regulatory landscapes. Nature. 2013;502:499–506. doi: 10.1038/nature12753. - DOI - PubMed
    1. Dixon JR, et al. Topological domains in mammalian genomes identified by analysis of chromatin interactions. Nature. 2012;485:376–380. doi: 10.1038/nature11082. - DOI - PMC - PubMed
    1. Dixon JR, et al. Chromatin architecture reorganization during stem cell differentiation. Nature. 2015;518:331–336. doi: 10.1038/nature14222. - DOI - PMC - PubMed
    1. Stadhouders R, et al. Transcription factors orchestrate dynamic interplay between genome topology and gene regulation during cell reprogramming. Nat. Genet. 2018;50:238–249. doi: 10.1038/s41588-017-0030-7. - DOI - PMC - PubMed

Publication types

MeSH terms