. 2019 Jul 2;10(1):2919.
doi: 10.1038/s41467-019-10954-y.

Cell type-dependent differential activation of ERK by oncogenic KRAS in colon cancer and intestinal epithelium

Affiliations

Cell type-dependent differential activation of ERK by oncogenic KRAS in colon cancer and intestinal epithelium

Raphael Brandt et al. Nat Commun. .

Abstract

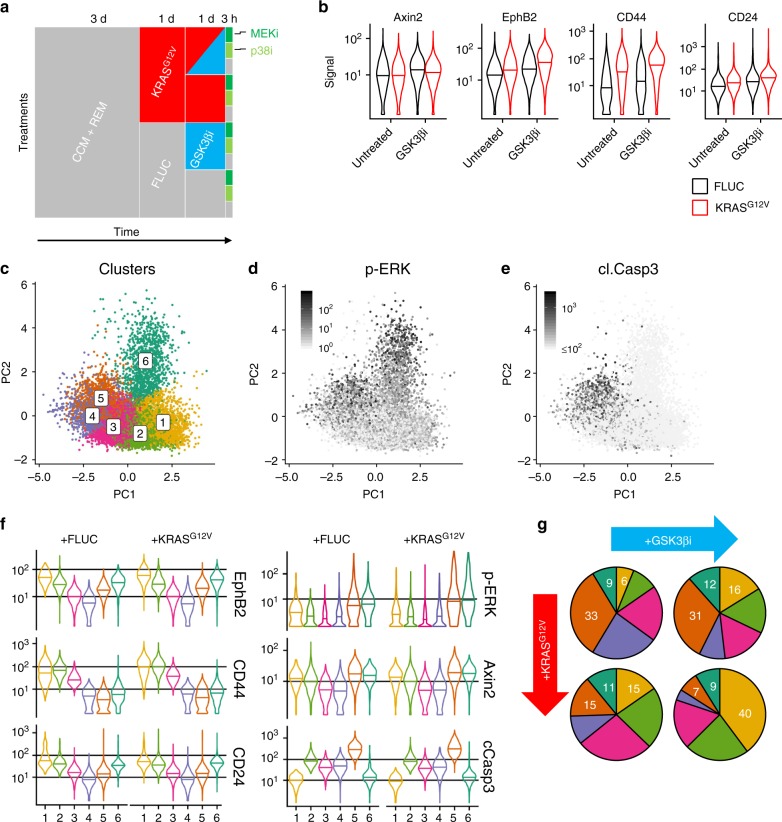
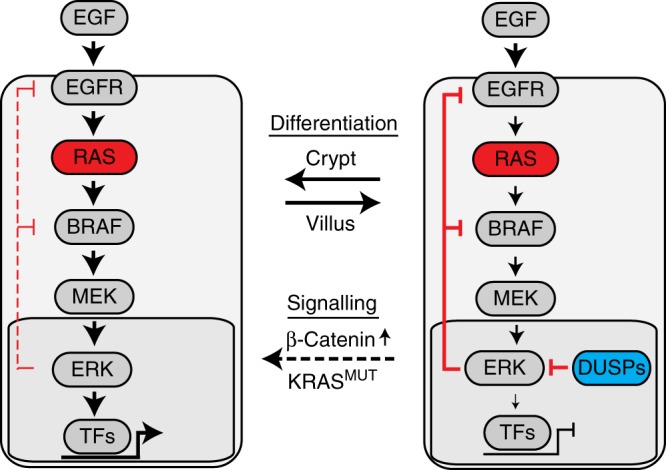
Oncogenic mutations in KRAS or BRAF are frequent in colorectal cancer and activate the ERK kinase. Here, we find graded ERK phosphorylation correlating with cell differentiation in patient-derived colorectal cancer organoids with and without KRAS mutations. Using reporters, single cell transcriptomics and mass cytometry, we observe cell type-specific phosphorylation of ERK in response to transgenic KRASG12V in mouse intestinal organoids, while transgenic BRAFV600E activates ERK in all cells. Quantitative network modelling from perturbation data reveals that activation of ERK is shaped by cell type-specific MEK to ERK feed forward and negative feedback signalling. We identify dual-specificity phosphatases as candidate modulators of ERK in the intestine. Furthermore, we find that oncogenic KRAS, together with β-Catenin, favours expansion of crypt cells with high ERK activity. Our experiments highlight key differences between oncogenic BRAF and KRAS in colorectal cancer and find unexpected heterogeneity in a signalling pathway with fundamental relevance for cancer therapy.


Conflict of interest statement

The authors declare no competing interests.

Figures

Fig. 1
Fig. 1
Graded MEK and ERK phosphorylation in patient-derived organoids. a Haematoxilin-eosin (HE) staining and phospho-MEK and phospho-ERK immunohistochemistry of two PD3D lines OT326 and OT227 that are KRAS-wild-type and KRAS-mutant, respectively. Scale bars denote 100 µm for HE and immunohistochemistry. b CyTOF analysis of PD3Ds. Principal component analyses, colour-coded for EphB2, cleaved Caspase, phospho-MEK and phospho-ERK are shown. Red, yellow and blue colours of the scale represent high, intermediate and low signals, respectively. CyTOF data is available as a Source Data file
Fig. 2
Fig. 2
Transgenic BRAFV600E, but not KRASG12V disrupts organoids due to high ERK activity. a Simplified representations of transgenes and the RAS-ERK and Wnt/β-catenin pathways, indicating relative positions of the KRAS and BRAF proto-oncogenes. b Organoid survival 4 days after induction of oncogenic KRASG12V or BRAFV600E. Organoids are counted immediately after passaging, and fractions of surviving organoids were calculated at day 4. Control organoids comprise of mixed non-induced cultures of KRASG12V and BRAFV600E lines. c Electron microscopy reveals loss of epithelial integrity after BRAFV600E induction. Images of the intestinal organoid epithelium, 24 h after induction of control FLUC, KRASG12V or BRAFV600E transgenes. Detailed views (right) represent a zoom into areas marked by red boxes in the overviews (left). Detailed views show apical surfaces of adjacent enterocytes with brush border. Red arrows mark desmosomes. Intercellular vacuoles, most visible in the KRASG12V model (marked by *) are likely fixation-induced artefacts, see ref. . Scale bars are 10 µm in the overview panels and 500 nm in the detailed view panels. d Quantification of ERK phosphorylation in organoids, 24 h after induction of control, BRAF or KRAS transgenes, using a capillary protein analysis. e Quantification of organoid survival, 4 days after inhibition of EGFR, MEK, ERK and/or induction of BRAFV600E, as in panel (b). Error bars in panels (b), (d) and (e) denote standard deviations. Data shown in panels (b), (d), and (e) are available as a Source Data file
Fig. 3
Fig. 3
Differential effects of BRAFV600E or KRASG12V on gene expression and intestinal cell hierarchies. All panels: t-SNE visualisations and clustering of organoid single-cell transcriptomes clustered with k-means, 24 h after induction of FLUC control, BRAFV600E or KRASG12V transgenes. a Colour code for six k-means clusters, and inferred differentiation trajectories starting at cluster 1 shown as grey overlay. b Colour code for transgene and CD44 positivity, as inferred from flow cytometry. CD44 positivity was used to direct cell selection, and thus relative fractions of CD44-high and -low cells are not representative. For CD44 status of the cell populations, see Supplementary Fig. 2. c Mapping of cell- and pathway-specific differentiation signatures. Numbers of signature genes detected are given per single-cell transcriptome
Fig. 4
Fig. 4
Visualisation of ERK activity by FIRE reveals KRASG12V-responsive cells. a Schematic representation of signalling pathway and reporter. b FIRE activity in wild-type intestinal organoids, in the presence and absence of EGF in the culture medium, as indicated. Asterisk marks isolated FIRE-high villus cell. c Fluorescence microscopy images showing transgene expression (red), FIRE activity (green), and overlays in intestinal organoids, taken 2 days (FLUC, KRAS) or 1 day (BRAF) after transgene induction. Arrow heads mark KRASG12V/FIRE-high crypt cells, asterisk marks FIRE-high villus cell, respectively. d Immunohistochemistry of tdTomato, Ki67 and p-ERK in intestinal organoids, as indicated. In panels (c) and (d), c and v demarcate crypt and villus areas, respectively. Scale bars are 100 µm in all panels
Fig. 5
Fig. 5
Single-cell RNA sequencing reveals KRASG12V-responsive and -unresponsive organoid cells. a Fluorescence-activated cell sort gates for FIRE-negative and -positive cells. b t-SNE visualisation colour-coded for eight clusters identified with k-means clustering. Differentiation trajectories starting at cluster 1 are shown as grey overlay. c t-SNE visualisation displaying colour codes for transgene and FIRE positivity. Filled upward-pointing triangles: FIRE-high; outlined downward-pointing triangles: FIRE-low. Red: KRASG12V; grey: FLUC. d Heatmap of z-transformed signature scores per cell for cluster cell type identification. Signature scores correspond to the number of expressed signature genes per cell normalised to gene detection rate and signature length. Blue: low target gene signature abundance; Red: high target gene signature abundance. Cluster colour codes are given above, and transgene and FIRE positivity codes are given below the heatmap
Fig. 6
Fig. 6
CyTOF analysis reveals KRASG12V- and GSK3β inhibitor-responsive p-ERK high cell clusters. a Schematics for generation of network perturbation data by CyTOF. In short, organoids were established from KRASG12V- and FLUC transgenic mice, induced for transgene expression after 3 days, and treated with GSK3β inhibitor for 1 day and with MEK and p38 inhibitors for 3 h before harvesting. Finally, 12 samples were subjected to multiplexed CyTOF analysis. b Distributions of cell type markers in organoid cells induced for FLUC or KRASG12V transgenes plus/minus GSK3β inhibitor treatment. Central lines of violin plots denote median values. c PCA showing colour code of k-means clustering in KRASG12V-induced cells by EphB2, CD44, CD24, Krt20 and cleaved Caspase 3 signal strength. d, e Mapping of signal strength for p-ERK and cleaved Caspase 3 on PCA, as in (c). f Distribution of EphB2, CD44, CD24, Axin2, p-ERK and cleaved Caspase 3 signals in clusters 1–6, as above. Central lines of violin plots denote median values. g Fractions of cells in clusters 1–6, in organoid cells induced for FLUC or KRASG12V transgenes plus/minus GSK3β inhibitor treatment. Numbers denote percentages of cells in clusters 1, 5, 6. CyTOF data are available as a Source Data file
Fig. 7
Fig. 7
Network quantification identifies cell type-specific differences in KRAS to ERK signalling. a Protein phosphorylation and abundance CyTOF data by treatment and cell clusters, as in Fig. 6c. Log2 fold changes to average untreated FLUC-induced control line are given. b Signalling network structure used for modelling. The network was re-parametrised from a starting network, using the experimental data to remove and add connections, denoted by grey and blue arrows, respectively. c Signalling quantification of identifiable network links using Modular Response Analysis. Numbers 1–5 in panels (b) and (c) show network connections with significant differences between clusters in order of detection. Red circles mark MEK-ERK and ERK-MEK connections identified as having different strengths in clusters with high vs. low ERK phosphorylation after KRASG12V induction. d MRA modelling of differences between KRASG12V-induced and FLUC control cells within each cluster. K and F mark KRASG12V and FLUC control cluster pairs, respectively. Cluster pairs exhibiting KRASG12V-specific differences are shown in red and blue, indicating regulation strengths. e Colour-coded gene expression data from cells sorted by high and low FIRE activity, as indicated. Upper panel shows marker genes (Mki67, encoding Ki67, for proliferative cells, Cd44 and Ephb2 for crypt cells and Kras), lower panel shows 20 significantly regulated genes between the conditions. In total, 269 genes encoding MAPK network components in KEGG were tested. Asterisks indicate dual-specificity phosphatases
Fig. 8
Fig. 8
Model of cell type-specific regulation of ERK activity. ERK is regulated cell type-specific and cell-intrinsic via different strengths of feedback inhibition and feed-forward signalling from MEK to ERK. Dual-specificity phosphatases (DUSPs) are important regulators of ERK activity. β-catenin and KRASG12V activities modulate cell fate decisions towards the generation of cells with high ERK activity, likely in part due to low expression of genes encoding DUSPs

References

    1. Beumer J, Clevers H. Regulation and plasticity of intestinal stem cells during homeostasis and regeneration. Development. 2016;143:3639–3649. doi: 10.1242/dev.133132. - DOI - PubMed
    1. Stelniec-Klotz I, et al. Reverse engineering a hierarchical regulatory network downstream of oncogenic KRAS. Mol. Syst. Biol. 2012;8:601. doi: 10.1038/msb.2012.32. - DOI - PMC - PubMed
    1. Sasaki N, et al. Reg4+deep crypt secretory cells function as epithelial niche for Lgr5+stem cells in colon. Proc. Natl Acad. Sci. USA. 2016;113:E5399–E5407. doi: 10.1073/pnas.1607327113. - DOI - PMC - PubMed
    1. Sato T, et al. Paneth cells constitute the niche for Lgr5 stem cells in intestinal crypts. Nature. 2010;469:415–418. doi: 10.1038/nature09637. - DOI - PMC - PubMed
    1. Pylayeva-Gupta Y, Grabocka E, Bar-Sagi D. RAS oncogenes: weaving a tumorigenic web. Nat. Rev. Cancer. 2011;11:761–774. doi: 10.1038/nrc3106. - DOI - PMC - PubMed

Publication types

MeSH terms

Substances

LinkOut - more resources