

Carotenoids from UV-resistant Antarctic Microbacterium sp. LEMMJ01
- PMID: 31266976
- PMCID: PMC6606617
- DOI: 10.1038/s41598-019-45840-6
Carotenoids from UV-resistant Antarctic Microbacterium sp. LEMMJ01
Abstract
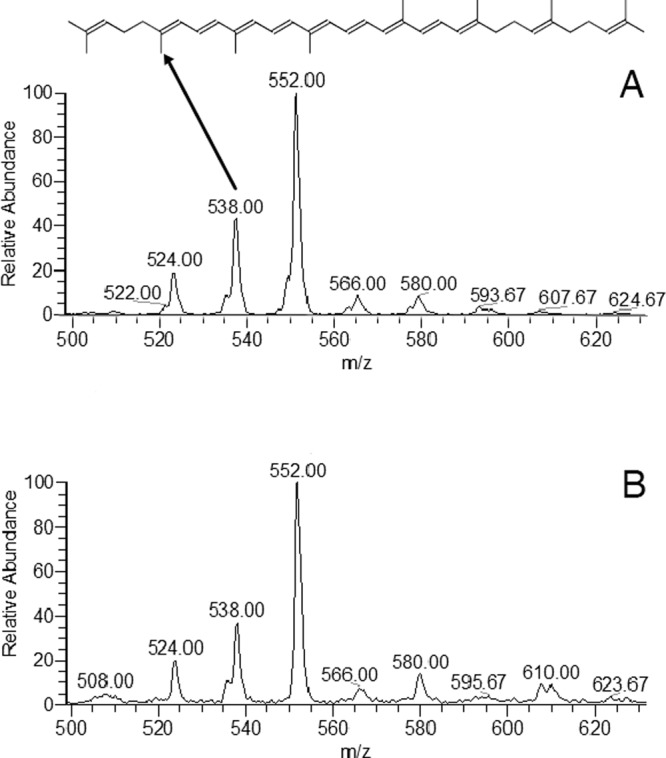
The Microbacterium sp. LEMMJ01 isolated from Antarctic soil does not belong to any of the nearest species identified in the RDP database. Under UV radiation (A, B and C wavebands) the survival fractions of Microbacterium sp. cells were much higher compared with wild-type E. coli K12A15. Especially remarkable for an Antarctic bacterium, an expressive resistance against high UV-B doses was observed. The increased survival of DNA repair-proficient E. coli grown overnight added of 0.1 mg/ml or 1 mg/ml of the whole pigment extract produced by Microbacterium sp. revealed that part of the resistance of Microbacterium sp. against UV-B radiation seems to be connected with photoprotection by its pigments. Scanning electron microscopy revealed that UV-A and UV-B ensued membrane alterations only in E. coli. The APCI-MS fingerprints revealed the diagnostic ions for neurosporene (m/z 580, 566, 522, 538, and 524) synergism for the first time in this bacterium by HPLC-MS/MS analysis. Carotenoids also were devoid of phototoxicity and cytotoxicity effects in mouse cells and in human keratinocytes and fibroblasts.
Conflict of interest statement
The authors declare no competing interests.
Figures

 ) and E. coli K12A15 strain (
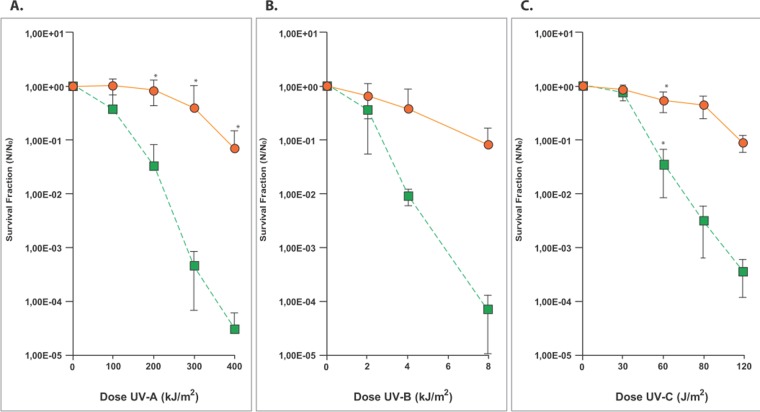
 ) after increasing doses of (A) UV-A (365 nm), (B) UV-B (312 nm) and C. UV-C (254 nm) irradiations. For this, stationary growth phase cultures were normalized at the optical densities (O.D.) of 0.1 and 1 for Microbacterium sp and E. coli, respectively. The suspensions of Microbacterium sp. isolate LEMMJ01 and E. coli K12A15 strain were exposed to UV-A at a dose rate of 40 W/m2, UV-B at 15 W/m2 and UV-C at 2.5 W/m2. Aliquots were withdrawn at different times and plated to determine survival. The asterisks represent a significant difference (p < 0.005) between the survival of Microbacterium sp. LEMMJ01 and E. coli K12A15 after each radiation dose, as assessed by the Student’s t-test. Error bars represent the standard deviation of the counts of at least three independent experiments.
 ) grown overnight in LB medium, with added concentrations of 0.1 mg/ml (
 ) and 1 mg/ml (
 ) of the pigment produced by Microbacterium sp. LEMMJ01 (
 ). To compare the resistance between the two bacterial species with or without the pigment produced by Microbacterium sp. against UV-B radiation. Stationary growth phase cultures were irradiated with increasing doses of UV-B (312 nm) and aliquots were withdrawn at different times and plated to determine survival. The asterisks represent a significant difference (P < 0.005) between the survival of E. coli with and without pigment after the dose of UV-B irradiation as assessed by Student’s t-test. Error bars represent the standard deviation of the counts of at least three independent experiments.
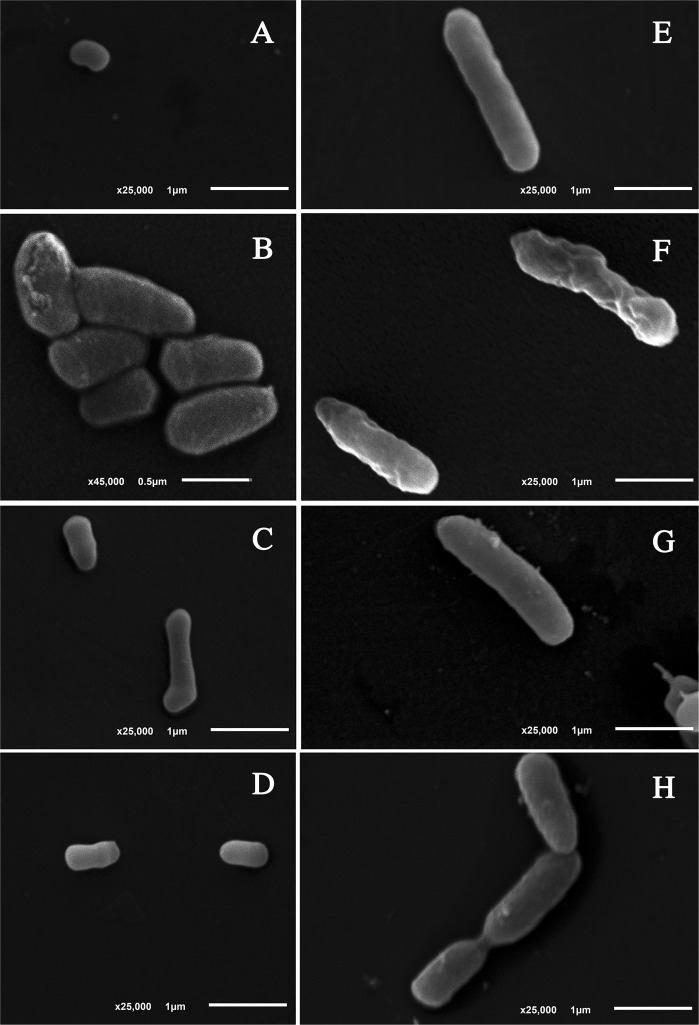


References
-
- Dieser M, Greenwood M, Foreman CM. Carotenoid Pigmentation in Antarctic Heterotrophic Bacteria as a Strategy to Withstand Environmental Stresses. Arct. Antarct. Alp. Res. 2010;42:396–405. doi: 10.1657/1938-4246-42.4.396. - DOI
Publication types
MeSH terms
Substances
LinkOut - more resources
Full Text Sources
Research Materials
