. 2019 Aug;46(4):4369-4375.
doi: 10.1007/s11033-019-04890-9. Epub 2019 Jul 2.

High frequency electrical stimulation promotes expression of extracellular matrix proteins from human astrocytes

Affiliations

High frequency electrical stimulation promotes expression of extracellular matrix proteins from human astrocytes

Jin Sung Jang et al. Mol Biol Rep. 2019 Aug.

Abstract

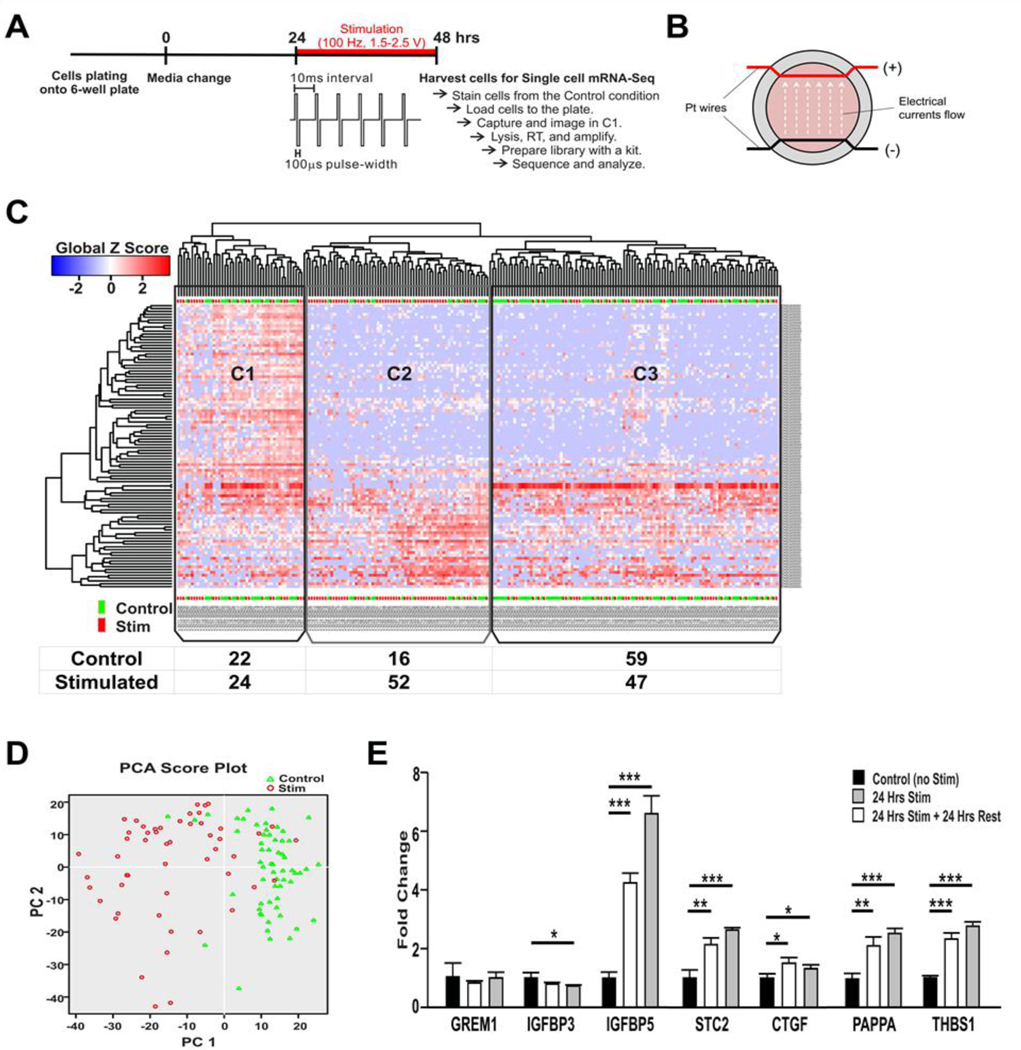
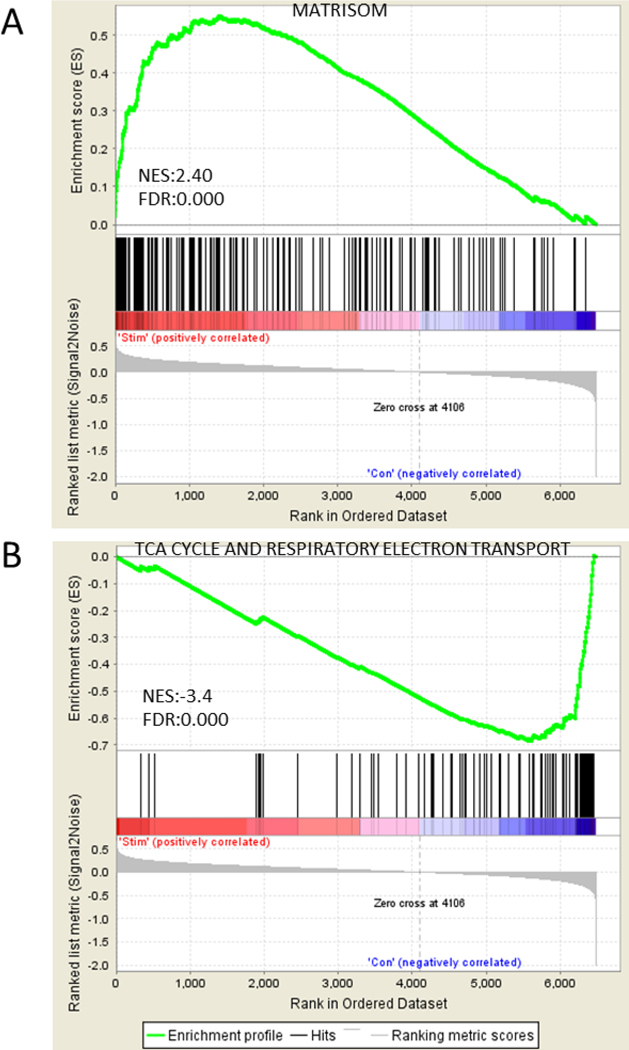
Therapeutic benefits of deep brain stimulation (DBS), a neurosurgical treatment for certain movement disorders and other neurologic conditions, are well documented, but DBS mechanisms remain largely unexplained. DBS is thought to modulate pathological neural activity. However, although astrocytes, the most numerous cell type in the brain, play a significant role in neurotransmission, chemical homeostasis and synaptic plasticity, their role in DBS has not been fully examined. To investigate astrocytic function in DBS, we applied DBS-like high frequency electrical stimulation for 24 h to human astrocytes in vitro and analyzed single cell transcriptome mRNA profile. We found that DBS-like high frequency stimulation negatively impacts astrocyte metabolism and promotes the release of extracellular matrix (matricellular) proteins, including IGFBP3, GREM1, IGFBP5, THBS1, and PAPPA. Our results suggest that astrocytes are involved in the long-term modulation of extra cellular matrix environments and that they may influence persistent cell-to-cell interaction and help maintain neuromodulation over time.

Keywords: Astrocyte; Deep brain stimulation; Extracellular matrix; Matricellular protein; Single cell transcriptome.


Figures

Figure 1.
Figure 1.
Identification of the effect of HFS on cultured human astrocytes using single cell RNA-Seq and verification of the single cell analysis using qRT-PCR. (A) Experimental design. Culture media was changed one day before the stimulation. HFS (100 Hz, 100 μsec pulse width, 1.5–2.5 V) was applied for 24 hrs. (B) Schematic of the stimulation device. A pair of platinum wires were placed in parallel through the entire chamber of a 6-well plate. The wire was coated with silicon, and only the part across the wall was exposed. The bare wire nearly touched the bottom of the culture plate and the media fully covered the wire. (C) Heatmap of expression (Global Z-score) obtained by unsupervised two dimensional hierarchical clustering analysis using the most significant 100 genes. According to the gene expression profile, three clusters were identified. In C1, cells from both stimulated and control groups were evenly distributed. Cells in C2 and C3 were mainly from the stimulated and the control groups, respectively. (D) Principal component analysis (PCA) plot using all expressed genes of 111 cells (52 stimulated cells identified in C2 and 59 control cells identified in C3). PCA confirmed that gene expression profiling modulated by stimulation is strong enough to divide cells into two groups (stimulated vs. control). (E) qPCR assay to verify the data obtained by scRNA-Seq. Nine candidate genes were identified and confirmed by qPCR assay independently (***, p<0.001. **, p<0.01, *, p<0.05). Abbreviaions: GREM1, gremlin1; IGFBP, insulin like growth factor binding protein; CYR61, cysteine rich angiogenic inducer 61 (has been identified as CTGF-2 and also IGFBP10); STC2, stanniocalcin2; CTGF, connective tissue growth factor (has been identified as IGFBP8); TGFB2, Transforming growth factor beta 2; PAPPA, pregnancy-associated plasma protein A; THBS1, thrombospondin1.
Figure 2.
Figure 2.
The representative enrichment plots for the gene sets of both stimulated and control groups by GSEA. (A) Matrisom gene set was significantly enriched positively in the stimulated group. (B) TCA cycle and respiratory electron transport gene set was significantly enriched negatively in the control group. Top of enrichment plot, the running enrichment score for the gene set as the analysis walks down the ranked list. Middle of enrichment plot, the location of genes from the each gene set within the ranked list. Bottom of enrichment plot, plot of the ranked list of 6483 genes. Y axis, value of the ranking metric; X axis, the rank for 6483 genes. NES, Normalized enrichment score. FDR, false discovery rate.

References

    1. Abreu JG, Ketpura NI, Reversade B, De Robertis EM (2002) Connective-tissue growth factor (CTGF) modulates cell signalling by BMP and TGF-beta. Nat Cell Biol 4:599–604. - PMC - PubMed
    1. Barron M, Li J (2016) Identifying and removing the cell-cycle effect from single-cell RNA-Sequencing data. Sci Rep 6:33892. - PMC - PubMed
    1. Basso M, Berlin J, Xia L, Sleiman SF, Ko B, Haskew-Layton R, Kim E, Antonyak MA, Cerione RA, Iismaa SE, Willis D, Cho S, Ratan RR (2012) Transglutaminase inhibition protects against oxidative stress-induced neuronal death downstream of pathological ERK activation. J Neurosci 32:6561–6569. - PMC - PubMed
    1. Bekar L, Libionka W, Tian GF, Xu Q, Torres A, Wang X, Lovatt D, Williams E, Takano T, Schnermann J, Bakos R, Nedergaard M (2008) Adenosine is crucial for deep brain stimulation-mediated attenuation of tremor. Nat Med 14:75–80. - PubMed
    1. Benabid AL, Pollak P, Louveau A, Henry S, de Rougemont J (1987) Combined (thalamotomy and stimulation) stereotactic surgery of the VIM thalamic nucleus for bilateral Parkinson disease. Appl Neurophysiol 50:344–346. - PubMed

Substances

LinkOut - more resources