

GSTZ1-1 Deficiency Activates NRF2/IGF1R Axis in HCC via Accumulation of Oncometabolite Succinylacetone
- PMID: 31267557
- PMCID: PMC6669923
- DOI: 10.15252/embj.2019101964
GSTZ1-1 Deficiency Activates NRF2/IGF1R Axis in HCC via Accumulation of Oncometabolite Succinylacetone
Abstract
The IGF1R signaling is important in the malignant progression of cancer. However, overexpression of IGF1R has not been properly assessed in HCC. Here, we revealed that GSTZ1-1, the enzyme in phenylalanine/tyrosine catabolism, is downregulated in HCC, and its expression was negatively correlated with IGF1R. Mechanistically, GSTZ1-1 deficiency led to succinylacetone accumulation, alkylation modification of KEAP1, and NRF2 activation, thus promoting IGF1R transcription by recruiting SP1 to its promoter. Moreover, inhibition of IGF1R or NRF2 significantly inhibited tumor-promoting effects of GSTZ1 knockout in vivo. These findings establish succinylacetone as an oncometabolite, and GSTZ1-1 as an important tumor suppressor by inhibiting NRF2/IGF1R axis in HCC. Targeting NRF2 or IGF1R may be a promising treatment approach for this subset HCC.
Keywords: GSTZ1-1; IGF1R; KEAP1; NRF2; succinylacetone.
© 2019 The Authors. Published under the terms of the CC BY 4.0 license.
Conflict of interest statement
The authors declare that they have no conflict of interest.
Figures

- A
GSTZ1 mRNA expression in HCC and paired non‐tumor tissues from The Cancer Genome Atlas (TCGA) Liver Hepatocellular Carcinoma (LIHC) dataset.
- B
GSTZ1 mRNA expression in increasing pathologic stages of HCC based on data from TCGA database. The box‐and‐whisker plots display the medians (horizontal lines), interquartile ranges (boxes), and minimum and maximum values (whiskers) of the mRNA expression data. The n indicates the number of samples.
- C
Overall survival of HCC patients with high (> 25 percentile) or low (≤ 25 percentile) mRNA expression of GSTZ1‐1, based on TCGA data.
- D, E
GSTZ1 mRNA (D) and protein (E) expression in 40 cases of HCC and paired non‐tumor tissues.
- F
Representative images (left) and quantification (right) of GSTZ1‐1 immunohistochemical staining in 12 cases of HCC and paired non‐tumor tissues. Scale bars: 100 μm.

- A
Western blotting shows endogenous GSTZ1‐1 protein expression in HCC cell lines and MIHA cells.
- B
Overexpression of GSTZ1‐1 in Huh7 (left) and SK‐Hep1 (middle) cells and knockout of GSTZ1 in HepG2 (right) cells were confirmed by immunoblot assay. The GSTZ1‐1‐overexpressing (GSTZ1‐OE) cell model was established by infecting hepatoma cells with adenoviruses expressing GSTZ1‐1 (AdGSTZ1). Adenoviruses expressing green fluorescent protein (AdGFP) were used as a control. The GSTZ1 knockout (GSTZ1‐KO) cell model was established using the CRISPR/Cas9 system.
- C–E
Proliferation ability of GSTZ1‐OE Huh7 and SK‐Hep1 cells, and GSTZ1‐KO HepG2 cells. (C) Representative images (left) and quantification (right) of EdU‐positive cells. Scale bars: 50 μm. (D) Cell growth curves. (E) Representative images (left) and quantification (right) of colony formation capacity. Values are shown as means ± SD (n = 3), *P < 0.05, **P < 0.01, ***P < 0.001, Student's t‐test (two groups) or one‐way ANOVA followed by the Tukey test (more than two groups). Abbreviations: DAPI, 4′,6‐diamidino‐2‐phenylindole; EdU, 5‐ethynyl‐2′‐deoxyuridine.
- A
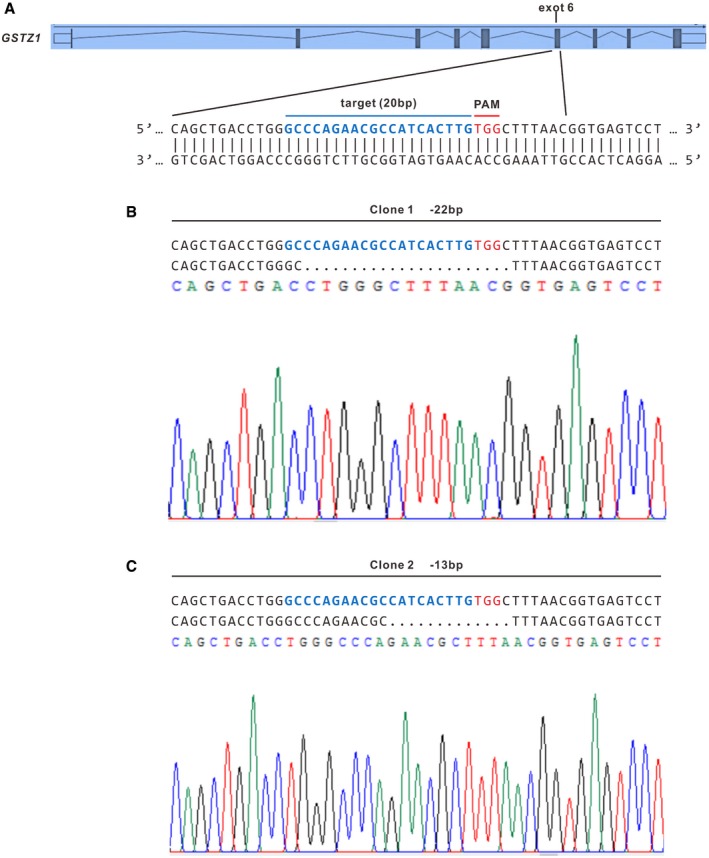
Schematic representation of GSTZ1 locus with the targeting sequence (blue) of small guide RNA (sgRNA) and the protospacer adjacent motif (PAM) (red).
- B, C
Indel mutations of GSTZ1 from two single‐cell clones identified by sequencing. Dashes represent deleted bases.

Representative images of tumor‐bearing nude mice. The dotted circles indicate the location and mass of tumor implants.
Tumor growth curves.
Tumor weights assessed after sacrifice.
- A
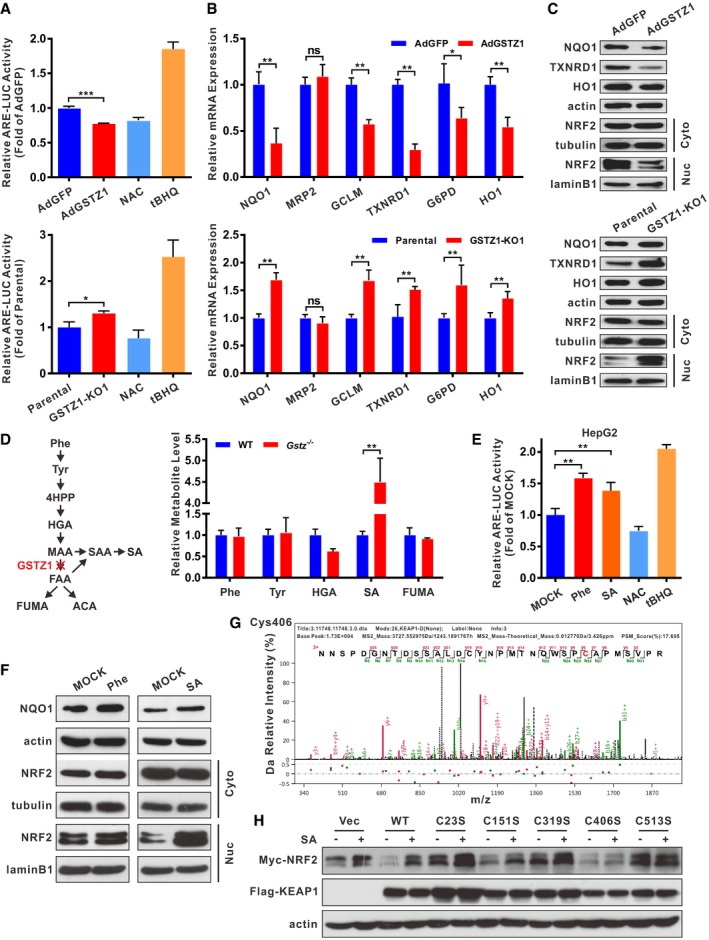
Luciferase (LUC) activity of ARE promoter in GSTZ1‐1‐overexpressing (GSTZ1‐OE) Huh7 cells (top) and GSTZ1 knockout (GSTZ1‐KO) HepG2 cells (bottom). The antioxidant N‐acetylcysteine (NAC, 20 mM for 12 h) and the NRF2 activator tertiary butylhydroquinone (tBHQ, 40 μM for 3 h) were used as negative and positive controls, respectively.
- B, C
Relative mRNA (B) and protein (C) expression of NRF2 downstream target genes (such as NQO1, TXNRD1, and HO1), and cytoplasmic (Cyto) and nuclear (Nuc) expression of NRF2 (C) in GSTZ1‐OE Huh7 cells (top) and GSTZ1‐KO HepG2 cells (bottom).
- D
Phenylalanine and tyrosine (Phe/Tyr) catabolic pathway (left) and relative levels of metabolites in tyrosine catabolism in murine liver as measured by mass spectrometry (right).
- E
LUC activity of ARE promoter in HepG2 cells treated with Phe (2.0 mM) and succinylacetone (SA, 200 μΜ) for 36 h. NAC and tBHQ were described as above.
- F
Western blotting shows NQO1 expression and cytoplasmic and nuclear expression of NRF2 in HepG2 cells treated with Phe (2.0 mM, left) and SA (200 μM, right) for 48 h.
- G
SA alkylation of human KEAP1 cysteine residues on Cys406 was identified in GSTZ1‐KO HepG2 cells infected with adenoviruses expressing KEAP1 (AdKEAP1) by MS/MS analysis.
- H
Western blotting shows NRF2 and KEAP1 expression in HepG2 cells cotransfected with NRF2‐Myc and wild‐type (WT) or mutant KEAP1 (C23S, C151, C319S, C406S, or C513S).

Representative images of NRF2 immunofluorescence in GSTZ1‐1‐overexpressing Huh7 cells. Scale bars: 20 μm.
Western blotting shows NQO1 expression and cytoplasmic and nuclear expression of NRF2 in liver tissues from wild‐type (WT) and Gstz1 −/− mice.
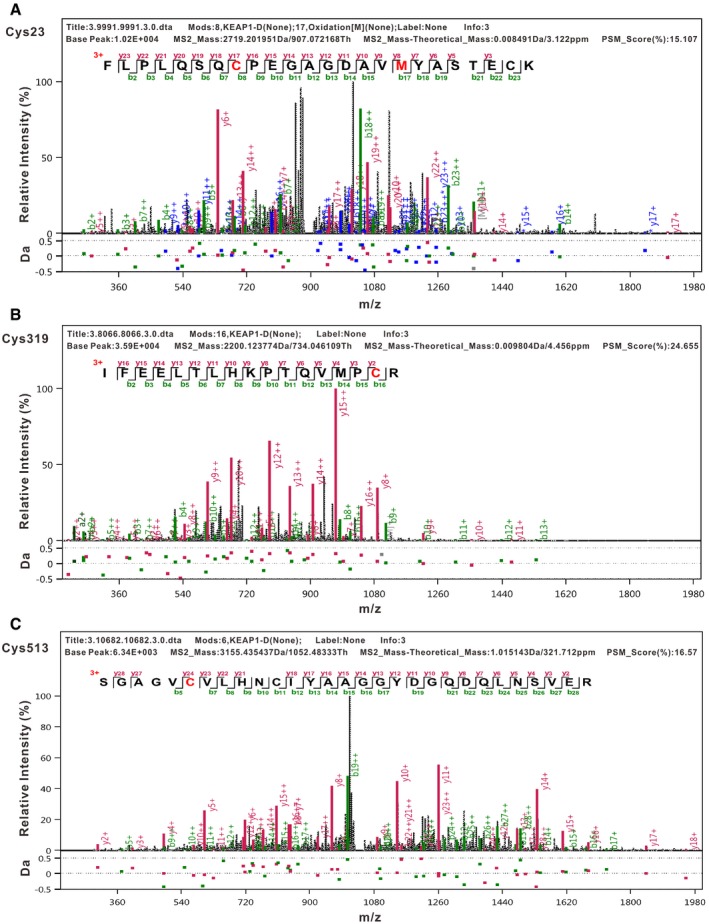
- A–C
Tandem mass spectrometry (UPLC‐MS/MS) analysis of immunoprecipitated kelch‐like ECH‐associated protein 1 (KEAP1) identified succinylacetone (SA) modification at residues Cys23 (A), Cys319 (B), and Cys513 (C).

- A
Volcano plot of RNA‐sequencing data obtained using GSTZ1‐1‐overexpressing (GSTZ1‐OE) Huh7 cells (fold change > 1.5 or < 0.667, FDR < 0.05, n = 512).
- B, C
IGF1R mRNA (B) and protein (C) expression in GSTZ1‐OE Huh7 (left) and GSTZ1 knockout HepG2 (right) cells.
- D
Correlation analysis of GSTZ1 and IGF1R mRNA expression was conducted using data from 363 patients with HCC included in TCGA LIHC dataset (left) and 30 cases of HCC and paired non‐tumor tissues (right).
- E
Western blotting shows GSTZ1‐1 and IGF1Rβ expression in HCC and paired non‐tumor tissues (n = 12).
- F
Representative images of GSTZ1‐1 and corresponding IGF1Rβ immunohistochemical labeling in HCC and paired non‐tumor tissues. Scale bars: 200 μm.

- A, B
Proliferation ability of GSTZ1 knockout (GSTZ1‐KO) HepG2 cells treated with or without different doses of picropodophyllin (PPP, 0.5 μM and 1.0 μM) for 24 h. (A) Cell growth curves. (B) Representative images (left) and quantification (right) were obtained by EdU incorporation assays. Scale bars: 50 μm.
- C
Flow cytometry detection of apoptosis, conducted using Annexin V–FITC/PI double staining and quantification, shows early apoptotic cells in GSTZ1‐OE Huh7 (top) and GSTZ1‐KO HepG2 (bottom) cells. GSTZ1‐KO cells were treated with PPP as described above.
- D, E
Heat map of RNA‐sequencing data (described in Fig 4) (D) and quantitative RT–PCR (E) show the differential expression of downstream signaling molecules and apoptosis‐associated genes in IGF1R‐mediated antiapoptotic pathway. The asterisks indicate statistically significant differences between AdGSTZ1 and AdGFP.
- F, G
Expression of IGF1R downstream signaling molecules (F) and apoptosis‐associated proteins (G) in GSTZ1‐OE Huh7 (left) and GSTZ1‐KO HepG2 (middle, right) cells. GSTZ1‐KO cells were treated with or without PPP (1.0 μM) for 24 h (middle) and transfected with control (shCon) or IGF1R shRNA (shIGF1R) (right). All cells were treated with (F) or without (G) IGF‐1 (Beyotime, 50 ng/ml) for 1 h after serum starvation overnight.
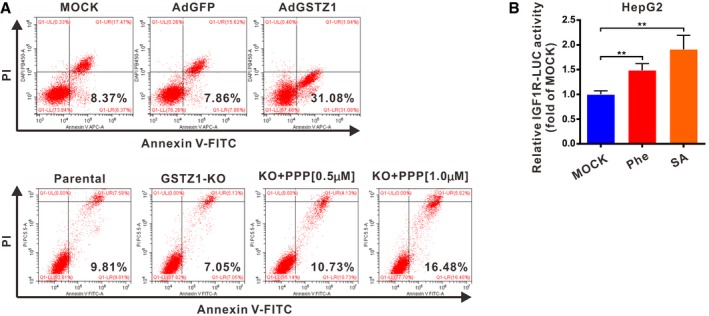
Flow cytometry detection of apoptosis, conducted using Annexin V–FITC/PI double staining in GSTZ1‐1‐overexpressing (GSTZ1‐OE) Huh7 (top) and GSTZ1 knockout (GSTZ1‐KO) HepG2 (bottom) cells. GSTZ1‐KO cells were treated with or without different doses of PPP (0.5 μM and 1.0 μM) for 24 h.
Luciferase activity of human IGF1R promoter in HepG2 cells treated with Phe (2.0 mM) and SA (200 μΜ) for 36 h. Values are shown as means ± SD (n = 3), **P < 0.01, one‐way ANOVA followed by the Tukey test.

- A–C
Luciferase (LUC) activity of the human IGF1R promoter (left) and expression of NRF2 and IGF1Rβ (right) in GSTZ1 knockout (GSTZ1‐KO) HepG2 and GSTZ1‐1‐overexpressing (GSTZ1‐OE) Huh7 cells. GSTZ1‐KO cells were treated with or without brusatol (Bru, 40 nM) for 24 h (A) and transfected with pSEB‐Vector or pSEB‐Keap1 (B) GSTZ1‐OE cells were treated with or without tertiary butylhydroquinone (tBHQ, 40 μM) for 3 h (C).
- D
Co‐immunoprecipitation assay shows NRF2–SP1 interactions in MHCC‐97H cells.
- E
Chromatin immunoprecipitation assay was conducted using extracts of MHCC‐97H cells treated with or without Bru (40 nM) for 24 h (left), and with or without tBHQ (40 μM) for 3 h (right). IgG and anti‐Histone H3 (H3) were used as negative and positive controls, respectively.
- F
Expression of IGF1Rβ and NRF2 in HepG2 cells treated with phenylalanine (Phe, 0, 0.5, 1.0, 2.0, and 4.0 mM, top) and succinylacetone (SA, 0, 50, 100, 200, and 500 μM, bottom) for 48 h, as assessed by Western blotting.
- G
Chromatin immunoprecipitation assay of extracts from MHCC‐97H cells treated with or without Phe (2.0 mM, left) and SA (200 μM, right) for 48 h; IgG and anti‐Histone H3 were described as above.
- H
IGF1Rβ expression in HepG2 cells treated with Phe (2.0 mM, top) and SA (200 μM, bottom) for 48 h, then respectively added 2‐(2‐nitro‐4‐trifluoromethylbenzoyl)‐1,3‐cyclohexanedione (NTBC, 0, 4, 7, 14, 28 μg/ml) for the last 12 h.
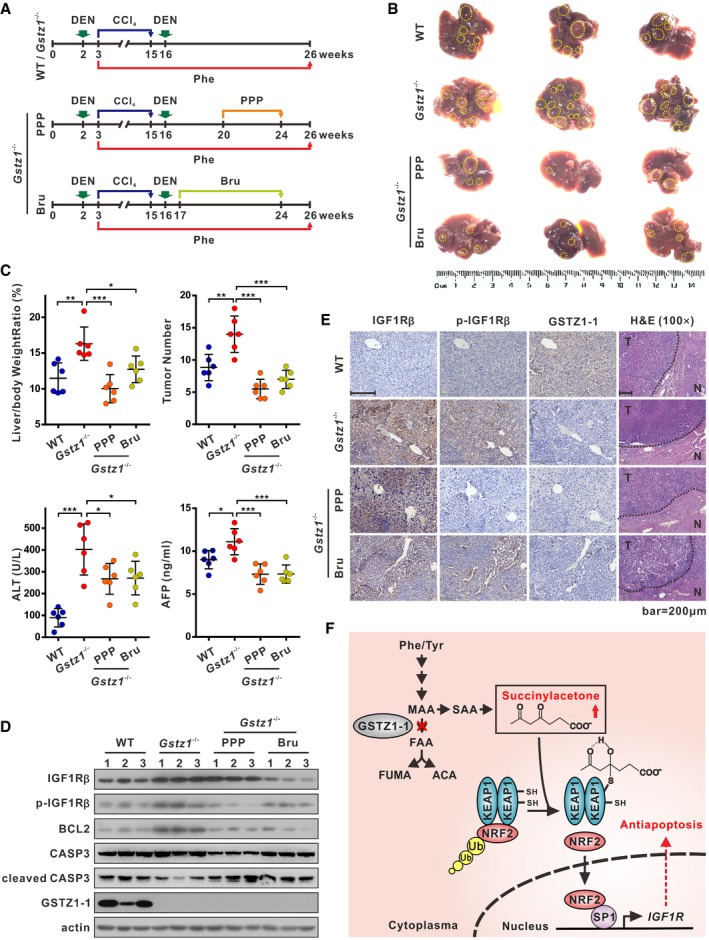
Schematics showing experimental design for procedures involving wild‐type (WT) and Gstz1 −/− mice.
Gross appearances of liver with tumors. The yellow dotted‐line circles represent tumors.
Liver/body weight ratio (top left), tumor numbers (top right), and serum alanine aminotransferase (ALT) (bottom left) and alpha‐fetoprotein (AFP) (bottom right) levels of the four groups.
Protein expression of IGF1Rβ, phospho (Tyr1131)‐IGF1Rβ, B cell lymphoma/leukemia‐2 protein (BCL2), and caspase 3 (CASP3) in four groups of liver tumors as assessed by Western blotting.
Representative images of GSTZ1‐1, and corresponding IGF1Rβ and phospho (Tyr1161)‐IGF1Rβ immunohistochemical labeling, and H&E staining in liver tumors. Scale bars: 200 μm.
A proposed model of activation of the NRF2/IGF1R axis in HCC.
Similar articles
-
GSTZ1 deficiency promotes hepatocellular carcinoma proliferation via activation of the KEAP1/NRF2 pathway.J Exp Clin Cancer Res. 2019 Oct 30;38(1):438. doi: 10.1186/s13046-019-1459-6. J Exp Clin Cancer Res. 2019. PMID: 31666108 Free PMC article.
-
SLC27A5 deficiency activates NRF2/TXNRD1 pathway by increased lipid peroxidation in HCC.Cell Death Differ. 2020 Mar;27(3):1086-1104. doi: 10.1038/s41418-019-0399-1. Epub 2019 Jul 31. Cell Death Differ. 2020. PMID: 31367013 Free PMC article.
-
GSTZ1 sensitizes hepatocellular carcinoma cells to sorafenib-induced ferroptosis via inhibition of NRF2/GPX4 axis.Cell Death Dis. 2021 Apr 30;12(5):426. doi: 10.1038/s41419-021-03718-4. Cell Death Dis. 2021. PMID: 33931597 Free PMC article.
-
Molecular Mechanisms Underlying Hepatocellular Carcinoma Induction by Aberrant NRF2 Activation-Mediated Transcription Networks: Interaction of NRF2-KEAP1 Controls the Fate of Hepatocarcinogenesis.Int J Mol Sci. 2020 Jul 29;21(15):5378. doi: 10.3390/ijms21155378. Int J Mol Sci. 2020. PMID: 32751080 Free PMC article. Review.
-
Regulation and role of nuclear factor-E2-related factor 2 (Nrf2) in multidrug resistance of hepatocellular carcinoma.Chem Biol Interact. 2018 Jan 25;280:70-76. doi: 10.1016/j.cbi.2017.12.014. Epub 2017 Dec 6. Chem Biol Interact. 2018. PMID: 29223570 Review.
Cited by
-
The NRF2, Thioredoxin, and Glutathione System in Tumorigenesis and Anticancer Therapies.Antioxidants (Basel). 2020 Nov 19;9(11):1151. doi: 10.3390/antiox9111151. Antioxidants (Basel). 2020. PMID: 33228209 Free PMC article. Review.
-
CircATP5SL promotes infantile haemangiomas progression via IGF1R regulation by targeting miR-873-5p.Am J Transl Res. 2021 Mar 15;13(3):1322-1336. eCollection 2021. Am J Transl Res. 2021. PMID: 33841659 Free PMC article.
-
Uncovering the Mechanism of the Effects of Pien-Tze-Huang on Liver Cancer Using Network Pharmacology and Molecular Docking.Evid Based Complement Alternat Med. 2020 Sep 7;2020:4863015. doi: 10.1155/2020/4863015. eCollection 2020. Evid Based Complement Alternat Med. 2020. PMID: 32963562 Free PMC article.
-
Nrf2 in Neoplastic and Non-Neoplastic Liver Diseases.Cancers (Basel). 2020 Oct 12;12(10):2932. doi: 10.3390/cancers12102932. Cancers (Basel). 2020. PMID: 33053665 Free PMC article. Review.
-
Deficiency of gluconeogenic enzyme PCK1 promotes metabolic-associated fatty liver disease through PI3K/AKT/PDGF axis activation in male mice.Nat Commun. 2023 Mar 14;14(1):1402. doi: 10.1038/s41467-023-37142-3. Nat Commun. 2023. PMID: 36918564 Free PMC article.
References
-
- Adam J, Hatipoglu E, O'Flaherty L, Ternette N, Sahgal N, Lockstone H, Baban D, Nye E, Stamp GW, Wolhuter K et al (2011) Renal cyst formation in Fh1‐deficient mice is independent of the Hif/Phd pathway: roles for fumarate in KEAP1 succination and Nrf2 signaling. Cancer Cell 20: 524–537 - PMC - PubMed
-
- Aleem E, Nehrbass D, Klimek F, Mayer D, Bannasch P (2011) Upregulation of the insulin receptor and type I insulin‐like growth factor receptor are early events in hepatocarcinogenesis. Toxicol Pathol 39: 524–543 - PubMed
-
- Ammini CV, Stacpoole PW (2003) Biotransformation, toxicology and pharmacogenomics of dichloroacetate In Natural Production of Organohalogen Compounds. The Handbook of Environmental Chemistry, Gribble G. (ed.), pp 215–234. Berlin, Germany: Springer.
Publication types
MeSH terms
Substances
Associated data
- Actions
Grants and funding
- 81872270/The China National Natural Science Foundation/International
- 81572683/The China National Natural Science Foundation/International
- 81661148057/The China National Natural Science Foundation/International
- 81602417/The China National Natural Science Foundation/International
- 2017ZX10202203-004/The Major National S&T program/International
- cstc2018jcyjAX0254/Natural Science Foundation Project of CQ CSTC/International
- CXTDX201601015/Program for Innovation Team of Higher Education in Chongqing/International
- CSTCCXLJRC201719/Leading Talent Program of CQ CSTC/International
- CYB17119/Scientific Research Innovation Project for Postgraduate in Chongqing/International
- BJRC201704/Talent Development Program of CQMU for Postgraduate/International
LinkOut - more resources
Full Text Sources
Medical
Molecular Biology Databases
