

Proteomic identification of a marker signature for MAPKi resistance in melanoma
- PMID: 31267558
- PMCID: PMC6669927
- DOI: 10.15252/embj.201695874
Proteomic identification of a marker signature for MAPKi resistance in melanoma
Abstract
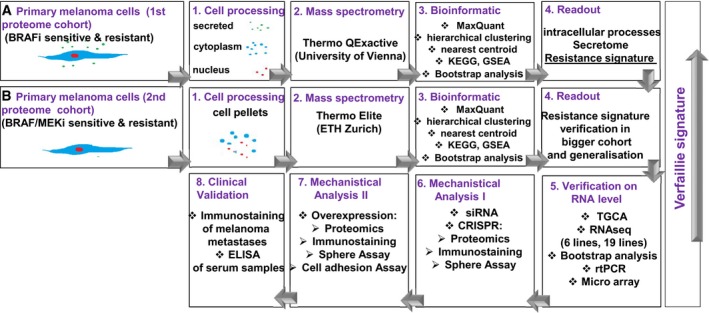
MAPK inhibitors (MAPKi) show outstanding clinical response rates in melanoma patients harbouring BRAF mutations, but resistance is common. The ability of melanoma cells to switch from melanocytic to mesenchymal phenotypes appears to be associated with therapeutic resistance. High-throughput, subcellular proteome analyses and RNAseq on two panels of primary melanoma cells that were either sensitive or resistant to MAPKi revealed that only 15 proteins were sufficient to distinguish between these phenotypes. The two proteins with the highest discriminatory power were PTRF and IGFBP7, which were both highly upregulated in the mesenchymal-resistant cells. Proteomic analysis of CRISPR/Cas-derived PTRF knockouts revealed targets involved in lysosomal activation, endocytosis, pH regulation, EMT, TGFβ signalling and cell migration and adhesion, as well as a significantly reduced invasive index and ability to form spheres in 3D culture. Overexpression of PTRF led to MAPKi resistance, increased cell adhesion and sphere formation. In addition, immunohistochemistry of patient samples showed that PTRF expression levels were a significant biomarker of poor progression-free survival, and IGFBP7 levels in patient sera were shown to be higher after relapse.
Keywords: BRAF; PTRF; mass spectrometry; melanoma; resistance.
© 2019 The Authors.
Conflict of interest statement
The authors declare that they have no conflict of interest.
Figures
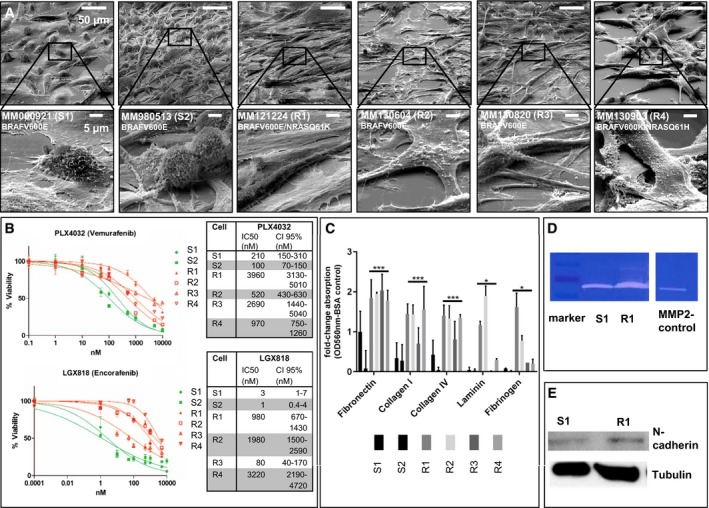
EM image of S1, S2 and R1–4, Ruler: 50 μM, 5 μM (below).
IC50 values to PLX4032 and LGX818 of S1, S2 and R1–4. For each cell culture and targeted therapy, we performed the viability analysis in triplicates (n = 3) and depicted the mean values of each concentration (±SD). The normalized data were merged, and the average IC50 was calculated using GraphPad Prism software. We show the 95% confident interval (CI95%) as a measurement of data distribution around the IC50 value of each cell culture.
Cell adhesion assay of S1, S2 and R1–4, ECM‐mediated cell adhesion was quantified at OD 560 nm after extraction. Each bar graph represents the mean of two independent experiments for each cell culture (±SD). We performed a one‐tailed unpaired Student's t‐test to analyse significance of two groups (sensitive versus resistant cell cultures) (*< 0.05; ***< 0.005).
Zymography assay of S1, R1, M (marker) and MMP2 C (MMP2‐positive control).
Western blotting of N‐cadherin of S1 and R1; tubulin serves as a positive control.
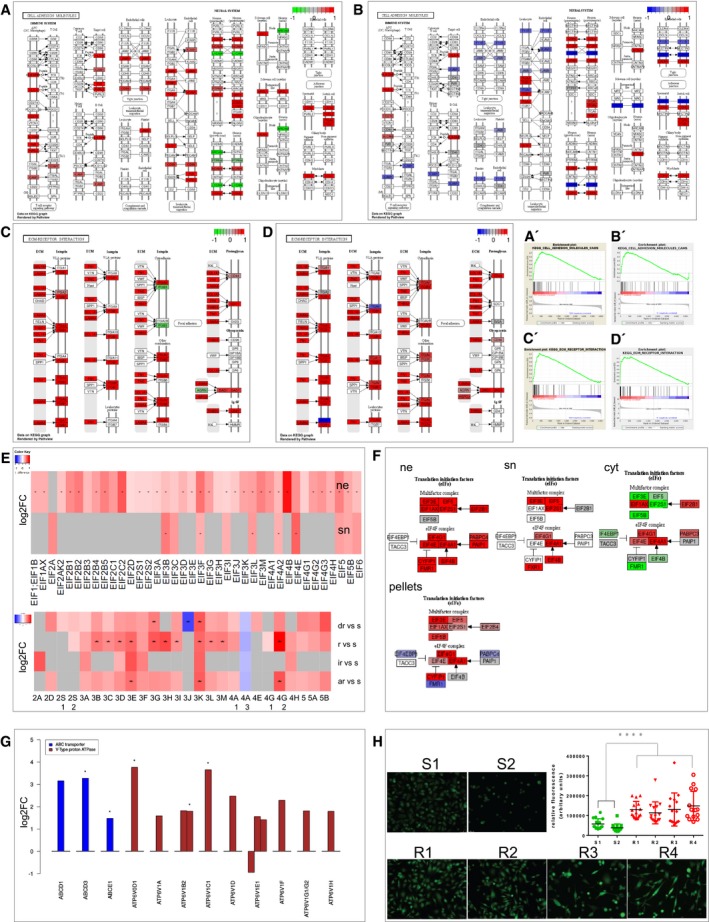
Cell adhesion molecules 1st proteome cohort.
Cell adhesion molecules 2nd proteome cohort.
ECM receptor interaction in the 1st proteome cohort.
ECM receptor interaction in the 2nd proteome cohort is highly enriched and upregulated as visualized KEGG pathway visualization and by GSEA (A′–D′) of the two cell culture cohorts.
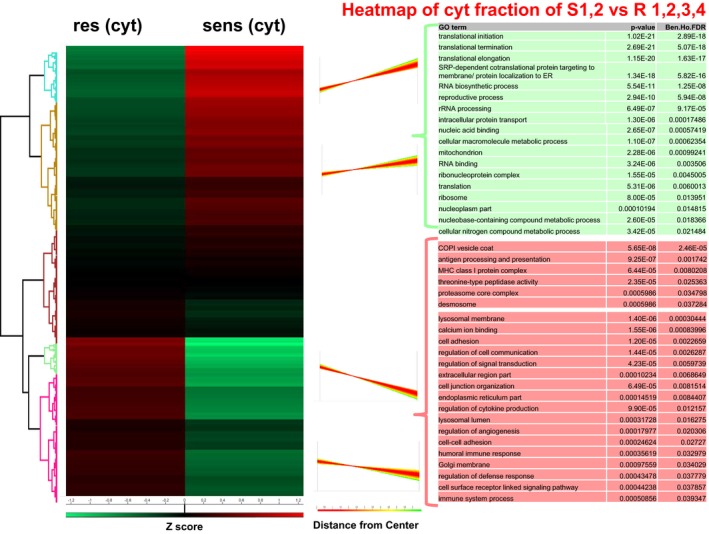
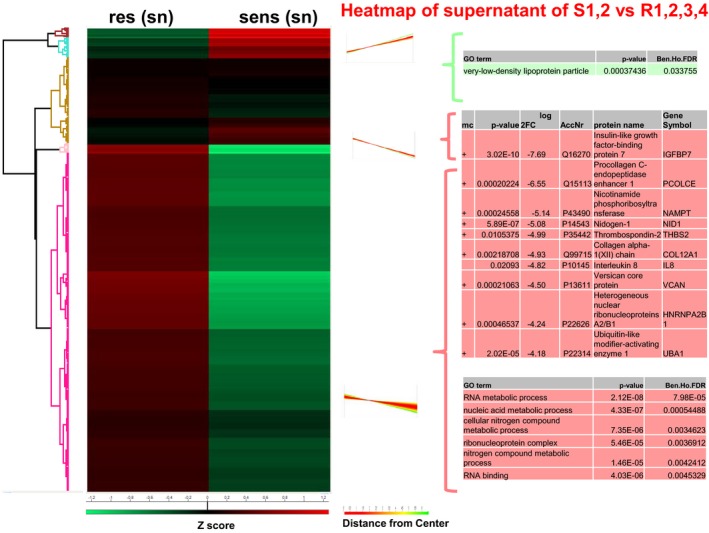
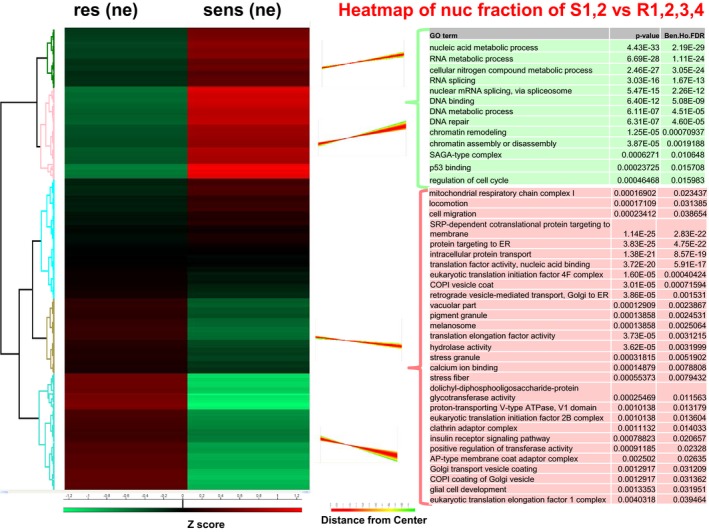
Heatmap of significant regulated EIFs in ne (nucleus) and sn (supernatant), pellets. red: upregulated in resistant cells, grey: not identified, * multiparameter correction, s, sensitive; dr, double resistant; r, BRAF resistant; ir, intrinsic resistant; ar, all resistant; vs, versus.
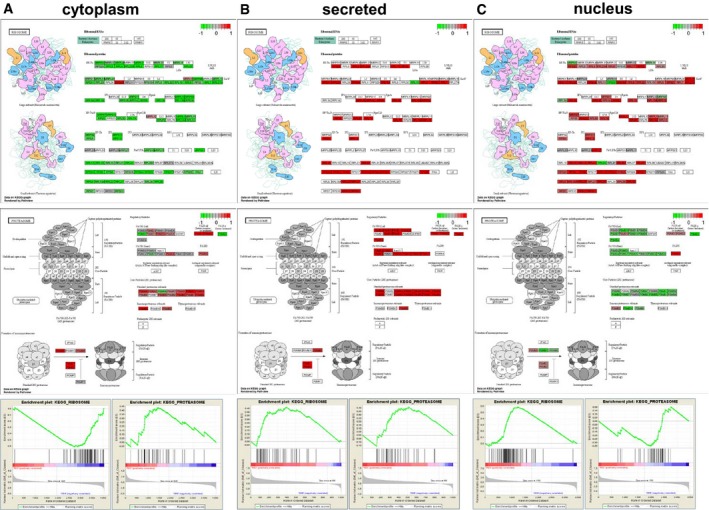
KEGG pathway visualization of log fold change (FC) regulated EIFs in ne, sn, cyt, cell pellets, red: upregulated, green/blue: downregulated in resistant cells.
Barplot of proteins involved in drug elimination strategies, regulation is depicted as upregulation in resistant cells by log2FC, order of compartment: cyt, ne, sn, all significant, * multiparameter correction.
Measurement of the concentration of H+ in the resistant cell cultures and endosomal activity by Molecular Probes® pHrodo® dye in S1, S2 and R1–4. Fluorescence was quantified compared to background using ImageJ software. Five images per cell culture were analysed, and the experiment was performed in triplicates (n = 15). Each measurement was depicted on the dot plot as one single point (mean). One‐tailed unpaired Student's t‐test was performed and revealed statistical significance (P < 0.0001****) of group S against group R.
- A–D
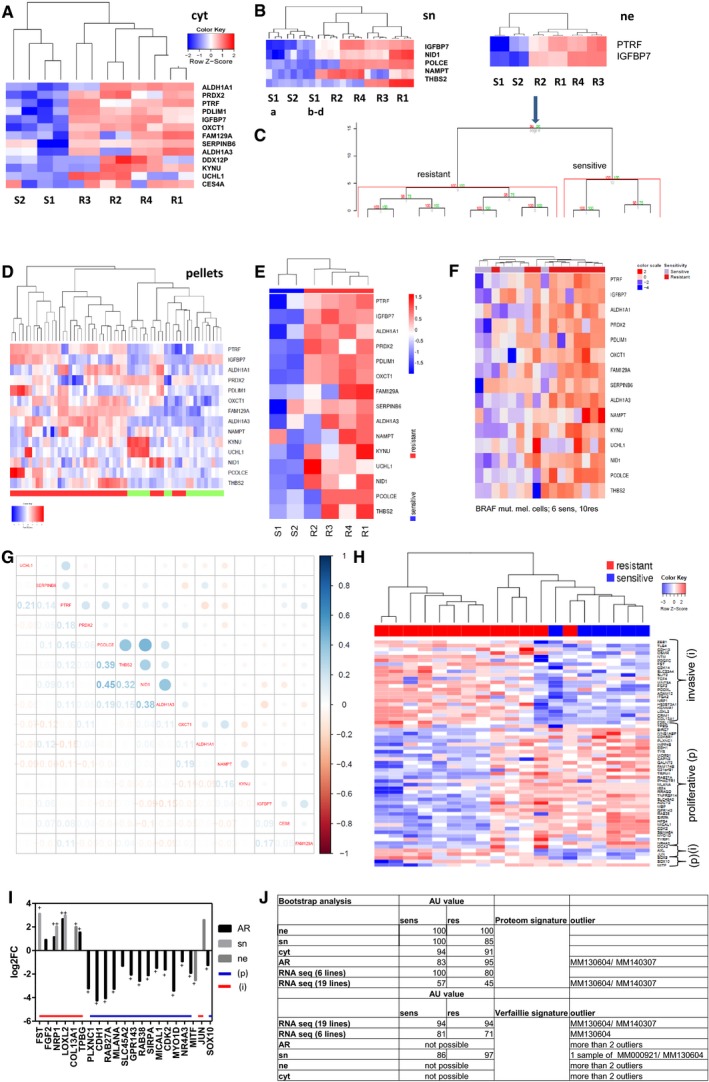
Proteins needed to distinguish between sensitive and resistant cells in cytoplasm (A), secretome (B) and nucleus with bootstrap analysis (C), of the 15 candidates in cell pellets (D).
- E, F
Heatmap of the 15 candidates with RNAseq data of S1, S2 R1–4 and a second cohort.
- G
Correlation matrix of the 15 candidates with TCGA, numbers indicate Pearson correlation coefficient.
- H
Heatmap of Verfaillie signature with RNAseq data correlating invasive (i)/proliferative (p) phenotype with resistant/sensitive melanoma cell cultures.
- I
Bar graph of 1st cohort (sn, ne) and 2nd cohort (AR; all resistant) correlating the Verfaillie signature of invasive (i) and proliferative (p) genes with the protein expression up or downregulated in resistant cell cultures.
- J
Bootstrap analysis with AU value of 1st and 2nd proteome and RNA cohort versus proteome signature (15 proteins) and RNA signature of the Verfaillie publication, + multiparameter correction.
- A–D
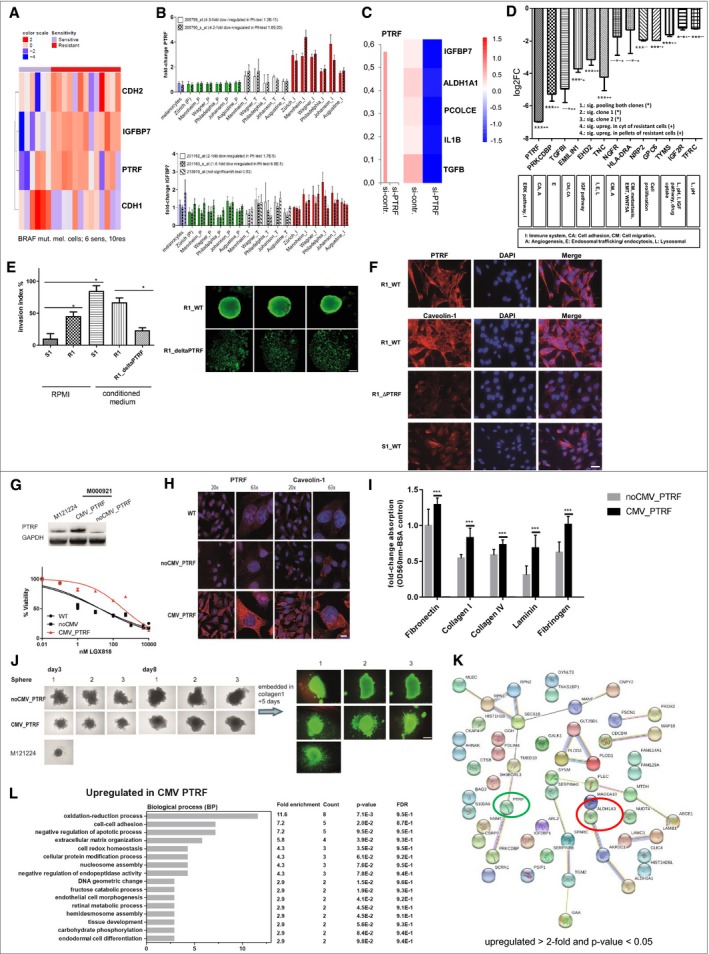
Association of PTRF and IGFBP7 with EMT phenotype (RNAseq data) (A) and with the invasive phenotype of melanoma cell cultures in microarray data of six different centres (B). (C) siRNA knockdown of PTRF and involved proteins by PTRF knockdown, Z values of the deltadeltaCT are used for the heatmap. (D) CRISPR of PTRF and the targets.
- E
Cell invasion of S1 and R1 with and without supernatant of melanoma‐associated fibroblasts (conditioned medium), and R1 harbouring loss of PTRF by CRISPR/Cas (R1_ΔPTRF). Statistical analysis using a one‐tailed unpaired Student's t‐test to analyse significance of two groups (*< 0.05). Sphere formation of R1 and R1_ΔPTRF showing live fluorescent staining using Calcein AM (Thermo Fisher). Here we show pictures of three independent wells. Ruler: 200 μM.
- F
Immunofluorescence analysis of PTRF and caveolin‐1 in S1, R1 and R1_ΔPTRF. Ruler: 50 μM.
- G
The BRAF‐mutated and drug‐sensitive melanoma cell culture M000921 (S1) was transduced with a lentivirus containing a PTRF‐overexpressing construct (CMV_PTRF) or a non‐CMV control plasmid (noCMV_PTRF). Expression of PTRF was confirmed by Western blotting. Cells were subjected to dose‐escalating concentrations of the BRAFi LGX818, and cell viability was measured for each concentration in triplicates. Error bars indicate SD. Normalized data were used to calculate the IC50 values by GraphPad Prism software [WT 57 nM (95%CI 32–100 nM); noCMV_PTRF 41 nM (95%CI 26–65 nM) and CMV_PTRF 784 nM (95%CI 592–1,037)].
- H
Fluorescent microscopy revealed coregulation of PTRF and caveolin‐1. Ruler: 20×: 30 μM, 63×: 10 μM.
- I
Cell adhesion is enhanced in PTRF‐overexpressing cell cultures (S1) (CMV_PTRF) in comparison with control cell cultures (noCMV_PTRF). Each bar graph represents the mean of two independent experiments for each cell culture (±SD). We performed a one‐tailed unpaired Student's t‐test for each adhesion protein to analyse significance between control and PTRF‐overexpressing cells (***< 0.005).
- J
Rapid spheroid formation is observed in PTRF‐expressing melanoma cultures which also show higher degree of invasion into a collagen 1 matrix compared to cell cultures lacking PTRF expression. Ruler: 500 μM.
- K
STRING analysis (red circle) and nearest shrunken centroid (green circle) of proteome data CMV_PTRF versus noCMV_PTRF (upregulated > 2‐fold and P‐value < 0.05).
- L
Functional annotation categories calculated in DAVID (DAVID Bioinformatics Resources) upregulated in CMV_PTRF. Fold enrichment values, count (genes involved in the term), P‐value and FDR (false discovery rate, calculated using the Benjamini–Hochberg procedure), listed next to the graph, were calculated using DAVID bioinformatics resources.
- A–D
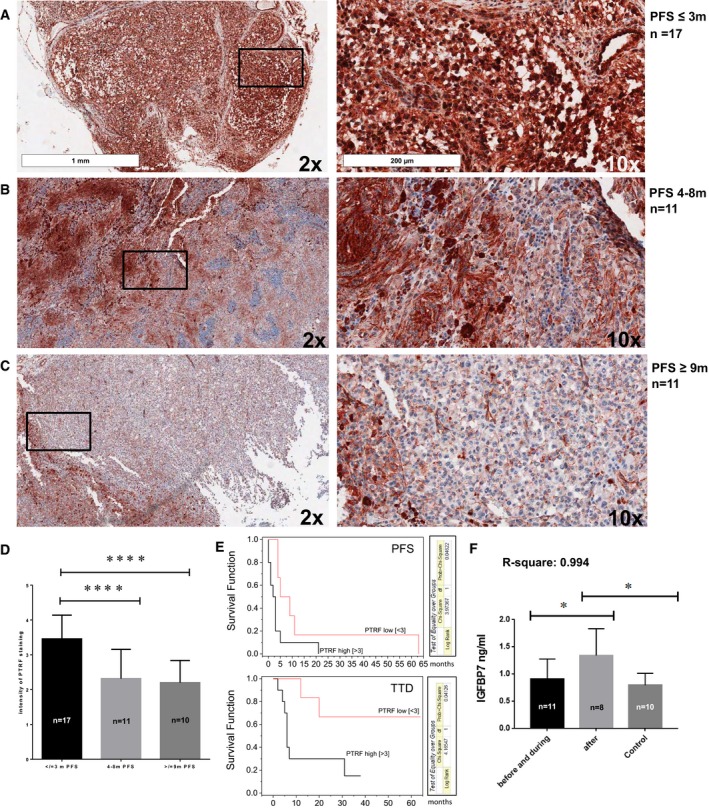
(A–C) Immunohistochemical staining for PTRF and (D) statistical analysis by one‐way ANOVA based on PFS. *P‐value < 0.05; **< 0.01, ***< 0.001.
- E
Kaplan–Meier curves with hazard ratio correlating PFS and TTD (time to death) with PTRF expression.
- F
IGFBP7 analysis by one‐way ANOVA in the serum samples of patients with MAPKi therapy by ELISA. *P‐value < 0.05.
References
-
- Aboulaich N, Ortegren U, Vener AV, Stralfors P (2006) Association and insulin regulated translocation of hormone‐sensitive lipase with PTRF. Biochem Biophys Res Comm 350: 657–661 - PubMed
-
- Alonso‐Curbelo D, Riveiro‐Falkenbach E, Perez‐Guijarro E, Cifdaloz M, Karras P, Osterloh L, Megias D, Canon E, Calvo TG, Olmeda D et al (2014) RAB7 controls melanoma progression by exploiting a lineage‐specific wiring of the endolysosomal pathway. Cancer Cell 26: 61–76 - PubMed
-
- Belloni B, Schonewolf N, Rozati S, Goldinger SM, Dummer R (2012) Cutaneous drug eruptions associated with the use of new oncological drugs. Chem Immunol Allergy 97: 191–202 - PubMed
Publication types
MeSH terms
Substances
Grants and funding
- 1334/M/Promedica Stiftung/International
- MUW Mobility Grant/International
- Comprehensive Cancer Center Forschungsförderung der Initiative Krebsforschung, MedUni Wien/International
- FK-14-032/Forschungskredit of the University of Zurich/International
- URPP "Translational Cancer Research" Grant/International
- Louis Widmer Grant/International
- Bürgermeistergrant/International
- Verein Hautkrebsforschung/International
- PMPDP3_151326/SNSF_/Swiss National Science Foundation/Switzerland
- 31003A_166435/SNSF_/Swiss National Science Foundation/Switzerland
- Verein für Hautkrebsforschung/International
- KLS 3151-02-2013/Hochspezialisierte Medizin Schwerpunkt Immunologie (HSM-2-Immunologie) Schweiz and Krebsliga Schweiz/International
- Prof. Bruno Bloch Foundation/International
LinkOut - more resources
Full Text Sources
Other Literature Sources
Medical
Molecular Biology Databases
Research Materials
Miscellaneous
