. 2019 Oct;18(5):e12999.
doi: 10.1111/acel.12999. Epub 2019 Jul 3.

PGC-1a integrates a metabolism and growth network linked to caloric restriction

Affiliations

PGC-1a integrates a metabolism and growth network linked to caloric restriction

Karl N Miller et al. Aging Cell. 2019 Oct.

Abstract

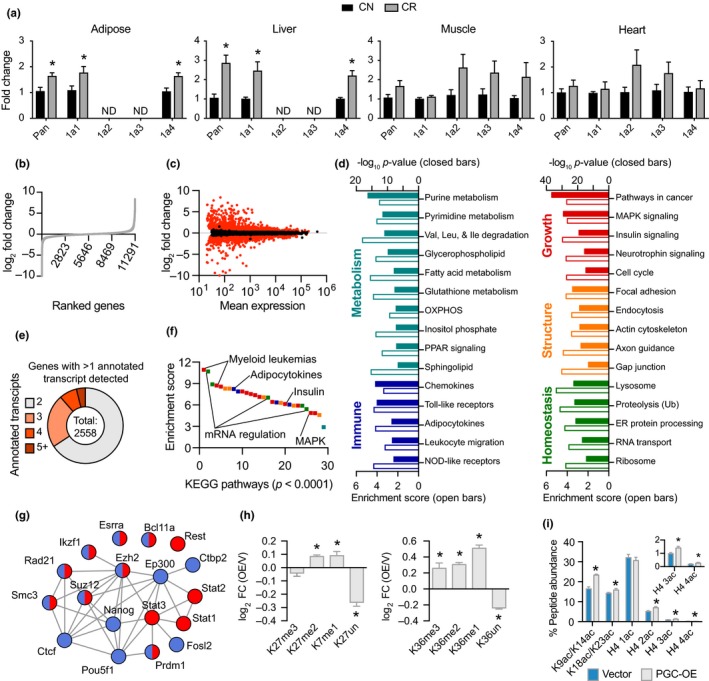
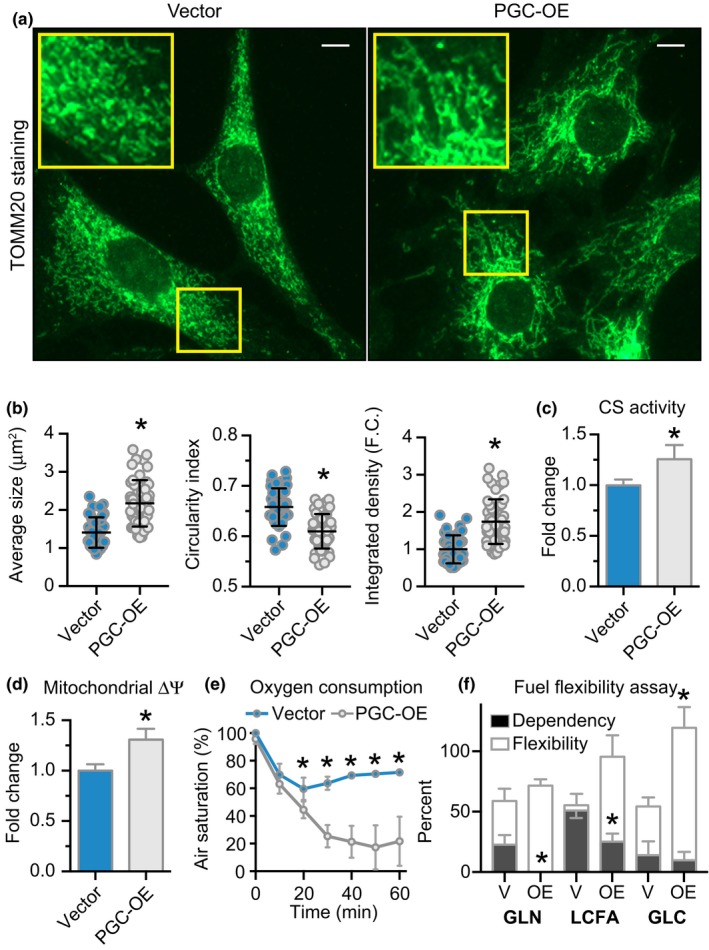
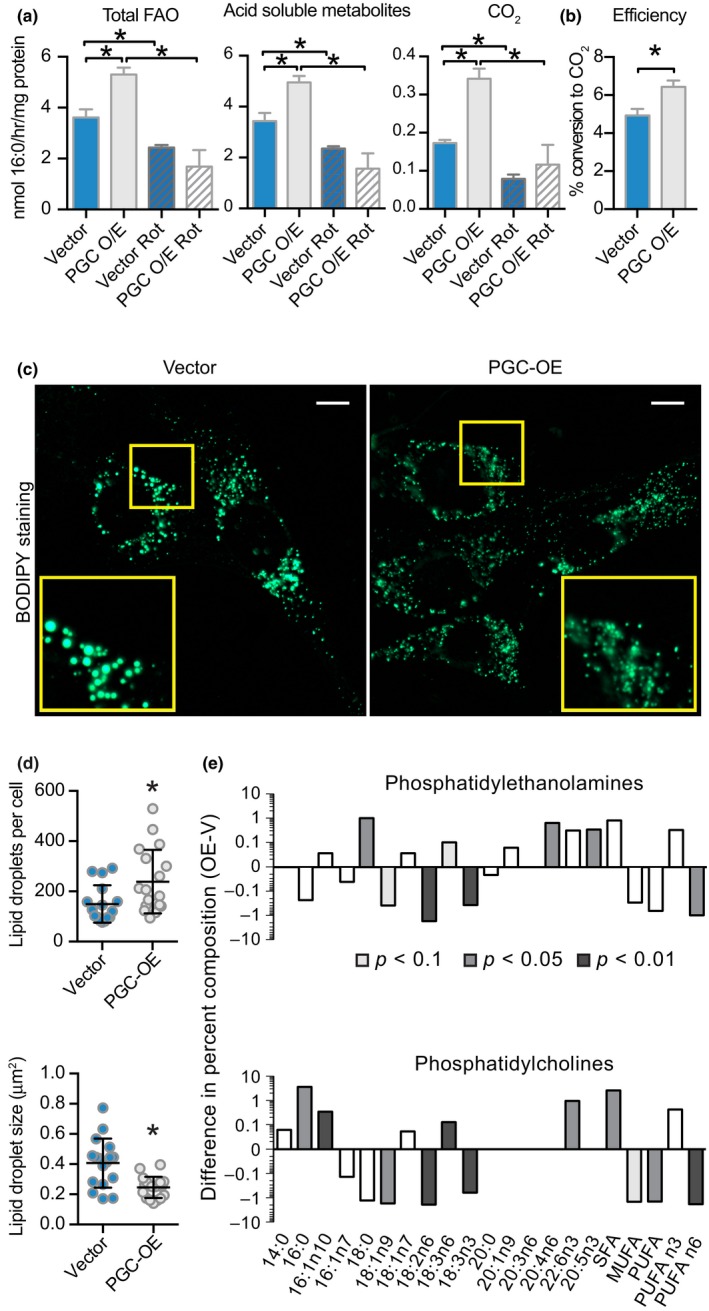
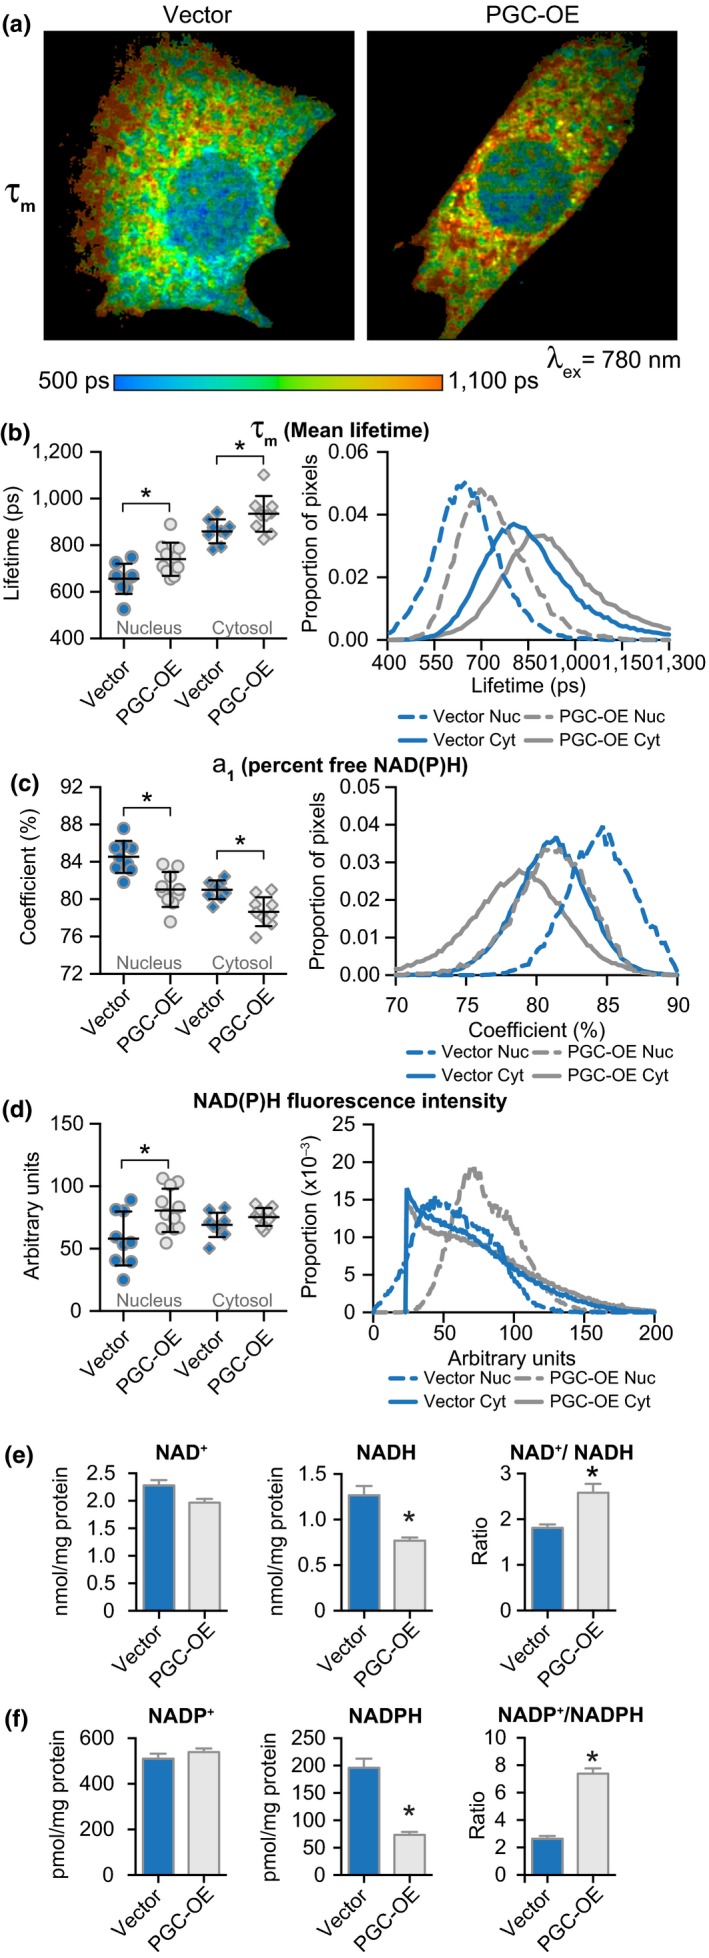
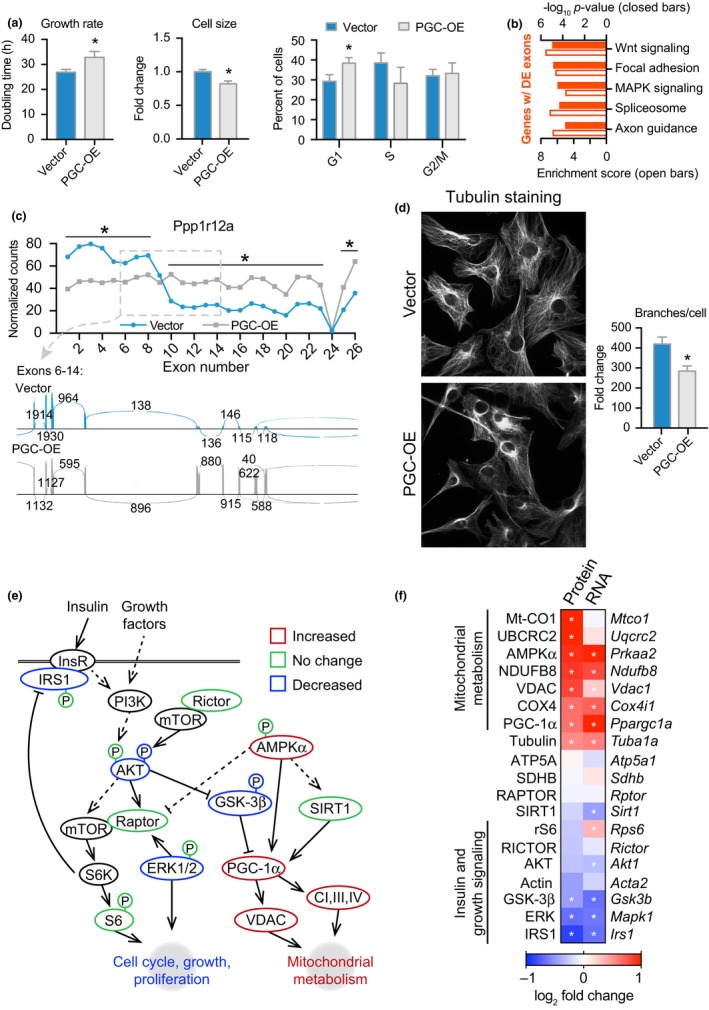
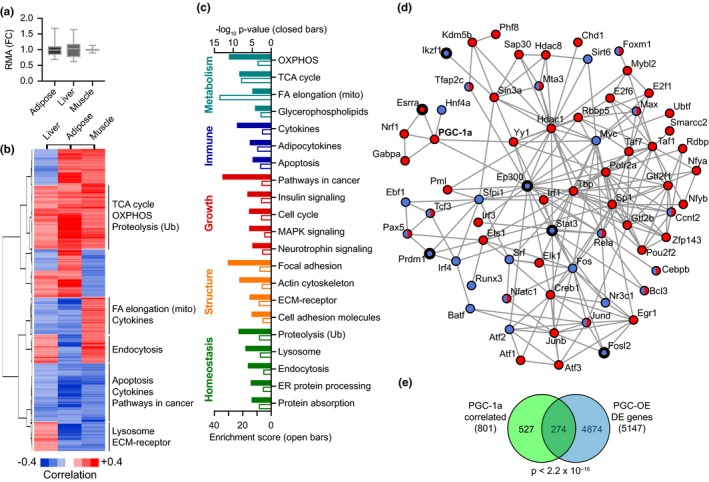
Deleterious changes in energy metabolism have been linked to aging and disease vulnerability, while activation of mitochondrial pathways has been linked to delayed aging by caloric restriction (CR). The basis for these associations is poorly understood, and the scope of impact of mitochondrial activation on cellular function has yet to be defined. Here, we show that mitochondrial regulator PGC-1a is induced by CR in multiple tissues, and at the cellular level, CR-like activation of PGC-1a impacts a network that integrates mitochondrial status with metabolism and growth parameters. Transcriptional profiling reveals that diverse functions, including immune pathways, growth, structure, and macromolecule homeostasis, are responsive to PGC-1a. Mechanistically, these changes in gene expression were linked to chromatin remodeling and RNA processing. Metabolic changes implicated in the transcriptional data were confirmed functionally including shifts in NAD metabolism, lipid metabolism, and membrane lipid composition. Delayed cellular proliferation, altered cytoskeleton, and attenuated growth signaling through post-transcriptional and post-translational mechanisms were also identified as outcomes of PGC-1a-directed mitochondrial activation. Furthermore, in vivo in tissues from a genetically heterogeneous mouse population, endogenous PGC-1a expression was correlated with this same metabolism and growth network. These data show that small changes in metabolism have broad consequences that arguably would profoundly alter cell function. We suggest that this PGC-1a sensitive network may be the basis for the association between mitochondrial function and aging where small deficiencies precipitate loss of function across a spectrum of cellular activities.

Keywords: NAD; PGC-1a; caloric restriction; lipid metabolism; longevity; mitochondria; redox metabolism.


Conflict of interest statement

JMD is a consultant for BioTechne and FORGE Bioscience and is cofounder of Galilei BioSciences. The remaining authors declare no conflict of interest.

Figures

Figure 1
Figure 1
Moderate, stable PGC‐1a overexpression is associated with a large transcriptional network. (a) Detection of PGC‐1a isoform expression in tissues from 12‐month‐old mice on 25% CR from 2 months of age. (b) Ranked fold change of all detected genes between control and PGC‐OE cells and (c) fold change as a function of mean expression with differentially expressed (DE) genes in red (p < 0.01, absolute FC > 1.2), n = 4. (d) KEGG pathway analysis. (e) Proportion of genes with multiple annotated transcript isoforms. (f) Rank ordered KEGG pathways by enrichment score; colors indicate panel (c) categories. (g) ENCODE factors associated with upregulated (red) and downregulated (blue) DE genes. (h) Fold change of histone H3K27 and K36 methylation and (i) quantitation of histone acetylation by mass spectrometry, n = 6. Pan, pan‐PGC‐1a isoform expression; 1a1, PGC‐1a1 isoform, etc. Data shown as means ± SEM; asterisk (*) indicates p < 0.05 by two‐tailed Student's t test
Figure 2
Figure 2
Mitochondrial activation and altered lipid metabolism in PGC‐OE cells. (a) Representative images of TOMM20 immunofluorescence detection (scale bar 10 μm), (b) quantitation of TOMM20 staining by particle size, shape, and integrated density, n = 43 vector and 50 PGC‐OE cells. (c) Citrate synthase activity, n = 6. (d) JC‐1 w590/w530 measurement of mitochondrial membrane potential, n = 15. (e) Oxygen consumption, n = 4. (f) Seahorse fuel flexibility assay, n = 6. GLN, glutamine; LCFA, long chain fatty acid; GLC, glucose. Data shown as means ± SD (b) or means ± SEM; asterisk (*) indicates p < 0.05 by two‐tailed Student's t test
Figure 3
Figure 3
Altered lipid metabolism in PGC‐OE cells. (a) Palmitate fatty acid oxidation radioassay and (b) oxidation efficiency, n = 6 or n = 3 for rot treatment. (c) BODIPY 493/503 neutral lipid stain representative images (scale bar 10 μm), (d) quantitation of lipid droplet number and average droplet size, n = 16 vector and 19 PGC‐OE cells. (e) Phospholipid percent composition represented as the difference between means of PGC‐OE and vector cell lines, n = 3. rot, rotenone. Data shown as means ± SD (d) or means ± SEM; asterisk (*) indicates p < 0.05 by two‐tailed Student's t test
Figure 4
Figure 4
Changes in NAD metabolism associated with PGC‐OE. (a) Representative images of NAD(P)H mean fluorescence lifetime (τm). Quantitation of means (left) and distributions (right) for (b) τm and (c) a1, the proportion of free NAD(P)H, n = 9 vector and 10 PGC‐OE cells. (d) Quantitation of NAD(P)H fluorescence intensity, n = 9 vector and 11 PGC‐OE cells. (e) NAD and (f) NADP biochemical assays, n = 3. Error bars represent ± SD or ± SEM (e, f). Asterisk (*) indicates p < 0.05 by two‐tailed Student's t test
Figure 5
Figure 5
Growth and structural phenotypes of PGC‐OE. (a) Doubling time, n = 19, cell size, n = 3, and cell cycle phase, n = 3. (b) KEGG pathway analysis of genes with ≥1 differentially expressed exon. (c) Exon expression of Ppp1r12a and sashimi plot. (d) Representative images of tubulin immunofluorescent detection and quantitation of tubulin cytoskeletal network branching points, n = 39 vector and 43 PGC‐OE cells. (e) Schematic of protein expression and phosphorylation in PGC‐OE by Western blot, n = 3. (f) Protein and corresponding RNA levels by RNAseq with the exception of Ppargc1a expression by qRT–PCR (see Figure S1E). Data are shown as means ± SEM. Asterisk (*) indicates p < 0.05 by two‐tailed Student's t test or differential expression of exons in (c) and transcripts in (f)
Figure 6
Figure 6
Tissue type‐independent PGC‐1a core gene network. (a) Range of PGC‐1a transcript expression in a diverse panel of hybrid mouse lines relative to mean expression (boxes indicate second and third quartile; whiskers indicate minimum and maximum). (b) Hierarchical clustering and cluster‐specific KEGG pathways for 801 genes correlated with PGC‐1a expression independent of tissue type and (c) KEGG pathways for entire set of 801 genes. (d) ENCODE analysis of factors associated with expression of genes positively (red) or negatively (blue) correlated with PGC‐1a expression independent of tissue type. Factors common to Figure 1h in thick outlines. (e) Overlap of gene identity between PGC‐1a‐correlated genes and PGC‐OE differentially expressed genes, p‐value calculated by Fisher's exact test.

References

    1. Anders, S. , Reyes, A. , & Huber, W. (2012). Detecting differential usage of exons from RNA‐seq data. Genome Research, 22(10), 2008–2017. 10.1101/gr.133744.111 - DOI - PMC - PubMed
    1. Anderson, R. M. , Barger, J. L. , Edwards, M. G. , Braun, K. H. , O'Connor, C. E. , Prolla, T. A. , & Weindruch, R. (2008). Dynamic regulation of PGC‐1alpha localization and turnover implicates mitochondrial adaptation in calorie restriction and the stress response. Aging Cell, 7(1), 101–111. 10.1111/j.1474-9726.2007.00357.x - DOI - PMC - PubMed
    1. Balasubramanian, P. , Howell, P. R. , & Anderson, R. M. (2017). Aging and caloric restriction research: A biological perspective with translational potential. EBioMedicine, 21, 37–44. 10.1016/j.ebiom.2017.06.015 - DOI - PMC - PubMed
    1. Barger, J. L. , Anderson, R. M. , Newton, M. A. , da Silva, C. , Vann, J. A. , Pugh, T. D. , … Weindruch, R. (2015). A conserved transcriptional signature of delayed aging and reduced disease vulnerability is partially mediated by SIRT3. PLoS ONE, 10(4), e0120738 10.1371/journal.pone.0120738 - DOI - PMC - PubMed
    1. Bartke, A. , & Darcy, J. (2017). GH and ageing: Pitfalls and new insights. Best Practice & Research Clinical Endocrinology & Metabolism, 31(1), 113–125. 10.1016/j.beem.2017.02.005 - DOI - PMC - PubMed

Publication types

MeSH terms

Substances

LinkOut - more resources