

Extracellular vesicles impose quiescence on residual hematopoietic stem cells in the leukemic niche
- PMID: 31267709
- PMCID: PMC6607014
- DOI: 10.15252/embr.201847546
Extracellular vesicles impose quiescence on residual hematopoietic stem cells in the leukemic niche
Abstract
Progressive remodeling of the bone marrow microenvironment is recognized as an integral aspect of leukemogenesis. Expanding acute myeloid leukemia (AML) clones not only alter stroma composition, but also actively constrain hematopoiesis, representing a significant source of patient morbidity and mortality. Recent studies revealed the surprising resistance of long-term hematopoietic stem cells (LT-HSC) to elimination from the leukemic niche. Here, we examine the fate and function of residual LT-HSC in the BM of murine xenografts with emphasis on the role of AML-derived extracellular vesicles (EV). AML-EV rapidly enter HSC, and their trafficking elicits protein synthesis suppression and LT-HSC quiescence. Mechanistically, AML-EV transfer a panel of miRNA, including miR-1246, that target the mTOR subunit Raptor, causing ribosomal protein S6 hypo-phosphorylation, which in turn impairs protein synthesis in LT-HSC. While HSC functionally recover from quiescence upon transplantation to an AML-naive environment, they maintain relative gains in repopulation capacity. These phenotypic changes are accompanied by DNA double-strand breaks and evidence of a sustained DNA-damage response. In sum, AML-EV contribute to niche-dependent, reversible quiescence and elicit persisting DNA damage in LT-HSC.
Keywords: AML; DNA damage; extracellular vesicles; hematopoiesis.
© 2019 The Authors.
Conflict of interest statement
The authors declare that they have no conflict of interest.
Figures

Cryo‐TEM images demonstrate the lipid bilayer EV purified from Molm‐14 and U‐937 cells. Scale bars are 100 nm.
A schematic diagram of the myristoylated GFP (mGFP)‐expressing lentiviral construct and its incorporation into the cell membrane and EV. Long terminal repeat (LTR), poly‐adenylate (pA), cytomegalovirus (CMV).
Schematic diagram of the workflow. Cells were injected via tail‐vein injection into NSG mice. After 21 days, bone marrow (BM) cells were flushed to sort GFP+ cells by flow cytometry and perform imaging of sorted HSC.
Peripheral blood (PB) plasma of control animals contains no mGFP+ foci (top); however, Molm‐14‐mGFP (middle) and U‐937‐mGFP (bottom) xenografts contain numerous mGFP‐labeled EV (green) detectible without vesicle concentration. Scale bars are 5 μm.
Live‐cell microscopy of KSL cells (left panel) LT‐HSC cells (right panel). Cells were sorted from control mice (top), Molm‐14‐mGFP (middle), and U‐937‐mGFP (bottom), stained with Cell Mask (red) and nuclear stain Hoechst (blue), imaged using the GE/API Deltavision (DV) widefield microscope (60× objective) to show the uptake of the GFP+ EV (green). Scale bars are 5 μm.
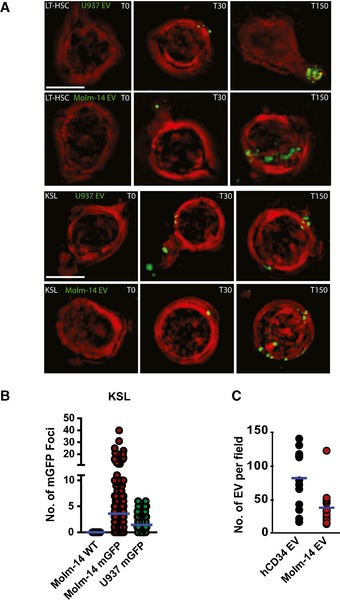
Microscopic images using the GE/API Deltavision widefield microscope (60× objective) of live LT‐HSC (top rows), or KSL (bottom rows), in vitro exposed to EV from Molm‐14‐mGFP and U‐937‐mGFP cells for 0, 30, and 150 min. Green: mGFP+ EV, red: plasma membrane surface. Scale bars are 5 μm.
Quantification of mGFP+ EV foci in KSL FACS purified from AML xenografts: wild‐type Molm‐14 (n = 40), Molm‐14‐mGFP (n = 247), and U‐937‐mGFP (n = 107). The background autofluorescence was measured in non‐engrafted controls, and this threshold value was then subtracted from xenografted mice. Individual mGFP+ foci were counted in individual KSL from xenografted animals using Imaris software.
Microscopic quantification of EV from hCD34 (3 × 10⁷ cells) or Molm‐14 (3 × 10⁷ cells). The purified EV were stained with the lipid dye, FM1‐43, imaged using the Yokogawa CSU‐W1 spinning disk microscope (100× objective) and quantified using Imaris software. Separate measurements for hCD34, 11; Molm14 EV, 8.

- A
Schematic diagram of methods: the in vivo AML xenografts (tail‐vein injection of 105 Molm‐14 cells or vehicle per mouse) and the intrafemoral (IF) injection of AML‐EV into one femur with a contralateral control vehicle‐injected femur of the same mouse. EV were isolated by serial high‐speed centrifugation (at 2×, 10×, 100 × 103 g) from AML cell‐line culture media or AML patient plasma. Bone marrow was flushed from long bones at the indicated time points, and immunophenotypic analysis was performed by flow cytometry.
- B, C
Flow cytometric analysis showing the frequency of LK and KSL cells in lineage‐negative cells (left panel) and LT‐HSC in KSL (right panel) in: (B) Molm‐14 xenograft (red, n = 10) versus control (black, n = 10). Data were obtained from at least two independent experiments. (C) IF injection of EV from Molm‐14 cells (red, n = 8), AML plasma EV (orange, n = 6), and human CD34 EV (blue, n = 4) relative to the vehicle‐injected contralateral femurs. Data were obtained from at least two independent experiments. Statistics: Student's t‐test (*P < 0.05, ***P < 0.001).
- D
Cell‐cycle histograms of KSL (upper panel) and LT‐HSC (lower panel) from Molm‐14 xenografts or control using Hoechst‐33342 staining.
- E
Flow cytometric analysis of the Ki67‐ve percentage of LT‐HSC representing the G0 phase of cell cycle in: (left panel) Molm‐14 xenografts (red, n = 7) versus control (black, n = 9); (right panel) IF injection of Molm‐14‐EV, U‐937 EV, HL‐60 EV (red, n = 5,4,4) versus human CD34 EV (blue, n = 3) versus controls (black). Data were obtained from at least two independent experiments Statistics: Student's t‐test (*P < 0.05, **P < 0.01).
- F, G
Flow cytometric analysis of intracellular P53 levels shown in histograms (F) and MFI (G) of LT‐HSC in: (left panel) Molm‐14 xenograft, n = 6 red versus non‐engrafted control, n = 4 black, or (right panel) IF injection of EV from Molm‐14, U‐937, HL‐60 (red, n = 5,5,3) or human CD34 cells (blue, n = 6) normalized to vehicle‐injected contralateral femurs. Data were obtained from at least two independent experiments. Statistics: Student's t‐test (*P < 0.05, **P < 0.01).
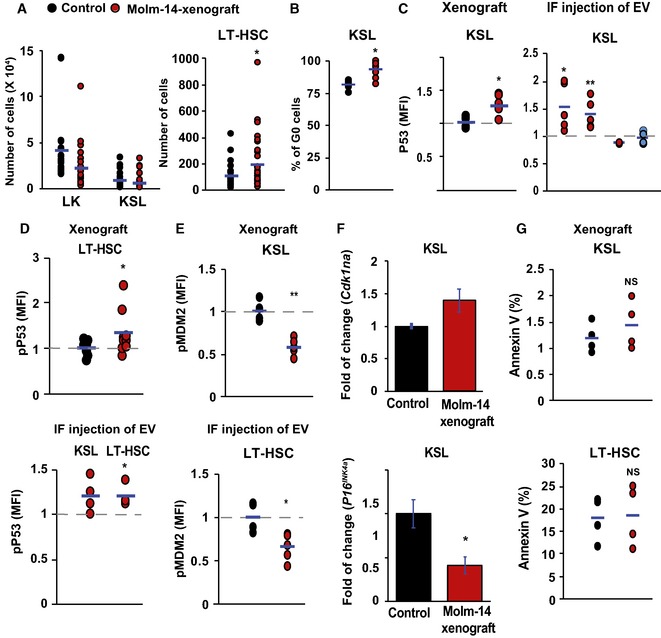
Flow cytometric analysis showing the absolute cell number of LK and KSL cells in lineage‐negative cells (left panel) and LT‐HSC (right panel) in Molm‐14 xenograft (red, n = 10) versus control (black, n = 10). Statistics: Student's t‐test (*P < 0.05).
Flow cytometric analysis of KSL percentage in G0 phase from Molm‐14 xenografts (red, n = 7) versus control (black, n = 9). Statistics: Student's t‐test (*P < 0.05).
Flow cytometric analysis of P53 MFI in KSL in: (left panel) Molm‐14 xenograft (red, n = 6) versus control (black, n = 4), or (right panel) IF injection of EV from Molm‐14, U‐937, HL‐60 (red, n = 5,5,3), or CD34 cells (blue, n = 6) normalized to vehicle‐injected femurs. Statistics: Student's t‐test (*P < 0.05, **P < 0.01).
Flow cytometric analysis of pP53ser15 MFI of LT‐HSC in: (upper panel) Molm‐14 xenografts, n = 9 red versus control, n = 7 black, or (lower panel) LT‐HSC and KSL after IF injection of Molm‐14 EV (red, n = 4) normalized to vehicle‐injected contralateral femurs. Data are presented after subtracting the background fluorescence. Statistics: Student's t‐test (*P < 0.05).
Flow cytometric analysis of the pMDM2 MFI in KSL (upper panel) and LT‐HSC (lower panel) in Molm‐14 xenografts (red, n = 5) versus control (black, n = 4). Statistics: Student's t‐test (*P < 0.05, **P < 0.01).
qRT–PCR showing the fold change of Cdkn1a (upper panel) and P16 INK4a (lower panel) in KSL from Molm‐14 xenografts relative to control mice and normalized to Gapdh endogenous control. Data are mean ± SEM from at least three independent experiments with technical replicates. Statistics: one‐way ANOVA with Bonferroni post hoc correction (*P < 0.05).
Annexin V+ analysis of KSL (upper panel) and LT‐HSC (lower panel), in Molm‐14 xenograft (red, n = 4) versus control (black, n = 4). Statistics: Student's t‐test (NS = not significant).&!#6;
- A
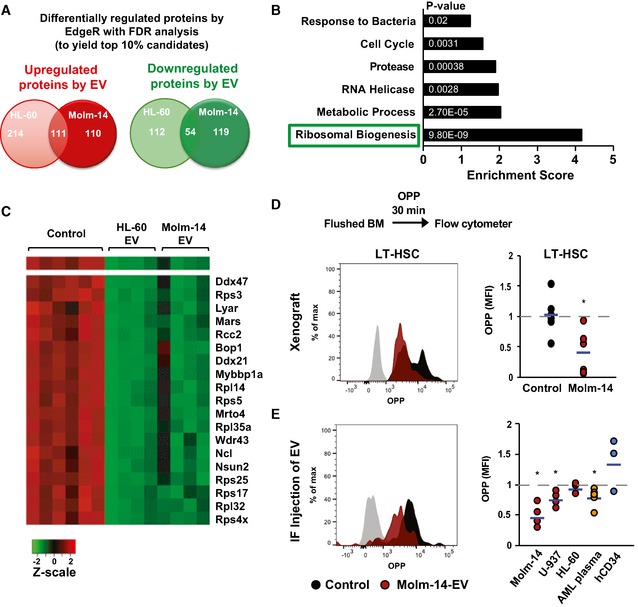
A Venn diagram showing the most highly up‐ and downregulated proteins between Molm‐14‐EV and HL‐60 EV‐treated cKit+ HSPC determined by isobaric TMT labeling and edgeR analyses to calculate the false discovery rate (FDR) analysis to obtain ˜10% of the differentially regulated proteins. We obtained 325 and 221 upregulated proteins in the HL‐60 dataset and the Molm‐14 dataset, respectively. We also obtained 166 and 173 downregulated protein in the HL‐60 dataset and the Molm‐14 dataset, respectively. Among them, 54 proteins were commonly downregulated.
- B
A bar graph showing the functional annotation enrichment analysis by DAVID biostatistical plate form of the 54 commonly downregulated protein identified the indicated pathways; among them, the ribosomal biogenesis pathway showed the highest enrichment. P‐values are indicated in white. Modified Fisher's exact test.
- C
A heatmap showing the highly deregulated ribosomal proteins in AML‐EV‐exposed cells.
- D, E
Flow cytometric analysis showing the histograms and MFI of O‐propargyl‐puromycin (OPP) incorporation in LT‐HSC in: (D) Molm‐14 xenografts, red n = 6 versus non‐engrafted controls, black n = 6, or (E) IF injection of EV from Molm‐14, U‐937, HL‐60 (red, n = 5,4,3), AML patient plasma (orange, n = 6) or human CD34+ cells (blue, n = 3) normalized to vehicle‐injected contralateral femurs after subtracting the background fluorescence. Data were obtained from at least two independent experiments. Statistics: Student's t‐test (*P < 0.05).
- A
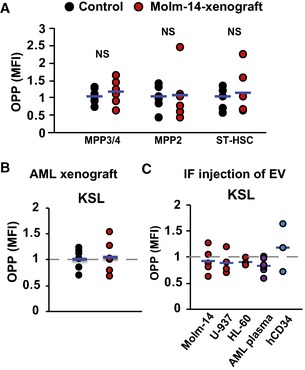
Flow cytometric analysis showing MFI of OPP incorporation in MPP3/4, MPP2, and ST‐HSC in the Molm‐14 xenografts (red, n = 6) versus non‐engrafted mice (black, n = 6). Statistics: Student's t‐test (not significant “NS”).
- B, C
OPP flow cytometric analysis of KSL in: (B) Molm‐14 xenografts (red, n = 6) versus non‐engrafted mice (black, n = 6), or (C) IF injection of EV from Molm‐14, U‐937, HL‐60 (red, n = 5,4,3), AML patient plasma (orange, n = 6), or CD34+ cells (blue, n = 3) normalized to contralateral femurs after subtracting background fluorescence.

- A, B
qRT–PCR gene expression analysis showing the fold change of PI3K/mTOR‐associated gene panel in KSL cells sorted from: (A) Molm‐14‐xenografted mice or (B) IF‐injected mice with Molm‐14‐EV relative to their controls and normalized to Gapdh endogenous control. Data are expressed as mean ± SEM from at least three independent experiments, performed in technical replicates. Statistics: One‐way ANOVA with Bonferroni post hoc correction (*P < 0.05, **P < 0.01).
- C–E
Flow cytometric analysis showing the histograms (C) and MFI of intracellular pS6KRP in LT‐HSC in: (D) Molm‐14 xenograft (red, n = 9) versus non‐engrafted control (black, n = 7), or (E) IF injection of EV from Molm‐14, U‐937, HL‐60 (red, n = 7,3,3), or human CD34 cells (blue, n = 4) normalized to the control contralateral femur with subtraction of background fluorescence. Data were obtained from at least two independent experiments. Statistics: Student's t‐test (*P < 0.05, ***P < 0.001).
- F, G
Flow cytometric assessment of protein synthesis showing the MFI of: (F) OPP or (G) pS6RP in NIH‐3T3 cells 72 h after transfection with the indicated miRNA mimics. The results were calculated relative to control (miR‐scramble) with the background fluorescence subtracted and performed with at least three independent experiments, in technical replicates. Statistics: one‐way ANOVA with Bonferroni post hoc correction (*P < 0.05, **P < 0.01).
- H
Flow cytometric analysis showing the MFI of Raptor in NIH‐3T3 cells 72 h after transfection with the indicated miRNA mimics. The data were calculated relative to miR‐scramble and are presented as mean ± SEM, and the background fluorescence was subtracted. Performed with at least three independent experiments, in technical replicates. Statistics: one‐way ANOVA with Bonferroni post hoc correction (*P < 0.05, **P < 0.01).
- I
Dual‐luciferase reporter assay. NIH‐3T3 was transfected with the miRNA mimics. Three hours later, the cells were transfected with the Raptor 3′UTR cloned into the psiCheck‐2 vector for a total of 48 h. Data are presented as %RLU (relative luciferase units) of the miR‐scramble control as mean ± SEM from at least three independent experiments, performed in technical replicates. Statistics: one‐way ANOVA with Bonferroni post hoc correction (*P < 0.05).
- J, K
Cell‐cycle flow cytometric analysis using Ki67/Hoechst‐33342 staining of the percentage of LT‐HSC in the G0 phase after nucleofection of cKit+ cells using the Amaxa™ P3 Primary Cell 4D‐Nucleofector Kit, (J) Cells were nucleofected with miR‐scramble (CTRL) or miR‐1246 mimic (n = 3) for 72 h, (K) cells were nucleofected with anti‐miR‐scramble (CTRL) or anti‐miR‐1246 (n = 5) and 1 h later co‐treatment with Molm‐14 EV for 72 h. Statistics: Student's t‐test (*P < 0.05, **P < 0.01).

- A
Flow cytometric analysis of pS6KRP MFI in KSL in: (left panel) Molm‐14 xenografts, red, n = 4 versus control mice, black, n = 3; or (right panel) IF injection of EV from Molm‐14, U‐937, HL‐60 (red, n = 7,3,3), or CD34 cells (blue, n = 4) normalized to vehicle‐injected contralateral femurs. The background fluorescence was subtracted. Statistics: Student's t‐test (*P < 0.05).
- B, C
Cell‐cycle flow cytometric analysis using Ki67/Hoechst‐33342 staining of the percentage of LT‐HSC in the G0 phase after (B) nucleofection of cKit+ cells with siControl or siRaptor for 72 h using the Amaxa™ P3 Primary Cell 4D‐Nucleofector Kit. (C) Treatment of ex vivo‐cultured cKit+ cells with vehicle or rapamycin (100 nM) for 72 h. Statistics: Student's t‐test (**P < 0.01).
- D
Flow cytometric analysis of intracellular Raptor MFI levels in KSL (upper panel) and LT‐HSC (lower panel) derived from Molm‐14 xenografts (red, n = 5) versus control (black, n = 3). Statistics: Student's t‐test (**P < 0.01, ***P < 0.001).
- E
Flow cytometric analysis of pS6RP MFI in KSL (upper panel) and LT‐HSC (lower panel) obtained from Molm‐14 xenografts (red, n = 5) versus non‐engrafted mice (black, n = 3) at Day 0 (freshly isolated HSPC cells) or Day 7 (after 7 days of ex vivo culture in RPMI with 50 ng/ml IL‐3/SCF and 10% FBS at 37°C, 5% CO2). Statistics: Student's t‐test (not significant “NS”, **P < 0.01 and ***P < 0.001).
- F, G
Flow cytometric analysis of cMyc MFI in KSL (left panel) and LT‐HSC (right panel) in: (F) Molm‐14 xenografts (red, n = 3 and 5) versus control (black, n = 3 and 3), or (G) IF injection of EV from Molm‐14, U‐937, and HL‐60 (n = 4,3, and 3). Statistics: Student's t‐test (not significant “NS”).
- H
qRT–PCR gene expression showing the fold change of Raptor, Rictor, or Pten genes in NIH‐3T3 transfected with the indicated miRNA mimics for 48 h. The fold change was calculated relative to miR‐scramble after normalizing to Gapdh endogenous control. Data are mean ± SEM from at least three independent experiments, performed in technical replicates. Statistics: one‐way ANOVA with Bonferroni post hoc correction (*P < 0.05 and **P < 0.01).
- I
Flow cytometric analysis showing the histograms of Raptor in NIH‐3T3 cells 72 h after transfection with miR‐scramble or miR‐1246 mimics.
- A
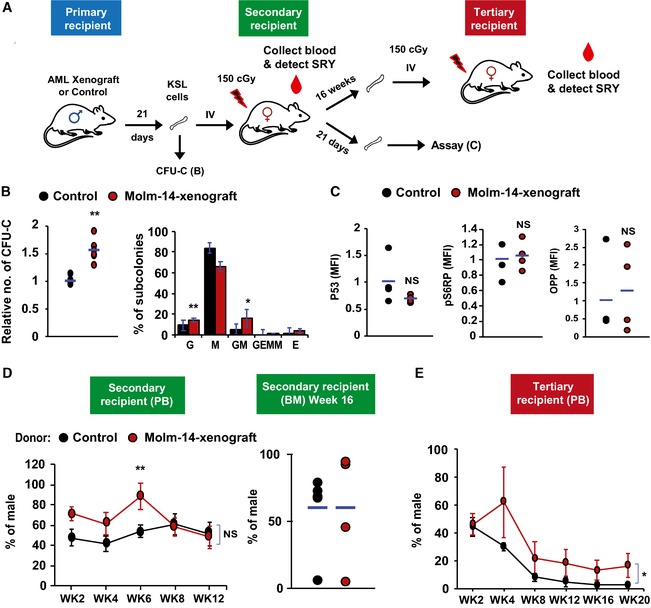
A diagram showing the scheme of repopulation experiments on non‐leukemic host. KSL cells were purified from Molm‐14‐xenografted male mice (red) or control males (black) and transplanted into 150 cGy sublethally irradiated female recipients (104 cells per mouse) and used for subsequent repopulation studies described in (D, E).
- B
CFU‐C assay showing the relative number of colonies (left panel) and the colony subtypes (right panel) from KSL cells derived from Molm‐14‐xenografted mice (red, n = 6) versus non‐engrafted control mice (black, n = 5) and in vitro‐cultured for 7 days in methylcellulose media. Experiments were performed in technical triplicates. “G”—granulocyte, “M”—monocyte, and “E”—erythrocytes. Statistics: Student's t‐test (*P < 0.05, **P < 0.01).
- C
LT‐HSC assessment after repopulation, recipient female mice (n = 4 per group) were sacrificed after 21 days and their LT‐HSC were compared using P53, pS6RP, and OPP flow cytometric assays. Statistics: Student's t‐test.
- D, E
Evaluation of the in vivo long‐term repopulation capacity. (D) For secondary transplantation (n = 6 per group), PB samples were collected twice weekly for 12 weeks (WK), and the donor chimerism was measured by qPCR of sex‐determining region Y (SRY) normalized to Gapdh gatekeeper as shown in the left panel. Sixteen weeks later, mice were sacrificed and BM male chimerism percentage was assessed as shown in the right panel. (E) For tertiary transplantation, unfractionated BM cells from the secondary recipients (n = 6 per group, 106 cells per mouse) were injected into tertiary 150 cGy sublethally irradiated female recipients and blood SRY levels were assessed for 20 weeks. Statistics: Student's t‐test for two‐sample comparison and regression analysis for longitudinal comparison (NS = not significant, *P < 0.05 and **P < 0.01).
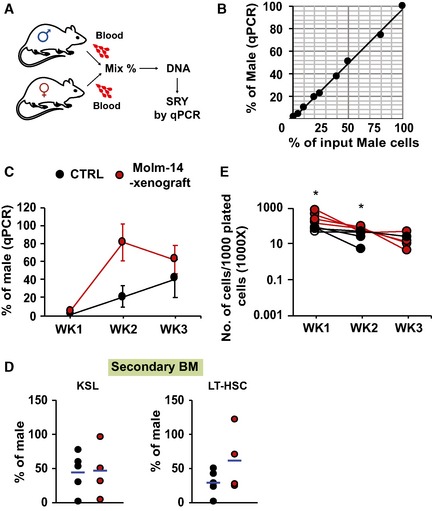
Schematic diagram of the workflow. PB samples were collected from male and female mice. Blood leukocytes were counted and mixed at different proportions. DNA from the mixtures was extracted, and SRY was quantified by qRT–PCR and normalized to Gapdh.
Correlation between measured male DNA determined by qPCR on the Y‐axis and the corresponding input male cells on the X‐axis (n = 1, R 2 = 0.9965).
qRT–PCR of the PB donor male DNA from Molm‐14 xenografts (red, n = 4), or controls (black, n = 4) transplanted into secondary female recipients for 3 weeks. Data were normalized to Gapdh and are presented as mean ± SEM
qRT–PCR of male chimerism in: (left panel) KSL or (right panel) LT‐HSC, from mice transplanted by either Molm‐14 xenografts (red, n = 4) or controls (black, n = 4) for 16 weeks.
Total number of cells per 1,000 input cells, serially replated into methylcellulose media for three successive weeks. Cells derived from Molm‐14 xenografts and control mice were represented in red and black, respectively. Data were performed in technical triplicates. Statistics: Student's t‐test (*P < 0.05).
- A
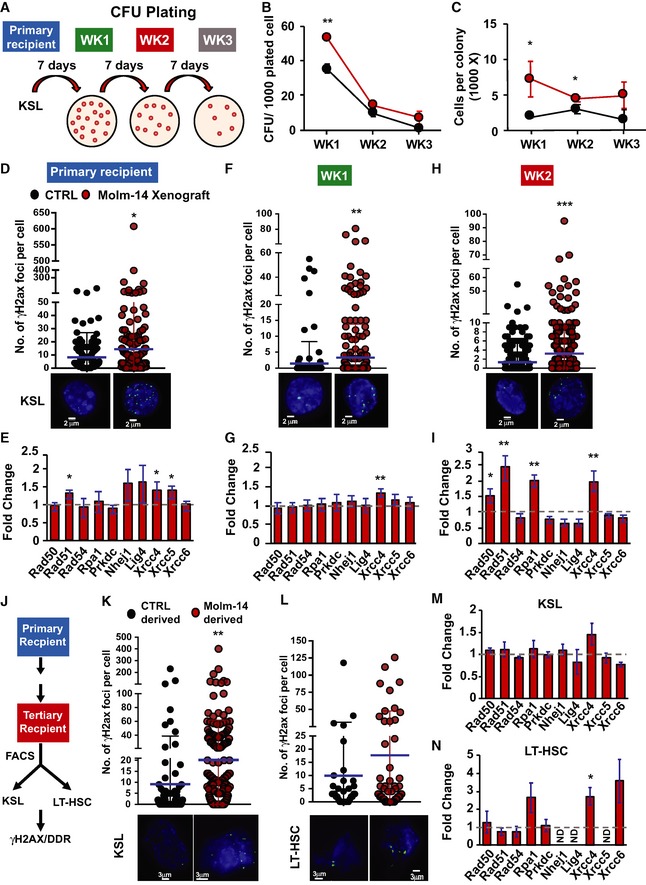
A schematic diagram demonstrating the serial replating experiment. KSL cells were sorted from primary recipient control mice (black, n = 4) or Molm‐14 xenografts (red, n = 4) and plated in triplicate (500 cells/plate/mouse) in methylcellulose media. Seven days later, colonies were counted and serially replated in triplicate (5,000 cells/plate/mouse). The replating process was repeated twice for a total of three rounds (labeled week “WK” 1, 2, and 3).
- B, C
Serial replating CFU‐C analysis presented as mean ± SEM showing (B) the number of colonies per 1,000 plated cells and (C) the number of cells per colony, for each week time point. Statistics: Student's t‐test (*P < 0.05, **P < 0.01).
- D–I
DNA‐damage assessment in KSL from primary recipients and after two turns of replating. (D, F, H) Number of γH2AX foci in control‐derived and Molm‐14‐xenograft‐derived mean ± SD (D) primary recipient KSL, n = 211 and 321, (F) cells from W1 plating, n = 218 and 369, and (H) cells from W2 plating, n = 770 and 853. All cells were stained with phosphoH2axser139 and the nuclear stain Hoechst (blue), imaged using the GE/API DV widefield microscope (60× objective) to show the γH2AX foci (green) and counted using Imaris software. Scale bars are 2 μm. Statistics: Student's t‐test (*P < 0.05, **P < 0.01, and ***P < 0.001). (E, G, I) qRT–PCR gene expression analysis showing the fold change of select DNA‐damage response‐gene panel in Molm‐14‐xenograft‐derived (E) primary recipient KSL, n = 6, (G) cells from W1 plating, n = 4, and (I) cells from W2 plating, n = 4. Data indicated by bars of fold change calculated relative to matching controls were normalized to the endogenous control Gapdh and are presented as mean ± SEM. Statistics: one‐way ANOVA with Bonferroni post hoc correction (*P < 0.05, **P < 0.01).
- J
Scheme of DDR assessment in KSL and LT‐HSC derived from serial in vivo repopulation.
- K, L
Number of γH2AX foci, respectively, in control‐ and Molm‐14‐xenograft‐derived (K) KSL, n = 101/204, and (L) LT‐HSC, n = 33/53. Images were processed similar to (D–F). Scale bars are 3 μm. Statistics: Student's t‐test (**P < 0.01). Mean ± SD.
- M, N
qRT–PCR analysis of the DNA‐damage gene panel in Molm‐14‐xenograft‐derived (M) KSL and (N) LT‐HSC, relative to matched controls. Data depicted as fold change relative to matching controls were normalized to the endogenous control Gapdh and are presented as mean ± SEM. Statistics: one‐way ANOVA with Bonferroni post hoc correction (*P < 0.05).
References
-
- SEER (2008. –2014) Cases and deaths the surveillance, epidemiology and end results (SEER) database. Bethesda, MD: National Cancer Institute;
-
- Pession A, Masetti R, Rizzari C, Putti MC, Casale F, Fagioli F, Luciani M, Lo Nigro L, Menna G, Micalizzi C et al (2013) Results of the AIEOP AML 2002/01 multicenter prospective trial for the treatment of children with acute myeloid leukemia. Blood 122: 170–178 - PubMed
-
- Creutzig U, Zimmermann M, Dworzak MN, Gibson B, Tamminga R, Abrahamsson J, Ha SY, Hasle H, Maschan A, Bertrand Y et al (2014) The prognostic significance of early treatment response in pediatric relapsed acute myeloid leukemia: results of the international study Relapsed AML 2001/01. Haematologica 99: 1472–1478 - PMC - PubMed
-
- Sasine JP, Schiller GJ (2016) Acute myeloid leukemia: how do we measure success? Curr Hematol Malig Rep 11: 528–536 - PubMed
-
- Kantarjian H, O'Brien S, Cortes J, Giles F, Faderl S, Jabbour E, Garcia‐Manero G, Wierda W, Pierce S, Shan J et al (2006) Results of intensive chemotherapy in 998 patients age 65 years or older with acute myeloid leukemia or high‐risk myelodysplastic syndrome: predictive prognostic models for outcome. Cancer 106: 1090–1098 - PubMed
Publication types
MeSH terms
Substances
Grants and funding
LinkOut - more resources
Full Text Sources
Medical
Miscellaneous
