

Epigenetic regulation of ferroptosis by H2B monoubiquitination and p53
- PMID: 31267712
- PMCID: PMC6607012
- DOI: 10.15252/embr.201847563
Epigenetic regulation of ferroptosis by H2B monoubiquitination and p53
Abstract
Monoubiquitination of histone H2B on lysine 120 (H2Bub1) is an epigenetic mark generally associated with transcriptional activation, yet the global functions of H2Bub1 remain poorly understood. Ferroptosis is a form of non-apoptotic cell death characterized by the iron-dependent overproduction of lipid hydroperoxides, which can be inhibited by the antioxidant activity of the solute carrier family member 11 (SLC7A11/xCT), a component of the cystine/glutamate antiporter. Whether nuclear events participate in the regulation of ferroptosis is largely unknown. Here, we show that the levels of H2Bub1 are decreased during erastin-induced ferroptosis and that loss of H2Bub1 increases the cellular sensitivity to ferroptosis. H2Bub1 epigenetically activates the expression of SLC7A11. Additionally, we show that the tumor suppressor p53 negatively regulates H2Bub1 levels independently of p53's transcription factor activity by promoting the nuclear translocation of the deubiquitinase USP7. Moreover, our studies reveal that p53 decreases H2Bub1 occupancy on the SLC7A11 gene regulatory region and represses the expression of SLC7A11 during erastin treatment. These data not only suggest a noncanonical role of p53 in chromatin regulation but also link p53 to ferroptosis via an H2Bub1-mediated epigenetic pathway. Overall, our work uncovers a previously unappreciated epigenetic mechanism for the regulation of ferroptosis.
Keywords: H2B monoubiquitination; SCL7A11; USP7; ferroptosis; p53.
© 2019 The Authors.
Conflict of interest statement
The authors declare that they have no conflict of interest.
Figures
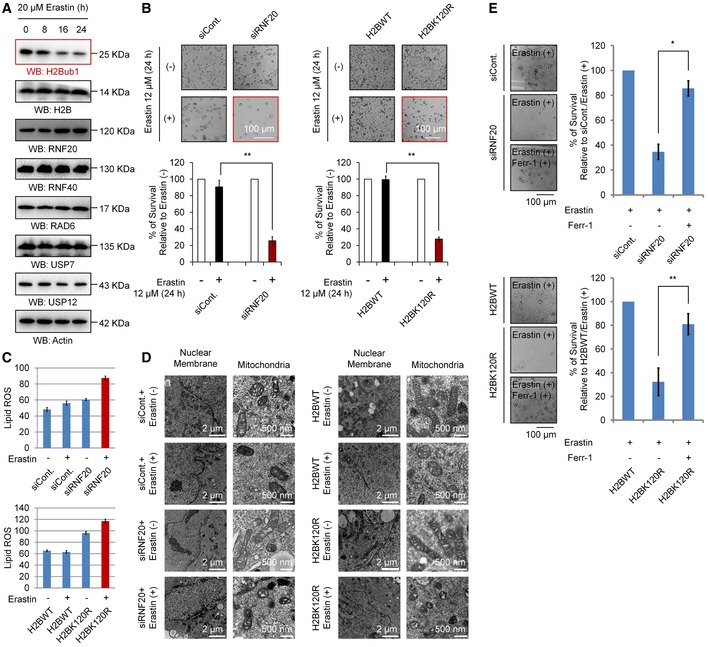
Western blot analysis of 293T cells treated with 20 μM erastin for the indicated times.
H1299 cells transfected with a control siRNA (siCont.) or an RNF20‐specific siRNA (siRNF20) and a wild‐type H2B (H2BWT) or a K120R‐mutated H2B (H2BK120R) were treated with 12 μM erastin (+) or untreated (−) for 24 h. Representative phase‐contrast images were recorded (magnification, ×20), and the surviving cells were counted.
Lipid ROS levels were assessed by flow cytometry after C11‐BODIPY staining in cells treated as in (B).
H1299 cells treated as in (B) were subjected to transmission electron microscopy. Representative images are shown.
Control H1299 cells (transfected with siCont. or H2BWT) and H2Bub1‐depleted H1299 cells (transfected with siRNF20 or H2BK120R) were treated with erastin either with or without a ferroptosis‐specific inhibitor, ferrostatin‐1 (2 μM), for 24 h. Representative phase‐contrast images were recorded (magnification, ×20), and the surviving cells were counted.
- A
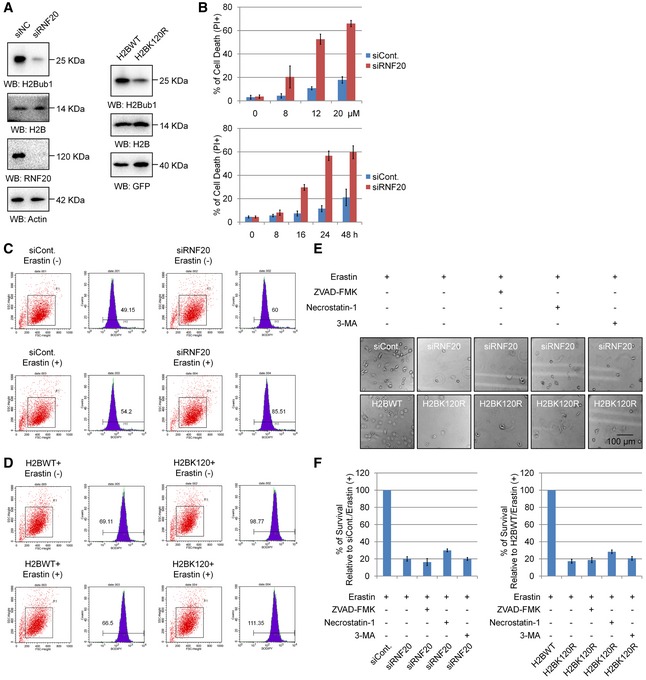
Western blot for H1299 cells transfected as indicated.
- B
H1299 cells transfected with a control siRNA (siCont.) or a RNF20‐specific siRNA (siRNF20) were treated with erastin with different dosage for 24 h or with 12 μM for different time points as indicated. Cell death was then examined by PI staining coupled with flow cytometry assay.
- C, D
H1299 cells transfected as indicated for 24 h were treated with 12 μM erastin (+) or untreated (−) for another 24 h. Cells were harvested and subjected to flow cytometry analysis by staining with C11‐BODIPY to detect lipid ROS levels.
- E, F
H1299 cells transfected with a control siRNA (siCont.) or an RNF20‐specific siRNA (siRNF20), and a wild‐type H2B (H2BWT) or a K120R‐mutated H2B (H2BK120R) were treated with 12 μM erastin for 24 h together with specific cell death inhibitors (+) or untreated (−). Representative phase‐contrast images were recorded (magnification, ×20) (E), and the surviving cells were counted (F).

qRT–PCR (left) and Western blot (right) analyses of H1299 cells transfected with a control siRNA (siCont.) or an RNF20‐specific siRNA (siRNF20) and a wild‐type H2B (H2BWT) or a K120R‐mutated H2B (H2BK120R) for 24 h.
Chromatin immunoprecipitation (ChIP) assay was carried out with anti‐H2Bub1 antibodies in H1299 cells (left) or 293T cells either untreated or treated with 20 μM erastin for 24 h (right). The intergenic region was used as a negative control for the occupancy of H2Bub1.
Intracellular GSH levels were examined in H1299 cells treated as indicated, and bar graphs are shown.
H1299 cells transfected as indicated were treated with 12 μM erastin (+) or untreated (−) for 24 h. Representative phase‐contrast images were recorded (magnification, ×20).
Surviving cells from the assay shown in (D) were counted.
GO analysis with the genes downregulated in H2BK120R (black) or RNF20‐specific siRNA (siRNF20) (red) transfected 293T cells by employing a previously reported microarray data 44.
Affected metal ion‐binding genes in (F) were selected and subjected to cluster analysis.
Labile iron levels were assessed by flow cytometry with a standard method in H1299 cells.
Labile iron levels examined in (H) were quantified.
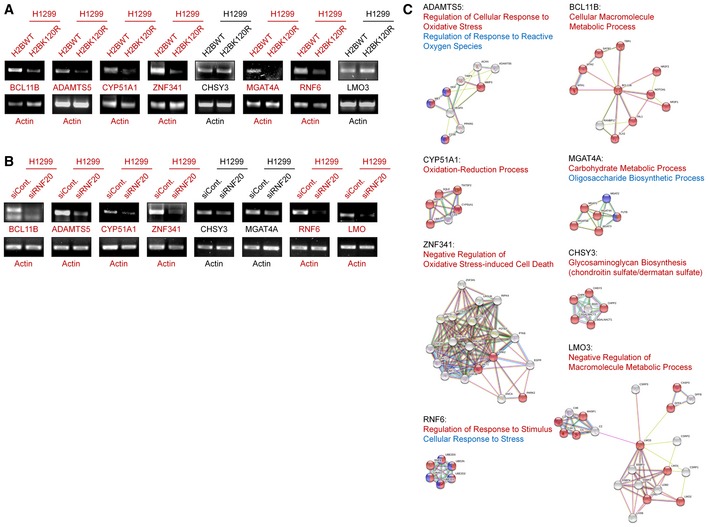
mRNA levels of H2Bub1‐affected metal ion‐binding genes in H1299 cells transfected with wild‐type H2B (H2BWT) and K120R‐mutated H2B (H2BK120R) were determined by RT–PCR analysis.
The mRNA levels of the same genes shown in (A) were tested by RT–PCR analysis in H1299 cells transfected with a control siRNA (siCont.) and an RNF20‐specific siRNA (siRNF20).
STRING analysis of the selected metal ion‐binding genes indicated that several metabolism‐related processes are involved, including multiple redox‐related events.
- A, B
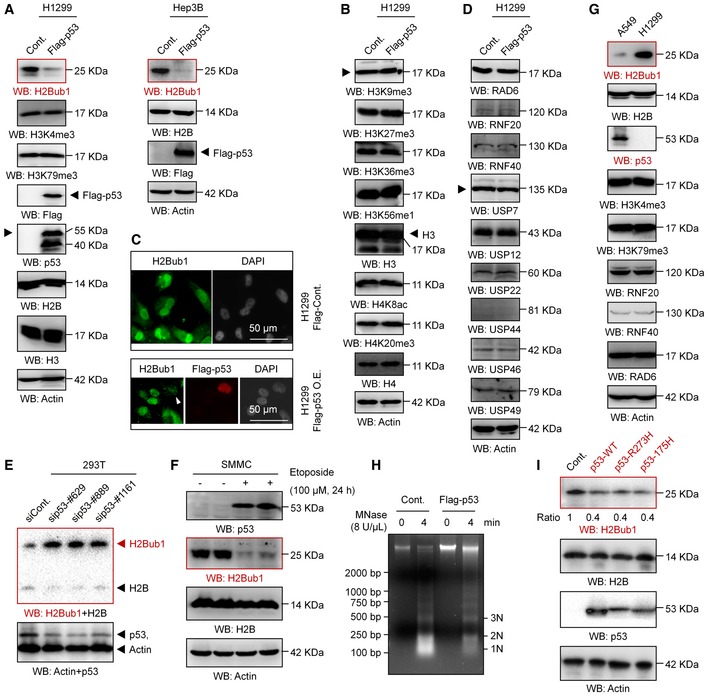
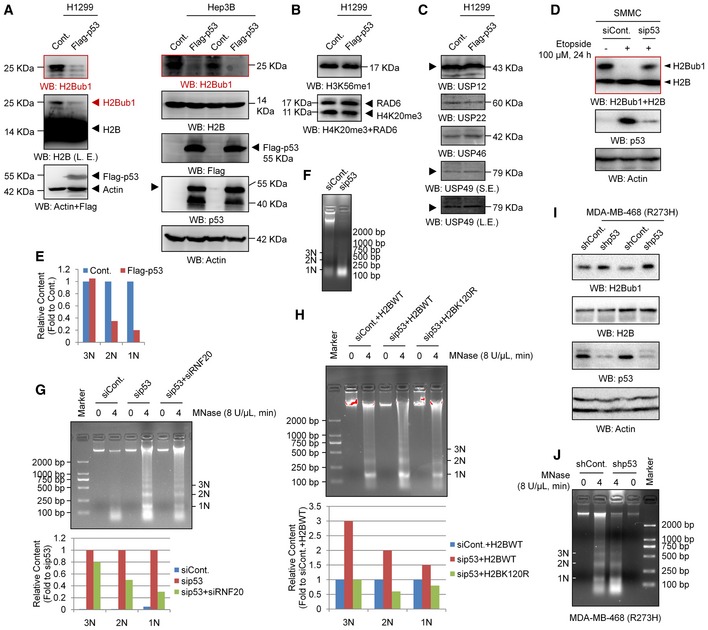
Western blot analysis was performed with H1299 or Hep3B cells transfected with a Flag‐tagged p53 or an empty plasmid (Cont.) for 48 h.
- C
Immunofluorescence (IF) assay for H1299 cells transfected with a Flag‐tagged p53 (Flag‐p53) or an empty plasmid (Cont.) for 48 h. Representative images are shown (magnification, ×40). Arrowhead indicates a Flag‐p53 overexpressing cell.
- D
Western blot analysis was performed with H1299 transfected with a Flag‐tagged p53 or an empty vector (Cont.) for 48 h.
- E
293T cells transfected with a control siRNA (siCont.) and three p53‐specific siRNAs (sip53) were subjected to Western blot analysis.
- F
SMMC cells were treated with 100 μM etoposide (+) or untreated (−) for 24 h, and Western blot analysis was performed.
- G
Western blot analysis of A549 cells and H1299 cells.
- H
H1299 cells transfected with a Flag‐tagged p53 or an empty plasmid (Cont.) were analyzed by micrococcal nuclease (MNase) digestion assay.
- I
Western blot analysis of H1299 cells transfected with a wild‐type p53 (p53‐WT) or two “gain‐of‐function” mutants (p53‐R273H and p53‐R175H) for 48 h.
- A–C
H1299 or Hep3B cells were transfected with a Flag‐tagged p53 or an empty control vector (Cont.) for 48 h followed by Western blot analysis. Arrowheads indicate the corresponding band of the indicated proteins.
- D
Control (siCont.) or p53 depleted (sip53) SMMC cells were treated with 100 μM etoposide (+) or untreated (−) for 24 h as indicated, and Western blot analysis was performed.
- E
Relative quantification of 1N–3N bands specifically corresponding to the data in Fig 3H. No replicates were involved in the band quantification.
- F
MNase digestion analysis for 293T cells transfected with a control siRNA (siCont.) or a p53‐specific siRNA.
- G
293T cells transfected with a control siRNA (siCont.), a p53‐specific siRNA (sip53), or sip53 together with an RNF20‐specific siRNA (sip53 + siRNF20) were harvested for the MNase digestion assay. Corresponding relative quantification of 1N–3N bands is shown. No replicates were involved in the band quantification.
- H
293T cells transfected with a control siRNA (siCont.), a p53‐specific siRNA (sip53) together with a wild‐type H2B (H2BWT), or a K120R‐mutated H2B (H2BK120R) as indicated for 48 h. Cells were then harvested for the MNase digestion assay. Corresponding relative quantification of 1N–3N bands is shown. No replicates were involved in the band quantification.
- I
MDA‐MB‐468 cells infected with a control shRNA (siCont.) and a p53‐specific shRNA (sip53, Santa Cruz, #sc‐29435‐V) were subjected to Western blot analysis.
- J
MNase digestion analysis for MDA‐MB‐468 cells infected with a control shRNA (siCont.) or a p53‐specific shRNA.
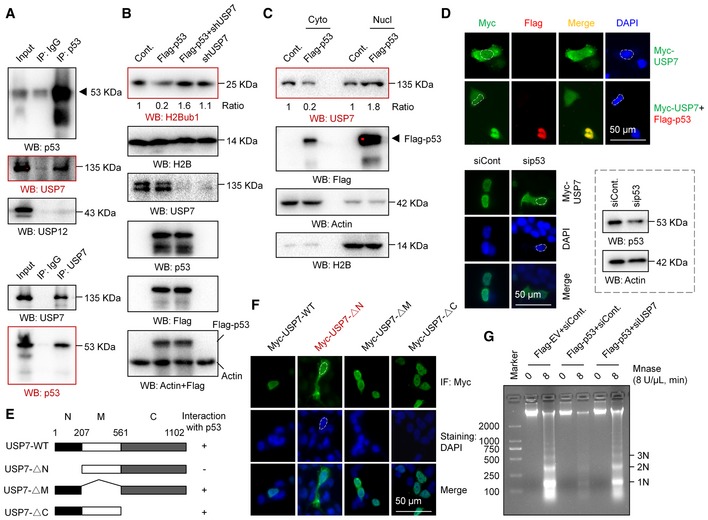
Coimmunoprecipitation (Co‐IP) analysis was performed in A549 cells with antibodies against p53 or USP7.
H1299 cells were transfected with an empty vector (Cont.), a Flag‐tagged p53, a USP7‐specific shRNA, or the last two plasmids together for 48 h. Western blot analysis was then performed.
Nuclear and cytosolic extracts were differentially prepared from H1299 cells transfected with a Flag‐tagged p53 or an empty plasmid (Cont.). Western blot analysis was then performed.
H1299 cells transfected with a Myc‐tagged USP7 or a Myc‐tagged USP7 together with a Flag‐tagged p53 were subjected to IF analysis (upper). A549 cells transfected with a p53‐specific siRNA or a control siRNA (siCont.) were examined by IF analysis, and the RNAi efficiency is shown (lower). Representative images are shown (magnification, ×40).
Diagrams showing the interaction status of USP7 and its truncated mutants (USP7‐∆N, lacking the N‐terminal region; USP7‐∆M, lacking the middle region; USP7‐∆C, lacking the C‐terminal region) with p53, based on previous reports 56, 57.
IF analysis of A549 cells transfected with a Myc‐tagged wild‐type USP7 (Myc‐USP7‐WT) or three Myc‐tagged truncated mutants. Representative images are shown (magnification, ×40).
H1299 cells were transfected with a Flag‐tagged p53 or an empty vector together with a USP7‐specific siRNA or a control siRNA as indicated for 48 h. Cells were then harvested and subjected to a MNase digestion assay.
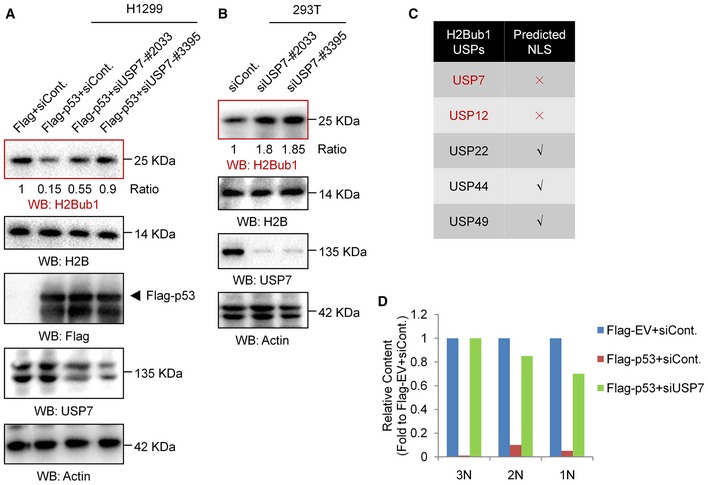
H1299 cells were transfected with an empty vector (Flag) or a Flag‐tagged p53 together with a control siRNA (siCont.) or two separate USP7‐specific shRNAs (siUSP7) for 48 h. Western blot analysis was then performed.
Western blot analysis of 293T cells transfected with a control siRNA or two separate USP7‐specific shRNAs (siUSP7).
Results of the NLS prediction analysis.
Relative quantification of 1N–3N bands specifically corresponding to the data in Fig 4G. No replicates were involved in the band quantification.
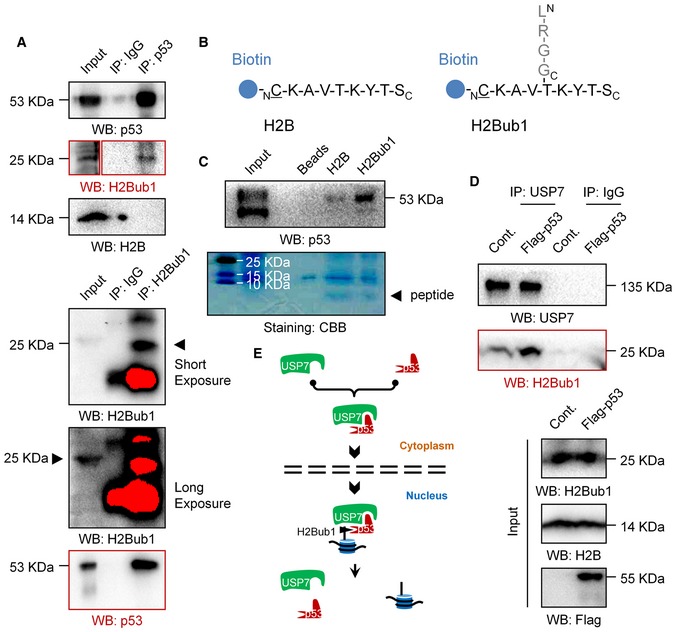
Co‐IP analysis was performed in 293T cells with antibodies against p53 or H2Bub1.
Peptide sequence synthesized according to a previous report 16, 65 and used for peptide pull‐down assay.
Peptide pull‐down assay was performed with synthesized peptides in (B).
Co‐IP analysis for H1299 cells transfected with a Flag‐tagged p53 or an empty plasmid (Cont.) treated with a USP7‐specific inhibitor P5091.
A proposed working model of the regulation of H2Bub1 by p53.
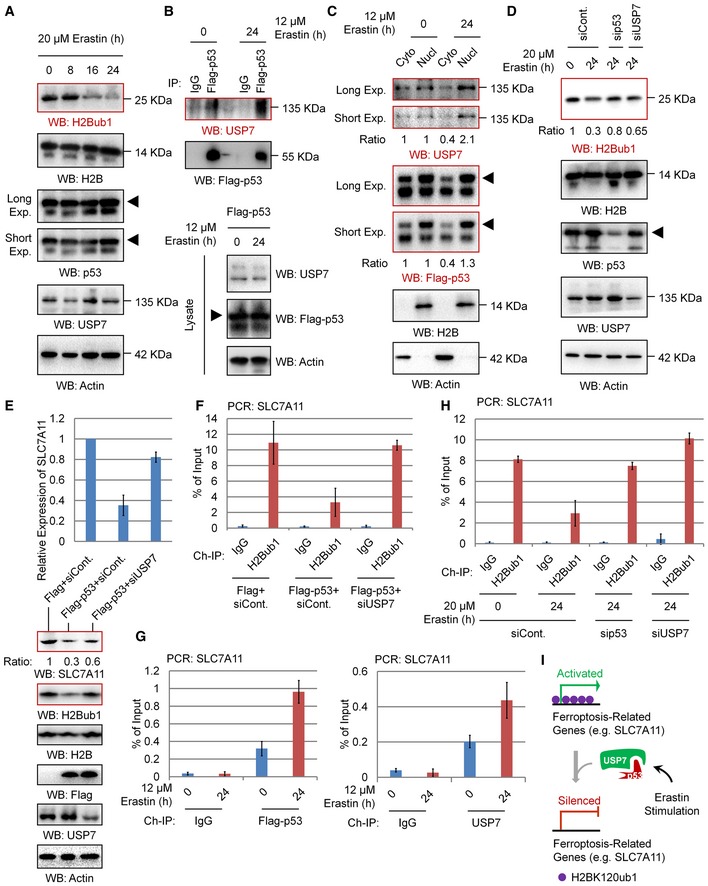
Western blot analysis of 293T cells treated with 20 μM erastin for the indicated times.
H1299 cells were transfected with Flag‐tagged p53 for 24 h and then treated with 12 μM erastin or untreated for another 24 h. Co‐IP analysis was performed with antibodies against Flag.
H1299 cells transfected with Flag‐tagged p53 were treated with erastin or untreated for 24 h. Nuclear and cytosolic extracts were differentially prepared and subjected to Western blot analysis.
293T cells transfected with a p53‐specific siRNA, a USP7‐specific siRNA, or a control siRNA (siCont.) were treated with 20 μM erastin or untreated for 24 h as indicated. Western blot analysis was then performed.
qRT–PCR (above) and Western blot (below) analyses for H1299 cells transfected with a Flag‐tagged p53 or an empty plasmid together with a USP7‐specific siRNA or a control siRNA (siCont.) as indicated.
ChIP analysis of H1299 cells transfected with a Flag‐tagged p53 or an empty plasmid together with a USP7‐specific siRNA or a control siRNA (siCont.) as indicated.
H1299 cells transfected with Flag‐tagged p53 were treated with 12 μM erastin or untreated for 24 h. ChIP analysis with antibodies against Flag or USP7 was performed.
293T cells transfected with a p53‐specific siRNA, a USP7‐specific siRNA, or a control were treated with 20 μM erastin or untreated for 24 h. ChIP analysis was performed with anti‐H2Bub1 antibodies.
A proposed working model for the p53‐USP7‐H2Bub1 axis in the regulation of SLC7A11 expression.
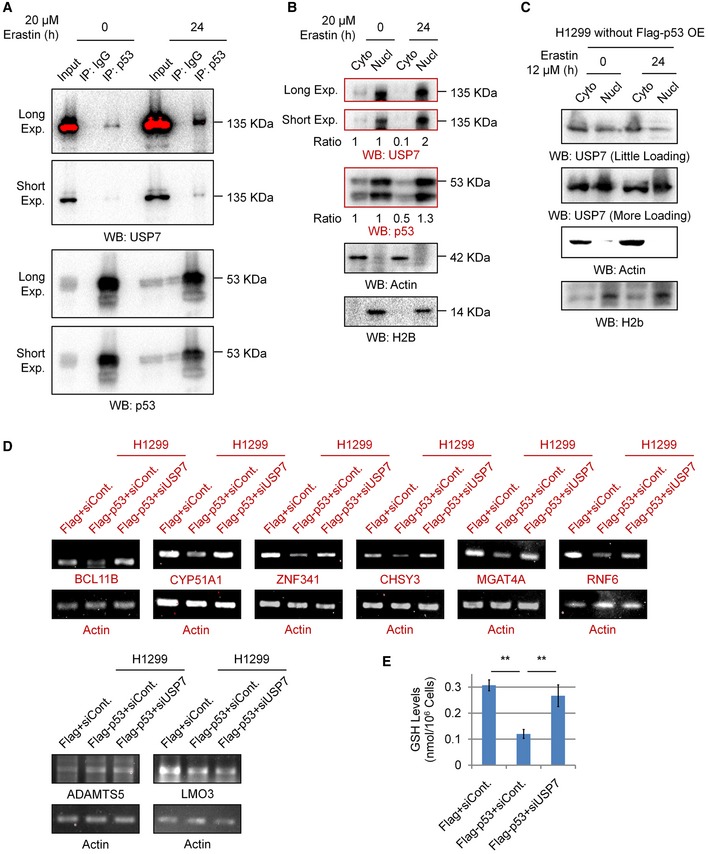
Co‐IP analysis of the endogenous interaction between p53 and USP7 in 293T cells with or without erastin treatment.
Nuclear and cytosolic extracts were differentially prepared from 293T cells treated with 20 μM erastin or untreated for 24 h. Western blot analysis was then performed to detect the levels of endogenous USP7 and p53.
H1299 cells were treated with erastin or untreated for 24 h. Nuclear and cytosolic extracts were differentially prepared and subjected to Western blot analysis.
H1299 cells were transfected with a Flag‐tagged p53 or an empty control plasmid (Flag) together with a control siRNA (siCont.) or a USP7‐specific siRNA (siUSP7) as indicated for 48 h. Cells were then lysed and subjected to RT–PCR analysis.
Intracellular GSH levels were examined in H1299 cells transfected as indicated, and bar graphs are shown.
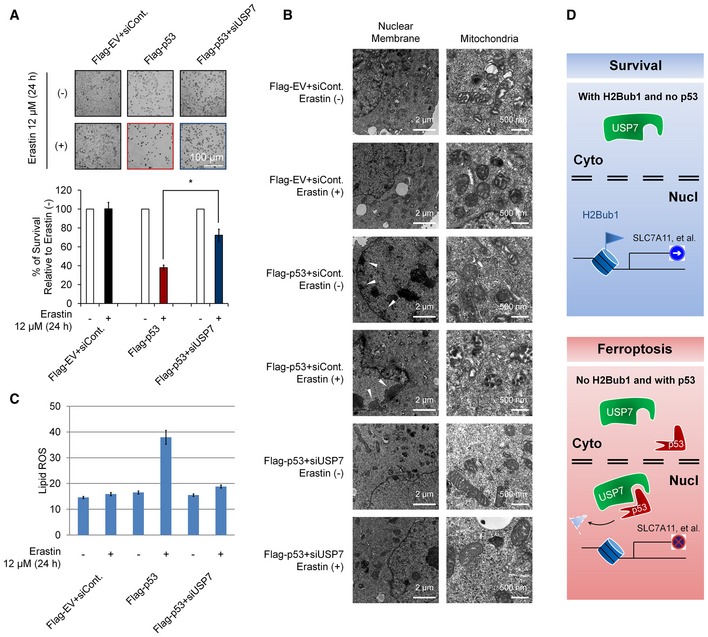
H1299 cells transfected with a Flag‐tagged p53 or an empty plasmid together with a USP7‐specific siRNA or a control siRNA (siCont.) as were treated with 12 μM erastin (+) or untreated (−) for 24 h as indicated. Representative phase‐contrast images were recorded (magnification, ×20), and the surviving cells were counted.
H1299 cells treated as in (A) were subjected to transmission electron microscopy. Representative images are shown. Arrowhead indicates condensed and marginated chromatin.
Lipid ROS levels were examined in cells treated as in (A and B).
Working model. Normal cells or cells without p53 show relatively low levels of nuclear USP7. H2Bub1 is maintained at relatively high levels and is required for normal SLC7A11 expression. However, when cells are subjected to ferroptotic stress (e.g., erastin treatment), increasing amounts of p53 interact with USP7 and promote the nuclear translocation of USP7. The translocated USP7 further removes H2Bub1 from the SLC7A11 gene regulatory region and inactivates SCL7A11 expression. Eventually, ferroptosis occurs.
References
-
- Thompson CB (1995) Apoptosis in the pathogenesis and treatment of disease. Science 267: 1456–1462 - PubMed
-
- Choi DW (1988) Glutamate neurotoxicity and diseases of the nervous system. Neuron 1: 623–634 - PubMed
-
- Dixon SJ, Stockwell BR (2014) The role of iron and reactive oxygen species in cell death. Nat Chem Biol 10: 9–17 - PubMed
Publication types
MeSH terms
Substances
Grants and funding
LinkOut - more resources
Full Text Sources
Other Literature Sources
Research Materials
Miscellaneous
