

Mutation update on ACAT1 variants associated with mitochondrial acetoacetyl-CoA thiolase (T2) deficiency
- PMID: 31268215
- PMCID: PMC6790690
- DOI: 10.1002/humu.23831
Mutation update on ACAT1 variants associated with mitochondrial acetoacetyl-CoA thiolase (T2) deficiency
Abstract
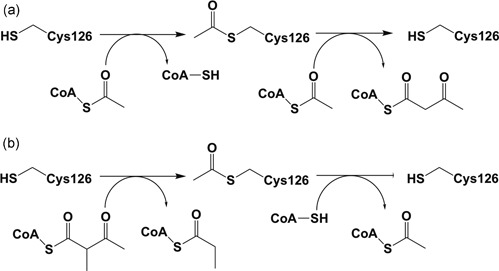
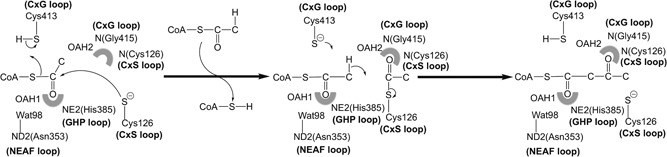
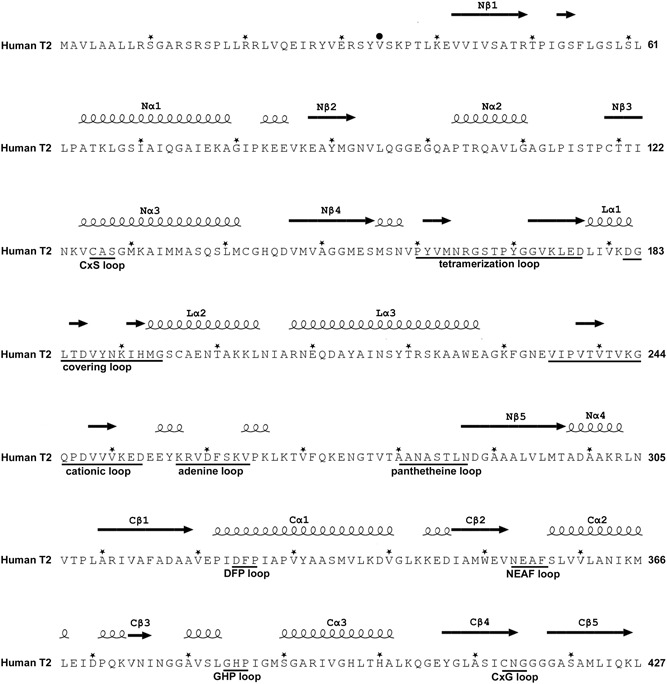
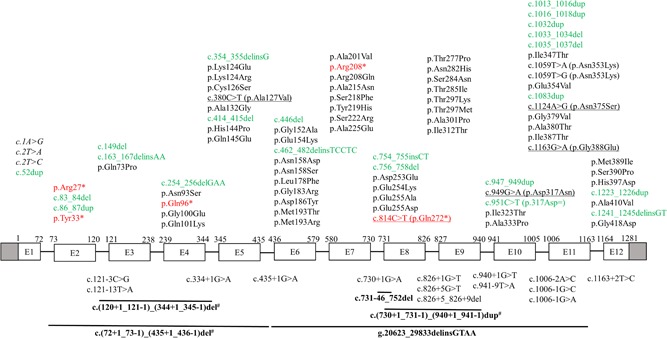
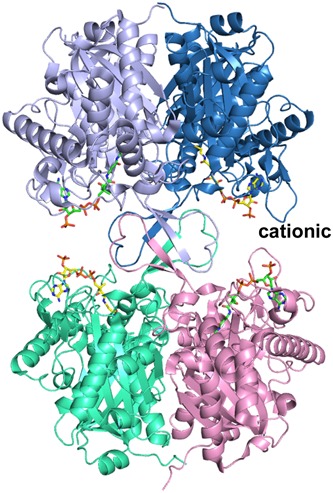
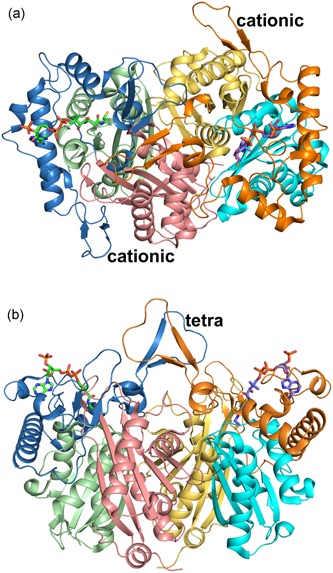
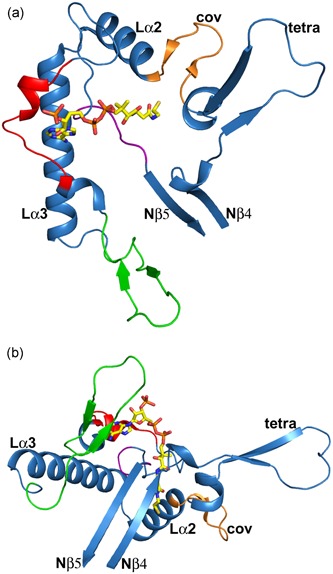
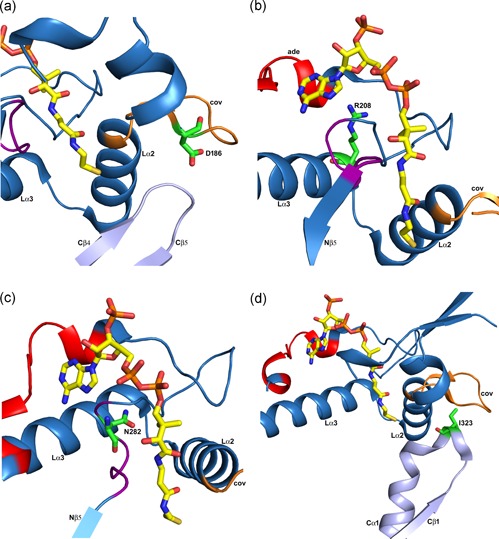
Mitochondrial acetoacetyl-CoA thiolase (T2, encoded by the ACAT1 gene) deficiency is an inherited disorder of ketone body and isoleucine metabolism. It typically manifests with episodic ketoacidosis. The presence of isoleucine-derived metabolites is the key marker for biochemical diagnosis. To date, 105 ACAT1 variants have been reported in 149 T2-deficient patients. The 56 disease-associated missense ACAT1 variants have been mapped onto the crystal structure of T2. Almost all these missense variants concern residues that are completely or partially buried in the T2 structure. Such variants are expected to cause T2 deficiency by having lower in vivo T2 activity because of lower folding efficiency and/or stability. Expression and activity data of 30 disease-associated missense ACAT1 variants have been measured by expressing them in human SV40-transformed fibroblasts. Only two variants (p.Cys126Ser and p.Tyr219His) appear to have equal stability as wild-type. For these variants, which are inactive, the side chains point into the active site. In patients with T2 deficiency, the genotype does not correlate with the clinical phenotype but exerts a considerable effect on the biochemical phenotype. This could be related to variable remaining residual T2 activity in vivo and has important clinical implications concerning disease management and newborn screening.
Keywords: ACAT1; T2-deficiency; genotype-phenotype correlation; mutations; structure; variants; β-ketothiolase deficiency.
© 2019 The Authors. Human Mutation Published by Wiley Periodicals, Inc.
Conflict of interest statement
The authors declare that there are no conflict of interests.
Figures
Similar articles
-
Beta-ketothiolase deficiency in a Malaysian infant.Med J Malaysia. 2019 Apr;74(2):174-175. Med J Malaysia. 2019. PMID: 31079130
-
Metabolic encephalopathy in beta-ketothiolase deficiency: the first report from India.Brain Dev. 2014 Jun;36(6):537-40. doi: 10.1016/j.braindev.2013.07.007. Epub 2013 Aug 16. Brain Dev. 2014. PMID: 23958592
-
Molecular characterization, clinical phenotype, and neurological outcome of twelve Palestinian children with beta-ketothiolase deficiency: report of two novel variants in the ACAT1 gene.BMC Med Genomics. 2025 Jul 1;18(1):106. doi: 10.1186/s12920-025-02175-8. BMC Med Genomics. 2025. PMID: 40598206 Free PMC article.
-
Molecular basis of beta-ketothiolase deficiency: mutations and polymorphisms in the human mitochondrial acetoacetyl-coenzyme A thiolase gene.Hum Mutat. 1995;5(2):113-20. doi: 10.1002/humu.1380050203. Hum Mutat. 1995. PMID: 7749408 Review.
-
Recent advances in understanding beta-ketothiolase (mitochondrial acetoacetyl-CoA thiolase, T2) deficiency.J Hum Genet. 2019 Feb;64(2):99-111. doi: 10.1038/s10038-018-0524-x. Epub 2018 Nov 5. J Hum Genet. 2019. PMID: 30393371 Review.
Cited by
-
Emphasizing the need for preconceptional, prenatal genetic counseling and comprehensive genetic testing in consanguinity: challenges and experience.Mol Genet Genomics. 2024 Oct 4;299(1):91. doi: 10.1007/s00438-024-02187-6. Mol Genet Genomics. 2024. PMID: 39365491
-
ACAT2 suppresses the ubiquitination of YAP1 to enhance the proliferation and metastasis ability of gastric cancer via the upregulation of SETD7.Cell Death Dis. 2024 Apr 26;15(4):297. doi: 10.1038/s41419-024-06666-x. Cell Death Dis. 2024. PMID: 38670954 Free PMC article.
-
C4OH is a potential newborn screening marker-a multicenter retrospective study of patients with beta-ketothiolase deficiency in China.Orphanet J Rare Dis. 2021 May 17;16(1):224. doi: 10.1186/s13023-021-01859-5. Orphanet J Rare Dis. 2021. PMID: 34001203 Free PMC article.
-
Not Just an Alternative Energy Source: Diverse Biological Functions of Ketone Bodies and Relevance of HMGCS2 to Health and Disease.Biomolecules. 2025 Apr 14;15(4):580. doi: 10.3390/biom15040580. Biomolecules. 2025. PMID: 40305364 Free PMC article. Review.
-
Lipid metabolism in pancreatic cancer: emerging roles and potential targets.Cancer Commun (Lond). 2022 Dec;42(12):1234-1256. doi: 10.1002/cac2.12360. Epub 2022 Sep 15. Cancer Commun (Lond). 2022. PMID: 36107801 Free PMC article. Review.
References
-
- Abdelkreem, E. , Otsuka, H. , Sasai, H. , Aoyama, Y. , Hori, T. , Abd El Aal, M. , … Fukao, T. (2016). Beta‐ketothiolase deficiency: Resolving challenges in diagnosis. Journal of Inborn Errors of Metabolism & Screening, 4, 1–9. 10.1177/2326409816636644 - DOI
-
- Abdelkreem, E. , Alobaidy, H. , Aoyama, Y. , Mahmoud, S. , Abd El Aal, M. , & Fukao, T. (2017). Two Libyan siblings with beta‐ketothiolase deficiency: A case report and review of literature. Egyptian Journal of Medical Human Genetics, 18(2), 199–203. 10.1016/j.ejmhg.2016.11.001 - DOI
-
- Alijanpour, M. , Sasai, H. , Abdelkreem, E. , Ago, Y. , Soleimani, S. , Moslemi, L. , … Fukao, T. (2019). Beta‐ketothiolase deficiency: A case with unusual presentation of nonketotic hypoglycemic episodes due to coexistent probable secondary carnitine deficiency. JIMD Reports, 46(1), 23–27. 10.1002/jmd2.12022 - DOI - PMC - PubMed
Publication types
MeSH terms
Substances
Supplementary concepts
Grants and funding
LinkOut - more resources
Full Text Sources
Medical
Miscellaneous
