. 2019 Nov;12(6):600-608.
doi: 10.1111/cts.12662. Epub 2019 Jul 26.

A Modeling Framework to Characterize Cytokine Release upon T-Cell-Engaging Bispecific Antibody Treatment: Methodology and Opportunities

Affiliations

A Modeling Framework to Characterize Cytokine Release upon T-Cell-Engaging Bispecific Antibody Treatment: Methodology and Opportunities

Xiaoying Chen et al. Clin Transl Sci. 2019 Nov.

Abstract

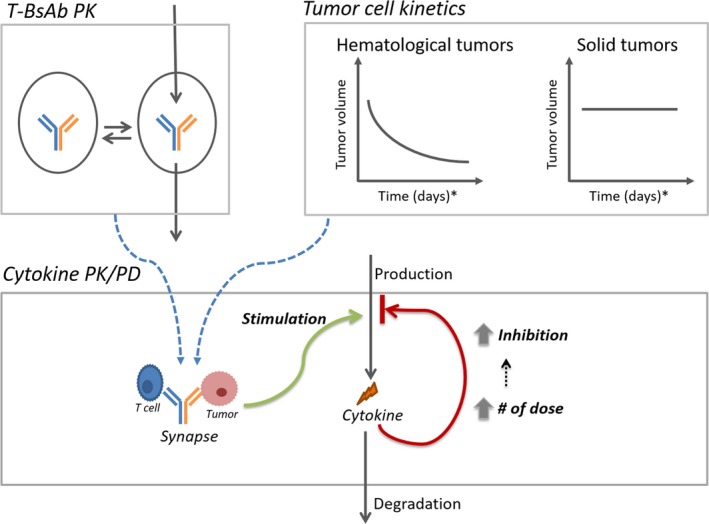
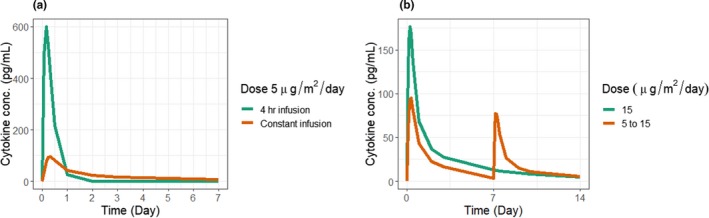
T-cell-engaging bispecific antibodies (T-BsAbs) are an important class of antibody therapeutics in immuno-oncology. T-BsAbs simultaneously bind to CD3 on T cells and a tumor-associated antigen on tumor cells, activate T cells, and redirect T cells' cytotoxicity against tumor cells. Cytokine release syndrome (CRS), a common dose-limiting adverse event for T-BsAbs, is associated with T-cell activation. A "priming" dose strategy (i.e., a lower initial dose followed by a higher maintenance dose) has been implemented in the clinic to mitigate CRS and to achieve efficacious doses with T-BsAbs. So far, the selection of the optimal priming dosing regimen is largely empirical. A "fit-for-purpose" semimechanistic pharmacokinetic/pharmacodynamic model was developed to characterize the cytokine release profiles upon T-BsAb treatment, including the priming effect observed with repeated dosing. This model can be utilized to simulate cytokine profiles following various dosing regimens and may assist the design of clinical dosing strategies for T-BsAbs programs.


Conflict of interest statement

X.C., C.K., G.W., and D.X. are employed by Pfizer and hold stock in Pfizer.

Figures

Figure 1
Figure 1
Cytokine pharmacokinetic/pharmacodynamic (PK/PD) model structure. Model details are described in the methods section. Briefly, an appropriate PK model accounts for the drug exposure. Depending on the tumor type (hematological or solid), the tumor kinetics are accounted for in the model to account for the impact of tumor burden on the active synapse concentration. For the cytokine PD model, the synapse exposure then stimulates cytokine release. A time‐variant negative feedback loop accounts for the priming effect, where the negative inhibition increases with the increasing number of doses. T‐BsAb, T‐cell–engaging bispecific antibody.
Figure 2
Figure 2
Fitting results for blinatumomab in patients. (a) Model predictions and observed data for cytokine concentration with a priming dose regimen of 5 μg/m2/day followed by 15 μg/m2/day. Symbols represent individual observations, and lines represent the model fit. (b) Model predictions and observed data for cytokine concentration with a single dose at 60 μg/m2/day. Symbols represent individual observations, and lines represent the model fit. (c) Concordance plot between the data (DV) and the model prediction (PRED). The dotted line is the line of unity. (d) Weighted residual error (WRES) against the PRED.
Figure 3
Figure 3
Fitting results for P‐cadherin LP DART in cynomolgus monkeys under repeated dosing regimens. Model predictions and observed data for IL‐6 concentration with repeated doses at 0.3, 1.5, 7.5, 15, and 30 μg/kg. Symbols (observations); lines (model fit).
Figure 4
Figure 4
Fitting results for P‐cadherin LP DART in cynomolgus monkeys under priming dose regimens. Model predictions and observed data for IL‐6 concentration with priming dose regimens at 1.1/3.3, 3.3/10, 5/30, 10/20, and 10/30 μg/kg. Symbols (observations); lines (model fit).
Figure 5
Figure 5
Diagnostic plots for the P‐cadherin LP DART IL‐6 data fitting. (a) Concordance plot between data (natural log transformed dependent variable (LNDV)) and model prediction (PRED). Dotted line is the line of unity. (b) Weighted residual error (WRES) against PRED.
Figure 6
Figure 6
Simulated cytokine profiles for blinatumomab with different dosing regimens. (a) Simulated cytokine profile with 4‐hour infusion or constant infusion at 5 μg/m2/day. (b) Simulated cytokine profile with single dose at 15 μg/m2/day or a priming dose of 5 μg/m2/day followed by 15 μg/m2/day.

References

    1. Wu, Z. & Cheung, N.V. T cell engaging bispecific antibody (T‐BsAb): from technology to therapeutics. Pharmacol. Ther. 182, 161–175 (2018). - PMC - PubMed
    1. Lee, D.W. et al Current concepts in the diagnosis and management of cytokine release syndrome. Blood 124, 188–195 (2014). - PMC - PubMed
    1. Frey, N. Cytokine release syndrome: who is at risk and how to treat. Best Pract. Res. Clin. Haematol. 30, 336–340 (2017). - PubMed
    1. Nagorsen, D. , Kufer, P. , Baeuerle, P.A. & Bargou, R. Blinatumomab: a historical perspective. Pharmacol. Ther. 136, 334–342 (2012). - PubMed
    1. Nagele, V. et al Changes in clinical laboratory parameters and pharmacodynamic markers in response to blinatumomab treatment of patients with relapsed/refractory ALL. Exp. Hematol. Oncol. 6, 14 (2017). - PMC - PubMed

MeSH terms

LinkOut - more resources