. 2019 Jul 3:8:e46080.
doi: 10.7554/eLife.46080.

The hippocampus supports deliberation during value-based decisions

Affiliations

The hippocampus supports deliberation during value-based decisions

Akram Bakkour et al. Elife. .

Abstract

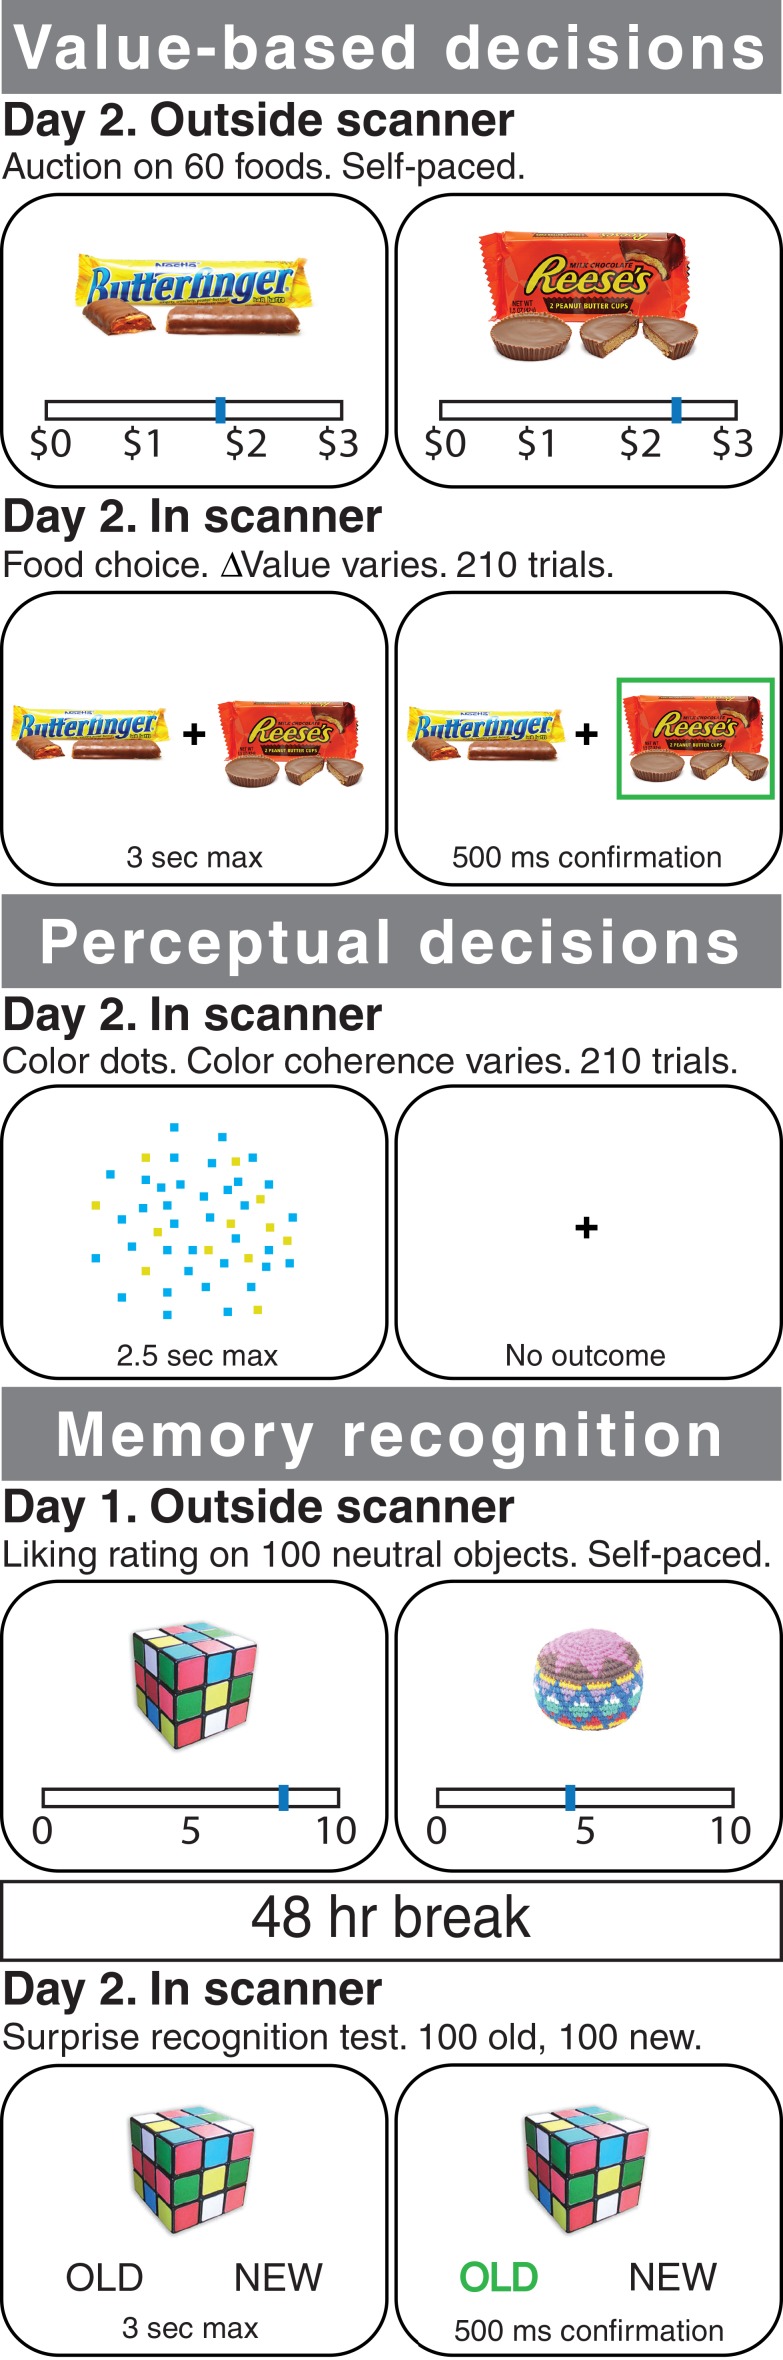
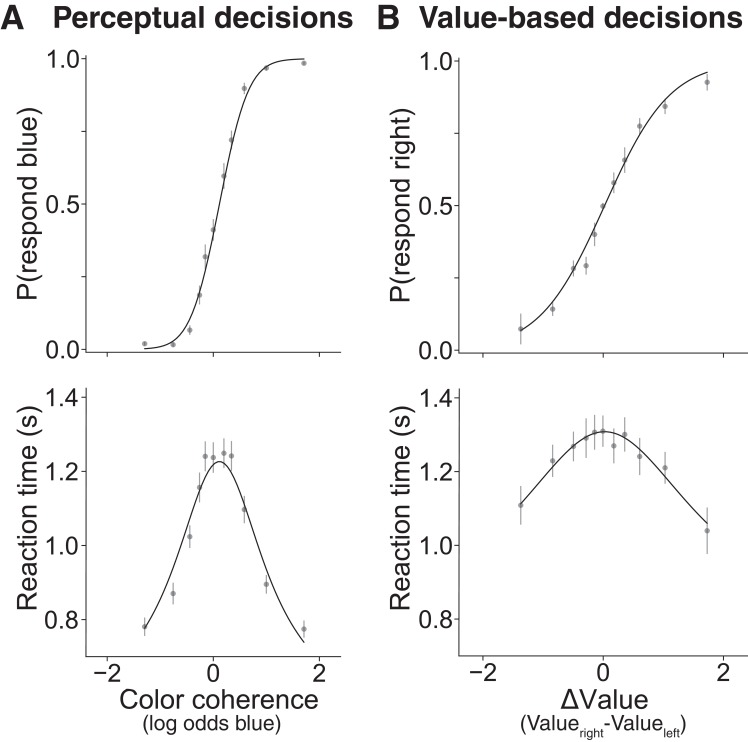
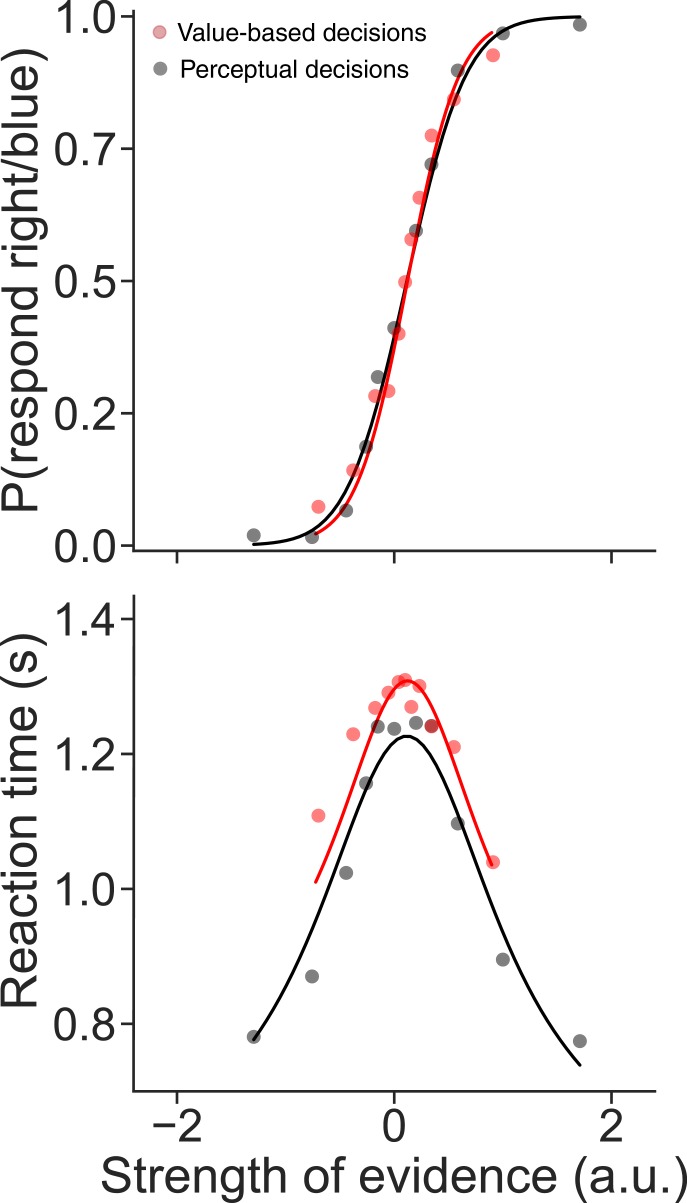
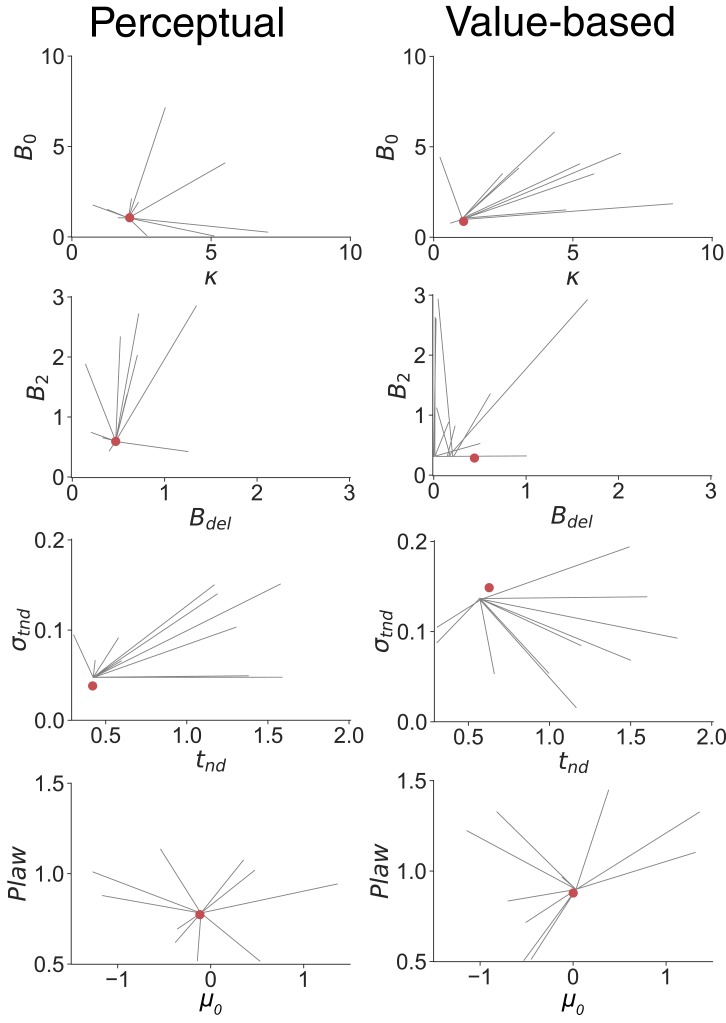
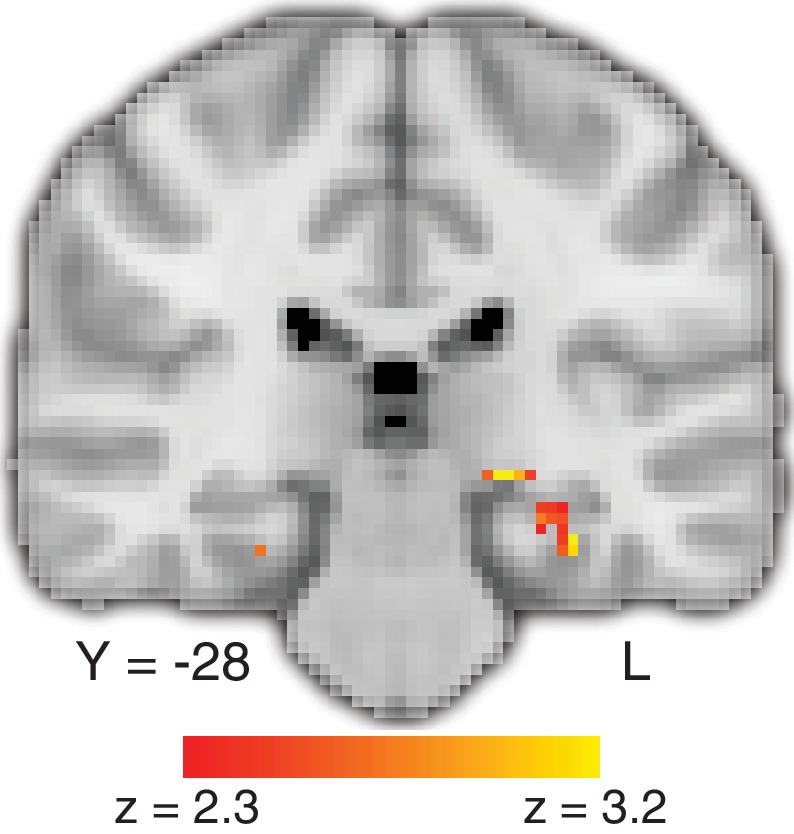
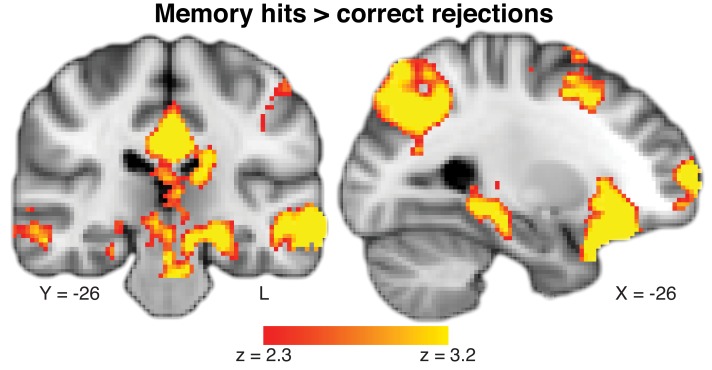
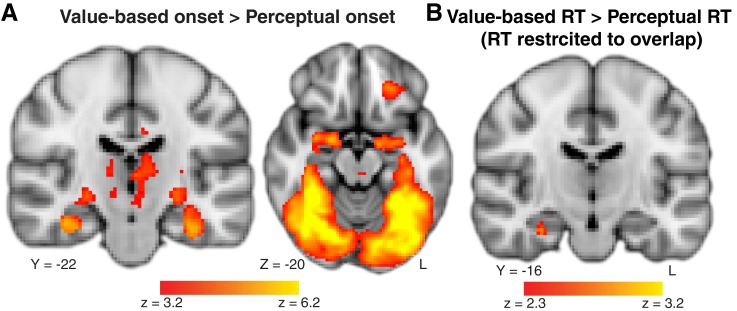
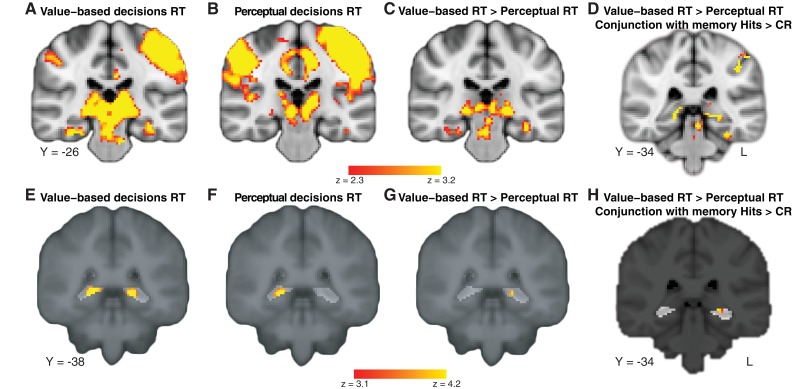
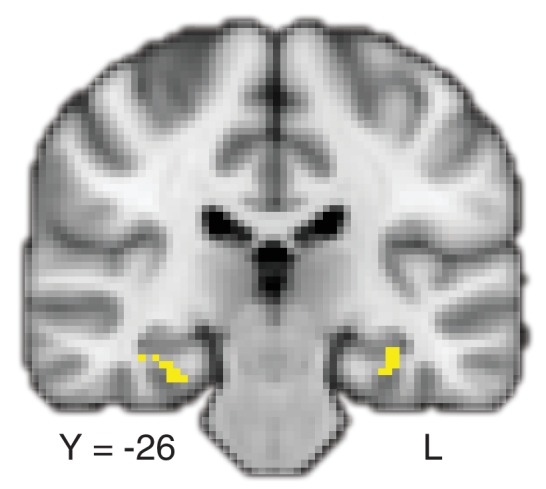
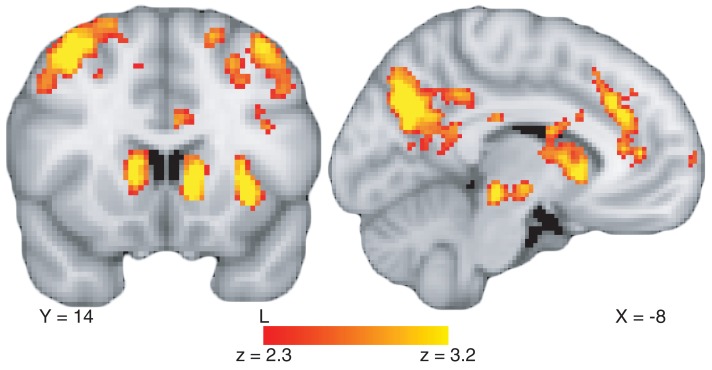
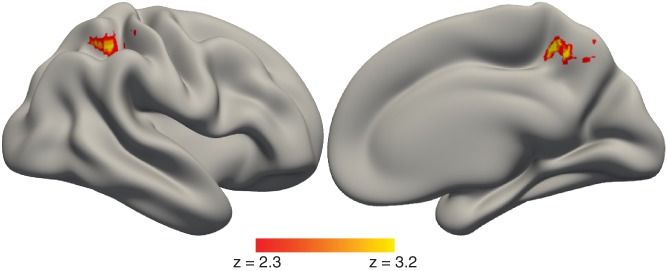
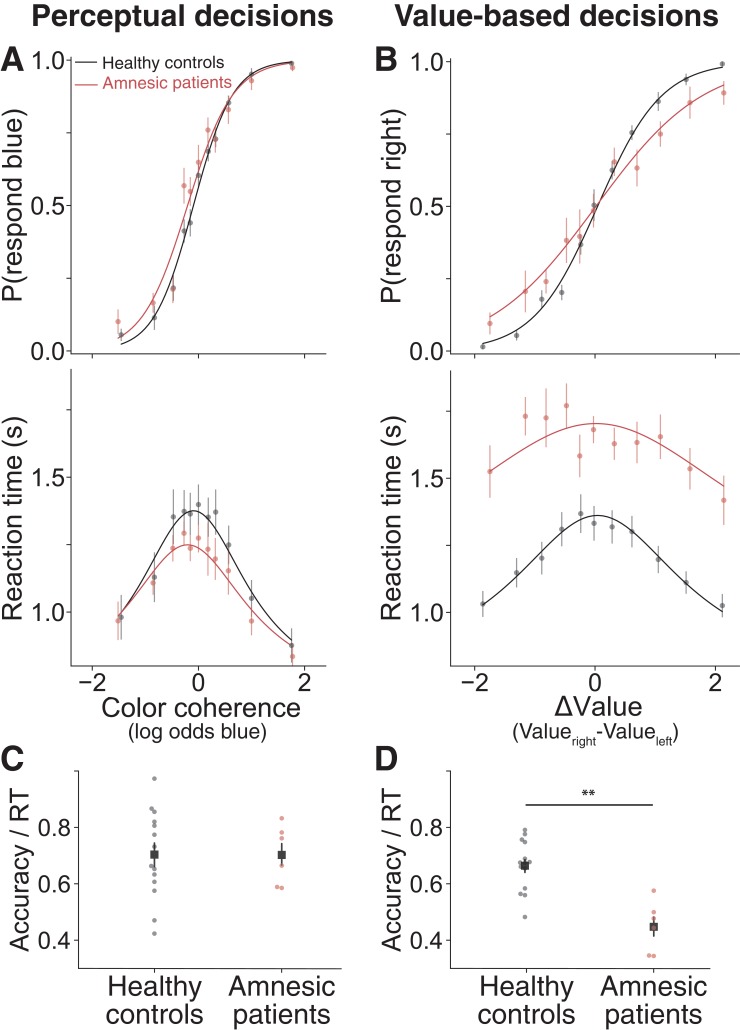
Choosing between two items involves deliberation and comparison of the features of each item and its value. Such decisions take more time when choosing between options of similar value, possibly because these decisions require more evidence, but the mechanisms involved are not clear. We propose that the hippocampus supports deliberation about value, given its well-known role in prospection and relational cognition. We assessed the role of the hippocampus in deliberation in two experiments. First, using fMRI in healthy participants, we found that BOLD activity in the hippocampus increased as a function of deliberation time. Second, we found that patients with hippocampal damage exhibited more stochastic choices and longer reaction times than controls, possibly due to their failure to construct value-based or internal evidence during deliberation. Both sets of results were stronger in value-based decisions compared to perceptual decisions.

Keywords: Amnesia; decision making; fMRI; hippocampus; human; neuroscience.


Conflict of interest statement

AB, DP, AZ, YK, AR, MV, MS, DS No competing interests declared

Figures

Figure 1.
Figure 1.. Experimental tasks.
In Experiment 1, healthy participants were scanned with fMRI during three different tasks: a value-based decision task (top), a perceptual decision task (middle), and a memory recognition task (bottom). In the value-based decision task, participants were presented with 150 pairs of foods that differed on ∆Value (based on a pre-task auction procedure for rating the items; see Materials and methods). Participants were told to choose the item that they preferred and that their choice on a randomly selected trial would be honored at the end of the experiment. In the perceptual decision task, participants were presented with 210 trials of a cloud of flickering blue and yellow dots that varied in the proportion of blue versus yellow (color coherence). Participants were told to determine whether the display was more blue or more yellow. In the recognition memory localizer task, participants underwent a standard recognition task using incidental encoding of everyday objects: first, they rated 100 objects (outside of the scanner); 48 hr later they were presented with a surprise memory test in the scanner, in which ‘old’ objects were intermixed with 100 ‘new’ objects, one at a time, and participants were asked to indicate whether each object was ‘old’ or ‘new’. In Experiment 2, amnesic patients with MTL damage and healthy controls performed variants of the value-based and perceptual decision tasks (see Materials and methods).
Figure 2.
Figure 2.. Choices between options that are similar take more time for both perceptual and value-based decisions in Experiment 1.
Behavioral results from 30 young healthy participants for (A) perceptual and (B) value-based decisions. (A) Proportion of blue choices (top) and mean RT (bottom) plotted as a function of signed color coherence (the logarithm of the odds that a dot is plotted as blue). (B) Proportion of right item preference (top) and mean RT (bottom) plotted as a function of value difference (the subjective value of the item on the right side of the screen minus the subjective value of the item on the left) binned into eleven levels. Gray symbols are means (error bars are s.e.m.); solid black lines are fits to drift diffusion models. See Figure 2—figure supplement 1 for fits to data from individual participants. See Figure 2—figure supplement 3 for parameter recovery analysis.
Figure 2—figure supplement 1.
Figure 2—figure supplement 1.. Data and fits for value-based and perceptual decisions per participant in Experiment 1.
Light lines are running means. Dots are means and error bars are standard errors of the mean. Solid lines are model fits.
Figure 2—figure supplement 2.
Figure 2—figure supplement 2.. Comparison of data and fits from Figure 2 after rescaling the units of evidence.
The ΔValue was transformed by scaling plus a constant such that logistic fits of the choice functions on the perceptual (black) and value tasks (red) were matched. The data and fits to drift diffusion, shown here, are identical to those in Figure 2 except for the transformation of ∆Value.
Figure 2—figure supplement 3.
Figure 2—figure supplement 3.. Parameter recovery analysis.
The eight-parameter drift-diffusion model fit to the data in Figure 2 (main text) may settle on local minima. For this reason, we report the best of 100 fits using initial parameter vectors spanning ranges displayed on the axes shown here. The 8 parameters of the best fits are represented by the red dots in the four graphs in the left and right columns (Perceptual and Value based fits, as indicated. Red dot values are provided in Figure 2—source data 1 for ALL participants). These are 2D projections of the 8D fits. Here, we repeat the procedure another 10 times by performing 1000 fits to simulated data with random starting vectors using uniformly distributed elements around the reported best fits. Axes represent the range of the uniform distributions from which initial starting values were sampled. For each set of 100 fits to the simulated data, we took the best fit, thereby mimicking the procedure used to obtain fits to the actual data (see Materials and methods). Gray lines represent the ten starting points (end of lines further from the red dot) and the corresponding best fit parameter values (end of lines nearer the red dot). The exercise recovers the fit parameters (red dots), with the following exceptions. There is a systematic offset of the standard deviation of the non-decision time σtnd and/or the tnd in the recovered simulated data, which probably reflects a difference in the simulated data set. The failure to recover the terms governing the dynamics of bound collapse (B2 and Bdel; Value-based only) is a sign of over-fitting.
Figure 3.
Figure 3.. Deliberation time during value-based decisions is related to activation in the hippocampus.
The figure shows a representative slice at the level of the hippocampus. The map exploits all three tasks and shows a comparison of the effect of trial-by-trial RT on value-based decisions with perceptual decisions, localized (with a conjunction analysis) to regions of the brain that also show a memory-retrieval effect. The full map can be viewed at https://neurovault.org/collections/BOWMEEOR/images/56727. This effect in the hippocampus was replicated with a separate analysis controlling for potential confounds (e.g. mean value across items in a pair; Figure 3—figure supplement 3D). Coordinates reported in standard MNI space. Heatmap color bars range from z-stat = 2.3 to 3.2. The map was cluster corrected for familywise error rate at a whole-brain level with an uncorrected cluster-forming threshold of z = 2.3 and corrected extent threshold of p<0.05.
Figure 3—figure supplement 1.
Figure 3—figure supplement 1.. Parametric map of main effect of hits versus correct rejections during memory recognition.
This map was used in the conjunction map presented in Figure 3. Coordinates reported in standard MNI space. Heatmap color bars range from z-stat = 2.3 to 3.2. The map was cluster corrected for familywise error rate at a whole-brain level with an uncorrected cluster-forming threshold of z = 2.3 and corrected extent threshold of p<0.05. To see the full uncorrected map, go to https://neurovault.org/collections/BOWMEEOR/images/56726.
Figure 3—figure supplement 2.
Figure 3—figure supplement 2.. Control analyses to consider alternative explanations for the differential hippocampal activation on value-based versus perceptual tasks.
(A) Main effect of task type on whole-brain BOLD activity at stimulus onset. We find very strong ventral stream and hippocampus activation for the value-based compared to the perceptual decision task. This is not surprising as ventral stream activity is crucial to recognition of objects such as the food items used. To see the full uncorrected map, go to https://neurovault.org/collections/BOWMEEOR/images/56728. (B) Modulated effect of value-based compared to perceptual RT on whole-brain BOLD activity, restricted to the range of RTs that overlap across the two tasks. Even when restricting the range in RT to be equivalent across value-based and perceptual decision tasks, we still observed a more positive relationship between BOLD in the hippocampus and RT during value-based when compared to perceptual decisions, confirming the results from a simpler model in Figure 3 and a more complex model in Figure 3—figure supplement 3. To see the full uncorrected map, go to https://neurovault.org/collections/BOWMEEOR/images/56729. Coordinates reported in standard MNI space. Heatmap color bars range from z-stat = 3.2 to 6.2 in (A) and z-stat = 2.3 to 3.2 in (B). These maps were cluster-corrected at a whole-brain level p<0.05.
Figure 3—figure supplement 3.
Figure 3—figure supplement 3.. Deliberation time during value-based decisions is related to activation in the hippocampus using a more complex model.
Parametric maps of the modulated effect of RT on BOLD in (A) value-based (to see the full uncorrected map, go to https://neurovault.org/collections/BOWMEEOR/images/56731) and (B) perceptual decisions (to see the full map, go to https://neurovault.org/collections/BOWMEEOR/images/56732) separately in a model that includes several regressors (e.g. mean of pair values, see Materials and methods). (C) The contrast between maps in (A) and (B) (to see the full map, go to https://neurovault.org/collections/BOWMEEOR/images/56730). (D) conjunction of the contrast in panel C and the memory contrast of Hits > Correct rejections. Coordinates reported in standard MNI space. Heatmap color bars for (A–D) range from z-stat = 2.3 to 3.2. Maps in (A–D) were cluster corrected for familywise error rate at a whole-brain level with an uncorrected cluster-forming threshold of z = 2.3 and corrected extent threshold of p<0.05. Parametric maps of the modulated effect of RT on hippocampal BOLD in (E) value-based (same as (A and F) perceptual decisions (same as B) separately. (G) The contrast between maps in (A and B) (same as C). (H) The same conjunction as in (D). Heatmap color bars for (E–H) range from z-stat = 3.1 to 4.2. Maps in (E–H) were small-volume corrected within an anatomical mask of bilateral hippocampus with a voxel-level threshold of p<0.05.
Figure 3—figure supplement 4.
Figure 3—figure supplement 4.. Timing of value-based decisions is related to activation in memory-localized regions of the hippocampus.
Three-way conjunction between the map of RTvalue-based >RTperceptual, and two meta-analysis maps downloaded from neurosynth.org based on the terms ‘autobiographical memory’ and ‘recollection’. Highlighted voxels crossed the statistical threshold in all three maps corrected for multiple comparisons.
Figure 3—figure supplement 5.
Figure 3—figure supplement 5.. Value-coding brain regions.
Modulated effect of the value of the chosen food. Positive values indicate a more positive relationship between the value of the chosen item and BOLD. To see the full uncorrected map, go to https://neurovault.org/collections/BOWMEEOR/images/125281. Coordinates reported in standard MNI space. Heatmap color bars range from z-stat = 2.3 to 3.2. The map was cluster corrected for familywise error rate at a whole-brain level with an uncorrected cluster-forming threshold of z = 2.3 and corrected extent threshold of p<0.05.
Figure 4.
Figure 4.. Timing of value-based decisions is related to functional coupling between the hippocampus and parietal cortex.
Lateral (left) and medial (right) view of a semi-inflated surface of a template brain. PPI results were projected onto the cortical surface. There was a stronger correlation in activity between the hippocampus and the parietal cortex when value-based decisions took more time. The full map can be viewed at https://neurovault.org/collections/BOWMEEOR/images/129376. Heatmap color bars range from z-stat = 2.3 to 3.2. The map was cluster corrected for familywise error rate at a whole-brain level with an uncorrected cluster-forming threshold of z = 2.3 and corrected extent of p<0.05.
Figure 5.
Figure 5.. Amnesic patients exhibited more stochastic choices and longer reaction times on value-based decisions but not perceptual decisions.
(A) Proportion of blue choices (top) and mean RT (bottom) plotted as a function of signed color coherence, the logarithm of the odds that a dot is plotted as blue. Data from 14 healthy controls and six amnesic patients (2922 and 1246 trials, respectively). (B) Proportion of right-item preference (top) and mean RT (bottom) plotted as a function of value difference (right minus left) binned into 11 levels. Data from 14 healthy controls and six amnesic patients (2893 and 1118 trials, respectively). To further summarize these findings, we plot individual average speed-adjusted accuracy, calculated as average accuracy divided by average RT per participant during (C) perceptual decisions and (D) value-based decisions (here, accuracy is defined as choices that are consistent with the individuals’ initial value ratings). Circle symbols are data from amnesic patients (red) and healthy age-matched controls (black). Square symbols are group averages. Error bars are s.e.m. Curves are fits of a bounded drift diffusion model (see Materials and methods). See Figure 5—figure supplement 4 for fits to data from individual participants, Figure 5—source data 1 for model parameters fit to data from individual participants, and Figure 5—figure supplement 2 for consideration of an alternative model.
Figure 5—figure supplement 1.
Figure 5—figure supplement 1.. Distributions of value ratings and resulting ΔValues used during the choice phase.
Probability histogram of (A) value ratings from the rating phase and of (B) the resulting ΔValues in the choice phase for healthy participants (black) and amnesic patients (red). The solid lines are univariate kernel density estimates fit to the data. Healthy controls and amnesic patients use the full range of the rating scale when valuing individual items. The resulting distribution of ΔValues calculated from these value ratings in both groups are largely overlapping.
Figure 5—figure supplement 2.
Figure 5—figure supplement 2.. Support for a qualitative prediction of a heuristic decision strategy in the amnesic patient group.
We evaluated a heuristic model in which choices and RT were governed by a small set of items that were either strongly liked or disliked and thus induce fast ‘trivial’ decisions. The remainder of ‘non-trivial’ decisions are stochastic and slow, accounting for the majority of trials. The model posits that RT is not governed by ∆Value but by whether the comparison is trivial or non-trivial. This qualitative prediction is refuted in panels (A and B) (healthy participants, p<0.005), but not in panel (C) (amnesic patients; p=0.29). Fits to establish the best criterion for the trivial/non-trivial designation were established for each participant. Solid lines are least square fits to mean RT for choices between items, aggregated across participants. Shaded area is the bootstrapped 90% confidence interval for the regression slope estimate. Points and error bars (means ± s.e.m.) are plotted corresponding to the bins of ∆Value shown in other RT graphs (e.g., Figures 2 and 5). The dashed lines are the predictions from the best fitting heuristic model: the mean RT from all trials that the model designates as non-trivial. Other qualitative predictions of the model are not well supported. For example, there is no criterion on item ratings that satisfies the trivial/non-trivial distinction. No values of k1 and k2 identify trivial trials for which choices are fully consistent with the heuristic model prediction, as shown by the heat maps. Insets show the proportion of trials in which participants chose the item that should be chosen trivially, based on the heuristic. The range of potential criteria (k1,2) span the highest and lowest tertiles of the values derived from the auction (A) and the rating scales (B,C). The cell marked X contains no data. The heuristic model also does not explain why the patients are slow overall (especially on trivial decisions; not shown). The heuristic model does not outperform the drift diffusion model for any of the groups, but it highlights a qualitative distinction between the amnesic patients and the other healthy groups. See Materials and methods for additional details.
Figure 5—figure supplement 3.
Figure 5—figure supplement 3.. Brain images for five out of six amnesic patients included in experiment 2.
MRI images for four patients (T1-weighted images for P02, P03, and P06, and T2-weighted images for P05 are presented), and computed tomography (CT) images for patient P01 show damage to the hippocampus in all cases. Brain images are not available for the sixth patient.
Figure 5—figure supplement 4.
Figure 5—figure supplement 4.. Data and fits for value-based and perceptual decisions per participant in Experiment 2.
Light lines are running means. Dots are means and error bars are standard errors of the mean. Solid lines are model fits.
Author response image 1.
Author response image 1.. Justification for use of power law.
The red points are the fitted values of κ (Eq. 2) computed for each of the five non-zero quantiles of |∆Value|. Error bars are s.e. The dashed line is the best fitting line on the log-log graph, which yields a slope of 0.68 ± 0.06. The quantiles are the same as those used in Figure 2.

Comment in

References

    1. Addis DR, Schacter DL. Constructive episodic simulation: temporal distance and detail of past and future events modulate hippocampal engagement. Hippocampus. 2008;18:227–237. doi: 10.1002/hipo.20405. - DOI - PubMed
    1. Bakkour A. MDMRT_scan. 8e89da1GitHub. 2019 https://github.com/abakkour/MDMRT_scan
    1. Barron HC, Dolan RJ, Behrens TE. Online evaluation of novel choices by simultaneous representation of multiple memories. Nature Neuroscience. 2013;16:1492–1498. doi: 10.1038/nn.3515. - DOI - PMC - PubMed
    1. Barry DN, Maguire EA. Remote memory and the Hippocampus: a constructive critique. Trends in Cognitive Sciences. 2019;23:128–142. doi: 10.1016/j.tics.2018.11.005. - DOI - PubMed
    1. Bartra O, McGuire JT, Kable JW. The valuation system: a coordinate-based meta-analysis of BOLD fMRI experiments examining neural correlates of subjective value. NeuroImage. 2013;76:412–427. doi: 10.1016/j.neuroimage.2013.02.063. - DOI - PMC - PubMed

Publication types