National and State Estimates of Lost Earnings From Cancer Deaths in the United States
- PMID: 31268465
- PMCID: PMC6613311
- DOI: 10.1001/jamaoncol.2019.1460
National and State Estimates of Lost Earnings From Cancer Deaths in the United States
Abstract
Importance: Information on the economic burden of cancer mortality can serve as a tool in setting policies and prioritizing resources for cancer prevention and control. However, contemporary data are lacking for the United States nationally and by state.
Objective: To estimate lost earnings due to death from cancer overall and for the major cancers in the United States nationally and by state.
Design, setting, and participants: Person-years of life lost (PYLL) were calculated using numbers of cancer deaths and life expectancy data in individuals aged 16 to 84 years who died from cancer in the United States in 2015. The annual median earnings in the United States were used to assign a monetary value for each PYLL by age and sex. Cancer mortality and life expectancy data were obtained from the National Center for Health Statistics and annual median earnings from the US Census Bureau's 2016 Current Population Survey's March Annual Social and Economic Supplement. Data analysis was performed from October 22, 2018, to February 25, 2019.
Main outcomes and measures: Lost earnings due to cancer death, represented as estimated future wages in the absence of premature death.
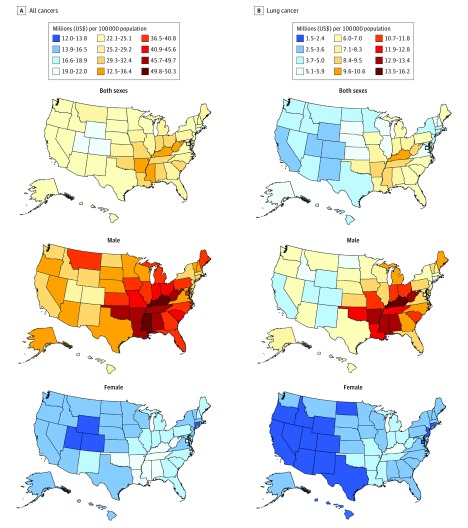
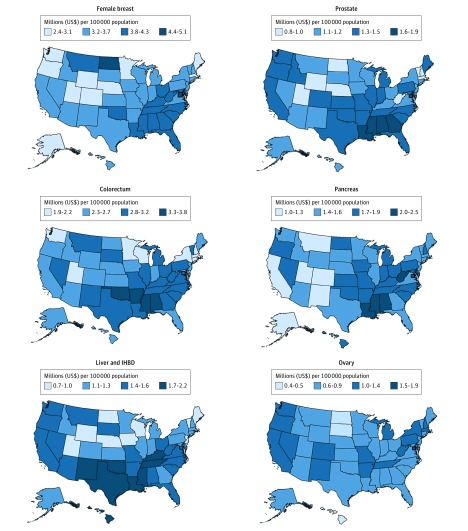
Results: A total of 8 739 939 person-years of life were lost to cancer death in persons aged 16 to 84 years in the United States in 2015, translating to lost earnings of $94.4 billion (95% CI, $91.7 billion-$97.3 billion). For individual cancer sites, lost earnings were highest for lung cancer ($21.3 billion), followed by colorectal ($9.4 billion), female breast ($6.2 billion), and pancreatic ($6.1 billion) cancer. Age-standardized lost earning rates per 100 000 were lowest in the West and highest in the South, ranging from $19.6 million (95% CI, $19.1 million-$20.2 million) in Utah to $35.3 million ($34.4 million-$36.3 million) in Kentucky. Approximately 2.4 million PYLL and $27.7 billion (95% CI, $26.9 billion-$28.5 billion) in lost earnings (29.3% of total that occurred in 2015) would have been avoided in 2015 if all states had the same age-specific PYLL or lost earning rates as Utah.
Conclusions and relevance: Our findings indicate large state variation in the economic burden of cancer and suggest the potential for substantial financial benefit through delivery of effective cancer prevention, screening, and treatment to minimize premature cancer mortality in all states.
Conflict of interest statement
Figures
References
-
- Ekwueme DU, Chesson HW, Zhang KB, Balamurugan A. Years of potential life lost and productivity costs because of cancer mortality and for specific cancer sites where human papillomavirus may be a risk factor for carcinogenesis—United States, 2003. Cancer. 2008;113(10)(suppl):2936-2945. doi: 10.1002/cncr.23761 - DOI - PubMed