

Characteristics of Industry Payments to Ophthalmologists in the Open Payments Database
- PMID: 31268495
- PMCID: PMC6613310
- DOI: 10.1001/jamaophthalmol.2019.2456
Characteristics of Industry Payments to Ophthalmologists in the Open Payments Database
Abstract
Importance: An increased awareness of the interactions between the medical industry and health care professionals may lead to lower health care costs and more effective health care practices.
Objective: To assess the characteristics of industry payments made to ophthalmologists between 2013 and 2017.
Design, setting, and participants: This analysis included data reported in the June 29, 2018, update of the Centers for Medicare & Medicaid Services Open Payments Database (OPD). The OPD contains public records of industry payments made to physicians and teaching hospitals from August 1, 2013, to December 31, 2017, as reported by the medical industry. All general or research payments distributed to US ophthalmologists and contained in the OPD were included in this study. Data are summarized by practitioner, manufacturer, payment category, and geographic location.
Main outcomes and measures: Main outcomes were the distribution, quantity, and value of payments made to ophthalmologists practicing in the United States or US territories. The financial characteristics of payment category, manufacturer, product, and location were also assessed.
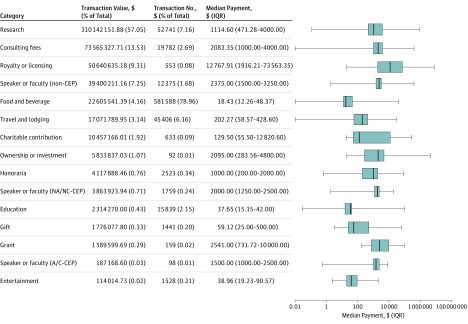
Results: This analysis revealed that the OPD showed industry reporting a total of 20 943 ophthalmologists receiving 736 517 payments worth $543 679 603.53 (1.67% of all industry-reported funds in the OPD). The median payment value was $22.44. Most payments were for food and beverages (581 588 [78.96%]), whereas most funds were allocated toward research ($310 142 151.88 [57.05%]) and consulting fees ($73 565 327.71 [13.51%]). The median payout to each ophthalmologist was $637.75 (interquartile range, $167.33-$2065.54). California was the highest-grossing state, receiving $101 135 980.34 (18.60%) of all payments. Fifteen companies were responsible for 87.68% of all funds distributed ($476 719 470.11) and were mostly involved in the production of pharmaceutical agents (anti-vascular endothelial growth factor agents, glaucoma eyedrops, and ocular lubricants) and surgical devices (cataract and glaucoma).
Conclusions and relevance: Although there is no way to know the veracity of these reports, the findings suggest the financial ophthalmologist-industry relationship is substantial. These relationships may be adding to health care costs and affecting the quality of care, although those associations were not evaluated in this study.
Conflict of interest statement
Figures
Similar articles
-
Physician-Industry Interactions and Anti-Vascular Endothelial Growth Factor Use Among US Ophthalmologists.JAMA Ophthalmol. 2016 Aug 1;134(8):897-903. doi: 10.1001/jamaophthalmol.2016.1678. JAMA Ophthalmol. 2016. PMID: 27356110 Free PMC article.
-
Exploring the Industry-Dermatologist Financial Relationship: Insight From the Open Payment Data.JAMA Dermatol. 2016 Dec 1;152(12):1307-1313. doi: 10.1001/jamadermatol.2016.3037. JAMA Dermatol. 2016. PMID: 27706478
-
Accuracy Between AJSM Author-Reported Disclosures and the Centers for Medicare and Medicaid Services Open Payments Database.Am J Sports Med. 2018 Mar;46(4):969-976. doi: 10.1177/0363546517750124. Epub 2018 Jan 30. Am J Sports Med. 2018. PMID: 29382212
-
Industry Payments to Adult Reconstruction-Trained Orthopedic Surgeons: An Analysis of the Open Payments Database From 2014 to 2019.J Arthroplasty. 2021 Nov;36(11):3788-3795. doi: 10.1016/j.arth.2021.07.004. Epub 2021 Jul 15. J Arthroplasty. 2021. PMID: 34362596 Review.
-
Assessment of Pharmaceutical Company and Device Manufacturer Payments to Gastroenterologists and Their Participation in Clinical Practice Guideline Panels.JAMA Netw Open. 2018 Dec 7;1(8):e186343. doi: 10.1001/jamanetworkopen.2018.6343. JAMA Netw Open. 2018. PMID: 30646328 Free PMC article. Review.
Cited by
-
Trends and Characteristics of Industry Payments for Ophthalmology Research From 2014 to 2020.JAMA Ophthalmol. 2022 Oct 13;140(11):1105-9. doi: 10.1001/jamaophthalmol.2022.3986. Online ahead of print. JAMA Ophthalmol. 2022. PMID: 36227612 Free PMC article.
-
Physicians payment in the United States between 2014 and 2018: An analysis of the CMS Open Payments database.PLoS One. 2021 Jun 2;16(6):e0252656. doi: 10.1371/journal.pone.0252656. eCollection 2021. PLoS One. 2021. PMID: 34077460 Free PMC article.
-
A Ray of Sunshine: Transparency in Physician-Industry Relationships Is Not Enough.J Gen Intern Med. 2021 Oct;36(10):3194-3198. doi: 10.1007/s11606-021-06657-0. Epub 2021 Mar 10. J Gen Intern Med. 2021. PMID: 33694070 Free PMC article.
-
Exploring the Psychiatrist-Industry Financial Relationship: Insight from the Open Payment Data of Centers for Medicare and Medicaid Services.Adm Policy Ment Health. 2020 Jul;47(4):526-530. doi: 10.1007/s10488-020-01009-2. Adm Policy Ment Health. 2020. PMID: 31916072 Free PMC article.
-
Comparing pharmaceutical company payments in the four UK countries: a cross-sectional and social network analysis.BMJ Open. 2023 Mar 29;13(3):e061591. doi: 10.1136/bmjopen-2022-061591. BMJ Open. 2023. PMID: 36990486 Free PMC article.
References
-
- Centers for Medicare & Medicaid Services 2019. https://openpaymentsdata.cms.gov. Accessed January 15, 2019.
-
- American Board of Ophthalmology Verify a physician. https://abop.org/verify-a-physician/ Accessed January 15, 2019.
-
- United States Census Bureau American fact finder. Annual estimates of the resident population: April 1, 2010 to July 1, 2017. https://factfinder.census.gov/faces/tableservices/jsf/pages/productview..... Accessed January 15, 2019.
-
- American Academy of Ophthalmology Eye health statistics. https://www.aao.org/newsroom/eye-health-statistics#_edn25. Accessed January 15, 2019.
